
鲜肉中不饱和脂肪酸近红外检测方法优化
[牛晓颖1  , 邵利敏
, 邵利敏2 , 赵志磊1, * , 焦慎江1 , 李晓灿1 , 董芳1 ]
, 邵利敏, 焦慎江|
|


作者简介: 牛晓颖, 女, 1980年生, 河北大学质量技术监督学院副教授 E-mail: xiaoyingniu@126.com
不饱和脂肪酸是鲜肉脂肪的基本组成成分, 其种类和含量直接影响鲜肉的风味和品质。 不同于用时长, 破坏样品的气相色谱法, 近红外分析可快速, 无损地对鲜肉中不饱和脂肪酸进行定量检测。 选取了驴肉, 牛肉, 羊肉和猪肉鲜肉样品共63个, 在4 000~12 500 cm-1波段上, 分别采集了肉块样品和粉碎口径3 mm的肉糜样品在5, 10, 15, 20, 25, 30, 35 ℃下的近红外漫反射光谱, 并使用气相色谱法作为参考检测了样品的不饱和脂肪酸含量。 为优化模型性能, 比较了不同温度下肉块和肉糜样品全波段光谱的棕榈油酸、 亚油酸、 油酸、 二十四碳一烯酸和总不饱和脂肪酸的偏最小二乘模型参数, 发现棕榈油酸和总不饱和脂肪酸的5 ℃肉糜光谱模型, 亚油酸的35 ℃和油酸的25 ℃肉糜光谱模型, 以及二十四碳一烯酸的15 ℃肉块光谱模型较佳, 且温度对模型的影响不具有明显的规律性。 在较佳模型的基础上, 分别以220, 440, 881和1 762个变量为窗口区间, 使用前向和反向区间偏最小二乘法对波长进行了优选, 发现棕榈油酸、 亚油酸、 油酸和总不饱和脂肪酸以220个变量作为窗口的反向区间偏最小二乘模型, 以及二十四碳一烯酸以440个变量为窗口的前向区间偏最小二乘模型较佳, 且预测性能均优于全波段PLS模型。 其中棕榈油酸的建模波段为: 4 425~4 636, 4 849~5 272, 5 486~5 696.7, 7 398.6~7 818, 8 031.1~8 666.5, 9 947~10 363.6, 12 495.5~12 498.4 cm-1; 亚油酸的建模波段为: 4 000.6~4 423.9, 5 273.4~5 698.6, 7 398.6~9 090.8, 10 576.7~10 787.8, 12 495.5~12 498.4 cm-1; 油酸的建模波段为: 4 000.6~4 423.9, 4 637~4 848.2, 7 398.6~8 242.3, 8 455.4~9 090.8, 9 947~10 787.8, 12 495.5~12 498.4 cm-1; 二十四碳一烯酸的建模波段为: 4 849.1~5 272.4 cm-1; 总不饱和脂肪酸的建模波段为: 4 000.6~4 423.9, 4 637~5 698.6, 9 097.5~9 515.1, 9 940.3~10 575.7, 11 646~12 060.6, 12 273.7~12 498.4 cm-1。 使用偏最小二乘法对优选波长光谱数据进行降维, 利用得到的潜在变量作为各指标最小二乘-支持向量机模型的输入, 并和各指标的区间偏最小二乘模型进行了性能的比较, 发现最小二乘-支持向量机模型的各指标定量结果最优。 棕榈油酸、 亚油酸、 油酸、 二十四碳一烯酸和总不饱和脂肪酸最优模型的校正集相关系数和均方根误差, 以及留一交叉验证相关系数, 均方根误差及相对预测误差分别为: 0.974, 1.403 mg·(100 g)-1, 0.973, 1.428 mg·(100 g)-1, 4.31; 0.99, 2.233 mg·(100 g)-1, 0.99, 2.263 mg·(100 g)-1, 7.21; 0.982, 8.194 mg·(100 g)-1, 0.982, 8.223 mg·(100 g)-1, 5.19; 0.921, 0.224 mg·(100 g)-1, 0.92, 0.225 mg·(100 g)-1, 2.52; 0.996, 24.21 mg·(100 g)-1, 0.995, 26.045 mg·(100 g)-1, 10.01。 其中, 亚油酸、 油酸和总不饱和脂肪酸最优模型的交叉验证相对预测误差超过5, 棕榈油酸最优模型的交叉验证相对预测误差接近5, 二十四碳一烯酸的交叉验证相对预测误差接近3, 各指标最优模型的预测性能较为令人满意。 研究结果表明, 波段优选, 偏最小二乘降维以及最小二乘-支持向量机算法的结合可对鲜肉中单个不饱和脂肪酸及总不饱和脂肪酸指标的近红外光谱定量结果进行有效的优化。
Unsaturated fatty acids (UFA) are basic composition of fresh meat fat. The composition and content of UFA in fresh meat directly determine its flavor and quality. Differing from being time consuming and causing sample destruction of Gas chromatography, Near-infrared spectroscopy can be used to determine UFA in meat rapidly and non-destructively. NIR diffuse reflectance spectra of sixty-three fresh meat samples including donkey meat, beef, mutton and pork were acquired in the band of 4 000~12 500 cm-1 at temperatures of 5, 10, 15, 20, 25, 30 and 35 ℃. Gas chromatography was used as the reference method to determine the composition and content of UFA in samples. Partial least square (
脂肪酸是鲜肉脂肪的基本组成成分之一。 不饱和脂肪酸及多种单个不饱和脂肪酸如棕榈油酸, 亚油酸, 油酸等的组成和含量直接影响肉品的风味和加工品质[1]。 脂肪酸检测一般使用毛细管气相色谱法, 该方法具有前处理复杂繁琐, 成本高及不够环保等缺点[2]。 近些年, 使用近红外光谱快速, 无损地检测新鲜肉品中的脂肪酸含量成为研究热点[2, 3, 4, 5, 6, 7, 8, 9]。 但模型的预测性能需要改善, 同时, 未见使用近红外对驴肉脂肪酸含量进行检测的研究文献。
本工作建立并优化了驴肉, 牛肉, 羊肉和猪肉鲜肉中不饱和脂肪酸的近红外检测模型, 比较了不同温度(
选取了63个鲜肉样品, 包括40个驴肉样品(
使用德国布鲁克公司的MPA近红外光谱仪及OPUS 6.0软件采集了样品的漫反射光谱, 波段为4 000~12 500 cm-1。 光谱采集使用的检测器为Pbs, 分辨率2 cm-1, 扫描次数32次。 为控制样品温度, 将样品放置在生化培养箱(上海飞越LRH-70)中进行0.5~1 h的温度平衡, 光谱采集前使用手持式红外测温仪(美国福禄克MT4 MAX)测量样品温度。
采集光谱后, 根据国标GB/T 5413.27— 2010《婴幼儿食品和乳品中脂肪酸的测定》制备样品, 然后使用气相色谱仪(安捷伦GC450)进行测定。 条件如下, 色谱柱: 固定液100%二氰丙基聚硅氧烷(100 m× 0.25 mm, 0.20 μ m); 载气和流速: 氮气1.0 mL· min-1; 进样口温度: 260 ℃; 分流比: 30: 1; 检测器温度: 280 ℃; 柱温箱: 初始温度140 ℃, 保持5 min, 以4 ℃· min-1升温至240 ℃, 保持15 min; 进样量: 1.0 μ L。
图1为不同温度肉块样品的平均光谱, 光谱在4 000~7 500 cm-1波段上几乎完全重叠在一起, 在7 500~12 500 cm-1波段的吸光度略有区别, 但没有规律性。 肉糜样品光谱也呈现类似特点。 将杠杆系数和学生化残差明显较大的样品作为异常样品剔除, 棕榈油酸、 亚油酸、 油酸、 二十四碳一烯酸和总不饱和脂肪酸的肉块/肉糜样品集分别剩余62, 62, 61/60, 61, 62/63个样品作为校正集, 样品集统计数据见表1。
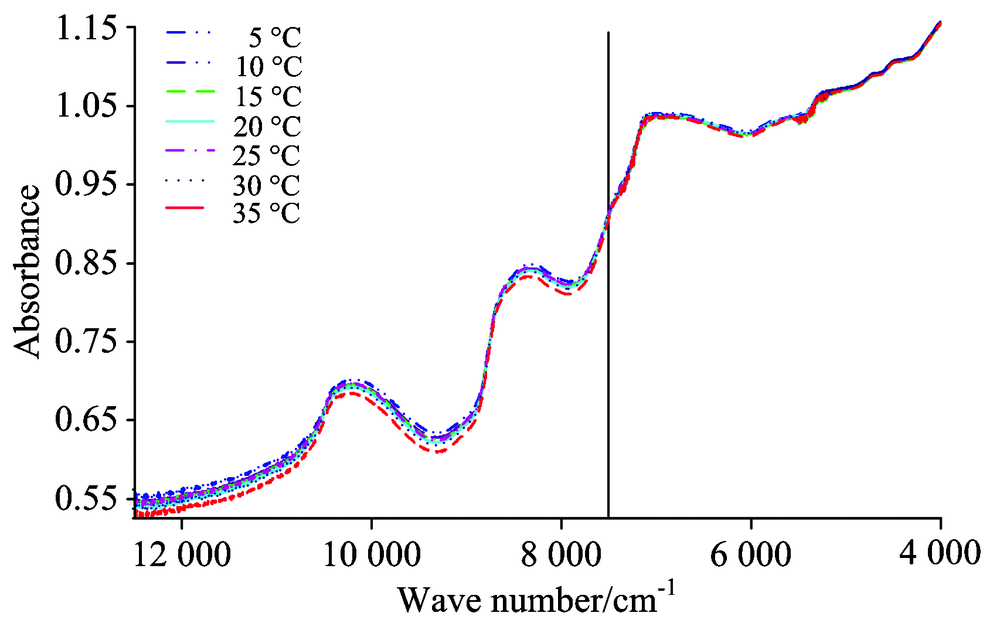 | 图1 不同温度肉块样品的平均光谱Fig.1 Average spectra of intact samples at different temperatures |
| 表1 样品集统计数据 Table 1 Characteristic of intact and minced sample sets |
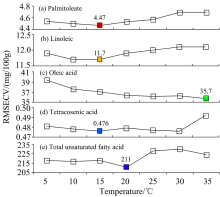
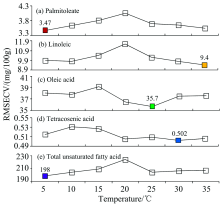
用全波段建立了不同温度下各指标在肉块样品和肉糜样品中的定量模型, 并比较了各模型的交叉验证均方根误差(root mean square error of cross validation, RMSECV), 见图2和图3。 比较图2和图3可发现, 肉糜样品的棕榈油酸, 亚油酸和总不饱和脂肪酸模型RMSECV明显小于肉块样品模型; 油酸的肉块和肉糜模型的RMSECV相同, 但肉糜模型因子数为7, 小于肉块模型的10, 因此认为肉糜模型较优; 二十四碳一烯酸的肉块模型略优于肉糜模型。
 | 图2 不同温度肉块样品PLS模型的RMSECVFig.2 RMSECV of PLS models with spectra of intact samples at different temperatures |
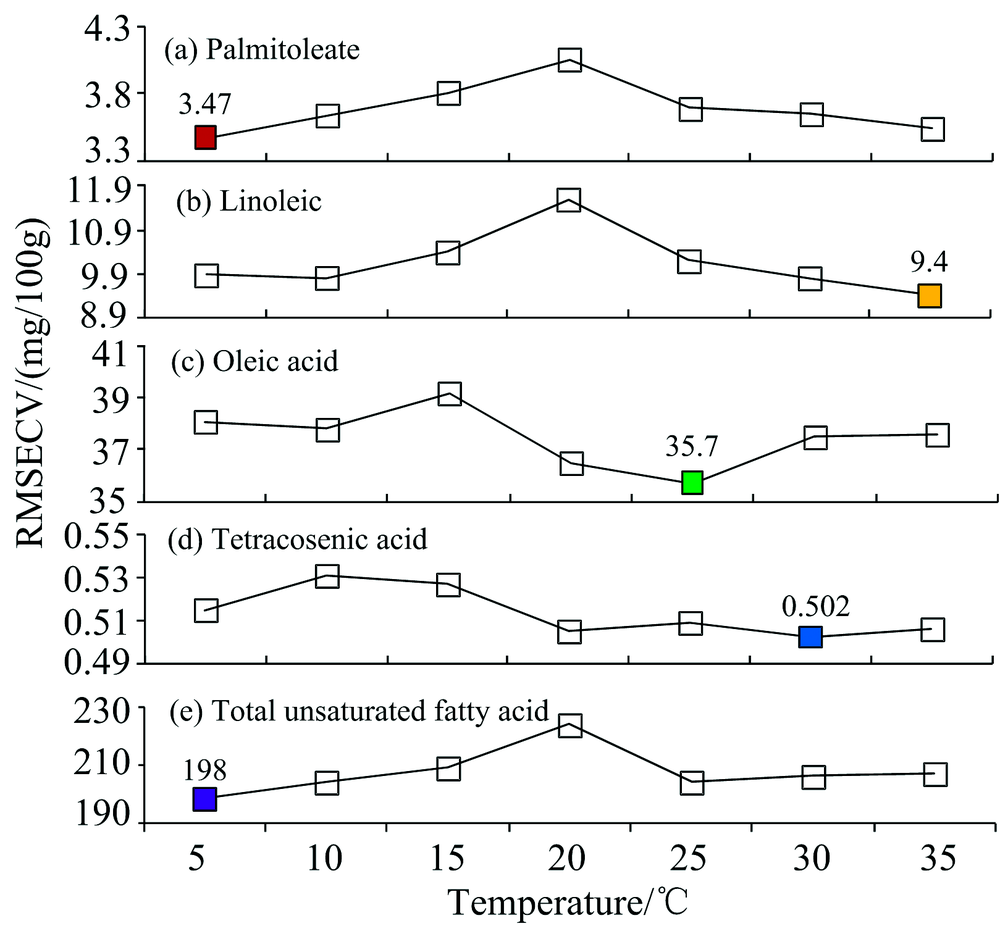 | 图3 不同温度肉糜样品PLS模型的RMSECVFig.3 RMSECV of PLS models with spectra of minced samples at different temperatures |
比较了以220, 440, 881和1 762个变量为窗口区间的前向iPLS(forward iPLS, FiPLS)和反向iPLS(reverse iPLS, RiPLS)模型性能。 棕榈油酸、 亚油酸、 油酸和总不饱和脂肪酸均在使用RiPLS方法以220个变量为窗口时得到较优模型, 而二十四碳一烯酸以440个变量为窗口的FiPLS模型较优, 各模型RMSECV均低于全波段PLS模型, 见表2。 但交叉验证相对预测误差(ratio of prediction to deviation of cross validation, RPDcv)为1.3~2.25, 仍需提高。 同时, 筛选出的建模波段大多与脂肪酸中C— H官能团的振动有关, 如棕榈油酸模型所使用的4 424.9~4 636, 5 485.5~5 696.7, 8 031.1~8 666.5和9 947~10 363.6 cm-1波段分别覆盖了C— H振动的组合频, 一级, 二级和三级倍频出现的区域[10] 。
| 表2 iPLS模型参数 Table 2 Parameters of iPLS models |
提取了优选波段上PLS模型的潜在变量(latent variables, LVs)输入到各指标的LS-SVM模型中, 结果见表3。 建模所使用的核函数为径向基核函数。 核函数的核参数和回归误差权重的寻优采用留一交叉验证进行。 比较表3和表2发现, 各指标的RPDcv均有较大提高, RMSEC与RMSECV值非常相近, 模型性能更加稳定。 从表3还可发现, 本模型的RPDcv参数均高于前人研究文献, 说明预测性能较优。 亚油酸, 油酸和总不饱和脂肪酸LS-SVM模型的RPDcv超过了5, 棕榈油酸模型接近5, 表明模型的预测性能优秀, 精度较高; 二十四碳一烯酸的RPDcv为2.52, 超过2, 模型校正性能较好, 可用于预测。
| 表3 基于优选波长潜在变量的LS-SVM模型参数及与前人文献的比较 Table 3 Parameters of LS-SVM models with LVs extracted from selected bands, and RPDcv reported by other researchers |
比较了不同温度肉块和肉糜样品光谱不饱和脂肪酸的全波段PLS模型, 发现温度对模型的影响没有明显的规律性。 使用iPLS方法优选波长, 以其潜在变量作为输入的LS-SVM模型最优。 棕榈油酸、 亚油酸、 油酸、 二十四碳一烯酸和总不饱和脂肪酸最优模型的RPDcv分别为4.31, 7.21, 5.19, 2.52和10.01, 均优于前人研究文献中报道的精度。 结果表明, 波段优选, PLS降维以及LS-SVM算法相结合可使鲜肉不饱和脂肪酸的近红外检测结果有效优化。
The authors have declared that no competing interests exist.
| [1] |
|
| [2] |
|
| [3] |
|
| [4] |
|
| [5] |
|
| [6] |
|
| [7] |
|
| [8] |
|
| [9] |
|
| [10] |
|