一种基于光谱局部趋势的谱线自适应度量方法
[王玉鹏1  , 蔡江辉
, 蔡江辉2, * , 杨海峰2, * , 周立婵1 , 史晨辉1 , 李砚峰2 ]
, 蔡江辉, 杨海峰, 周立婵|
|


作者简介: 王玉鹏, 1989年生, 太原科技大学电子信息工程学院博士研究生 e-mail: yupengwang@tyust.edu.cn
Lick线指数是一种衡量谱线强度的重要指标。 目前计算Lick线指数的方法中谱线轮廓的波长范围是通过对固定区间求取均值来实现的, 这种方法获取的轮廓范围难以准确反映单条光谱谱线的实际强弱, 从而影响Lick线指数的准确性与可靠性。 为此, 本文介绍了一种基于光谱局部趋势特征的谱线强度自适应度量方法。 首先, 根据谱线的特征定义一个边界因子n, 用于限定谱线轮廓的极限范围。 其次, 计算谱线线芯波长左右两侧的斜率以捕捉趋势信息, 根据趋势增减性的变化, 分别获取两侧距离线芯波长最近的 n个流量峰(或谷)值。 随后, 选取其中的最大(小)流量值及对应波长作为谱线轮廓的边界点。 最后, 基于此边界点使用等值宽度(EW)或星等(Mag)公式分别计算线指数值, 以此数值来度量谱线特征的强弱。 通过对F、 G与K型恒星光谱中的Ca4227, Hβ, Mgb及Hα吸收线的强弱进行度量, 分别从三个角度对比分析了自适应度量方法与固定区间度量方法的差异。 首先, 自适应方法获取的Adaptive EW值与固定区间法获取的EW值的二维散点分布图显示, 绝大部分数据点呈现一定聚集趋势, 但并非完全沿对角线分布, 表明两种方法均具有一定的稳定性, 但在计算结果上存在系统性差异。 其次, 两者的统计结果显示Adaptive EW的均值与标准差均高于EW的, 说明自适应方法在捕获光谱细节变化方面更为敏感, 能够捕捉到因恒星个体差异、 观测条件波动等因素引起的谱线变化, 进而更真实地反映谱线强弱。 最后, 通过人眼检测两种方法获取的谱线轮廓范围表明, 自适应方法能够根据谱线的实际情况, 动态调整边界点的位置, 从而更准确地确定谱线的轮廓范围。 因此, 自适应获取谱线轮廓范围的方法为度量个例谱线强弱提供了一种有效途径。
Lick indices are an important metrics for measuring spectral line strength. In the current methods for calculating the Lick index, the wavelength range of the spectral line profile is determined by taking the mean over a fixed interval. This approach often fails to accurately capture the actual strength of individual spectral lines, thereby compromising the accuracy and reliability of the Lick index. To address this problem, this paper introduces an adaptive spectral line measurement method based on local trend characteristics. Firstly, a boundary factor n is defined according to the spectral line characteristics to limit the extreme range of the spectral line profile. Secondly, the slopes on blue and red bands of the core wavelength of the spectral line are calculated to capture the trend information. According to the increasing or decreasing trends changes, n flux peaks (or valleys) closest to the core wavelength on both sides are obtained respectively. Subsequently, the maximum (minimum) flux values and the corresponding wavelengths are selected as the boundary points of the spectral line profile. Finally, based on these boundary points, the line index is calculated through either Equivalent Width (EW) or Magnitude (Mag) formulations, and this value is used to measure the strength of the spectral line feature. By measuring the strength of Ca4227, Hβ, Mgb, and H alpha absorption lines in F, G, and K-type stellar spectra, this paper compares and analyzes the differences between the adaptive and fixed interval measurement methods from three perspectives. First, the scatter distribution map of the Adaptive EW values obtained by the adaptive method and the EW values obtained by the fixed interval method shows that most data points exhibit certain aggregation trends, but are not completely distributed along the diagonal, indicating that both methods are stable. Still, there are systematic differences in the calculation results. Second, the statistical results of two methods show that the mean and standard deviation of Adaptive EW are higher than those of EW, indicating that the adaptive method is more sensitive in capturing spectral detail changes, can capture spectral line changes caused by factors such as stellar individual differences and observational condition fluctuations, and thus more truly reflects the strength of the spectral line. Finally, by visually inspecting the spectral line profile range obtained by the two methods, it is shown that the adaptive method can dynamically adjust the position of the boundary points according to the actual situation of the spectral line, thereby more accurately determining the profile range of the spectral line. Therefore, the adaptive profile boundary detection method establishes an effective approach for quantifying line strengths in individual spectra.
光谱线指数作为光谱数据的物理特征值, 能有效表示光谱数据, 降低光谱数据维度, 减少噪声干扰, 因此在恒星光谱研究中得以广泛应用[1, 2]。 例如, Yang等使用线指数进行光谱聚类与分类[3, 4]; Zhang等借助线指数测定二进制分数[5]; Doorenbos等使用线指数得出星系特性的稳健值[6], Ko等则使用线指数对恒星种群模型进行校准[7]。
光谱线指数系统中最为常用的是Lick线指数系统[2, 8]。 Lick线指数利用谱线的中心波段及蓝、 红两端连续谱波段, 测量光谱中特定吸收线或分子带相对于连续谱的强度[9, 10, 11]。 这些固定设置的波段范围具有一定的统计优势。 但其难以适应所有光谱谱线特性, 导致等值宽度(equivalent width, EW)或星等(magnitude, Mag)值准确性受限, 使其无法精准表征天体光谱谱线的强弱。
为此, 利用光谱的局部趋势特征提出了一种自适应获取谱线轮廓范围的方法, 并使用该范围计算的线指数来度量谱线的强弱。 首先计算谱线蓝、 红两端各点的斜率以获取谱线的局部趋势信息, 然后通过趋势增减性的变化分别获取蓝、 红两端距离线芯波长最近的n个流量峰(谷)值, 最后将其中的最大(小)流量值及其对应的波长记作谱线轮廓范围的边界点。
对于吸收线, 首先计算其蓝、 红两端相邻两点之间的差值以获取各点的局部趋势特征。 在波长λ 处, 其斜率计算公式为S(λ )=flux(λ )-flux(λ +1)。 比较蓝、 红两端各点的趋势变化获取流量峰值
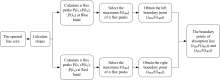
式(1)中, P(λ )为流量峰值。 然后根据吸收线的特征定义一个边界因子n, 用以界定吸收线轮廓的极限范围, 即使用式(1)分别获取蓝、 红两端距离线芯波长最近的n个流量峰值。 将其中的最大流量峰值及对应波长记作该吸收线轮廓范围的边界点, 并对边界点进行插值得到伪连续谱。 边界点流量值的计算公式为F(λ 0)=max{P(λ 1), P(λ 2), …, P(λ n)}, 其中, λ 0=argmax{P(λ 1), P(λ 2), …, P(λ n)}为其对应波长。 吸收线轮廓范围的自适应确定流程如图1所示。
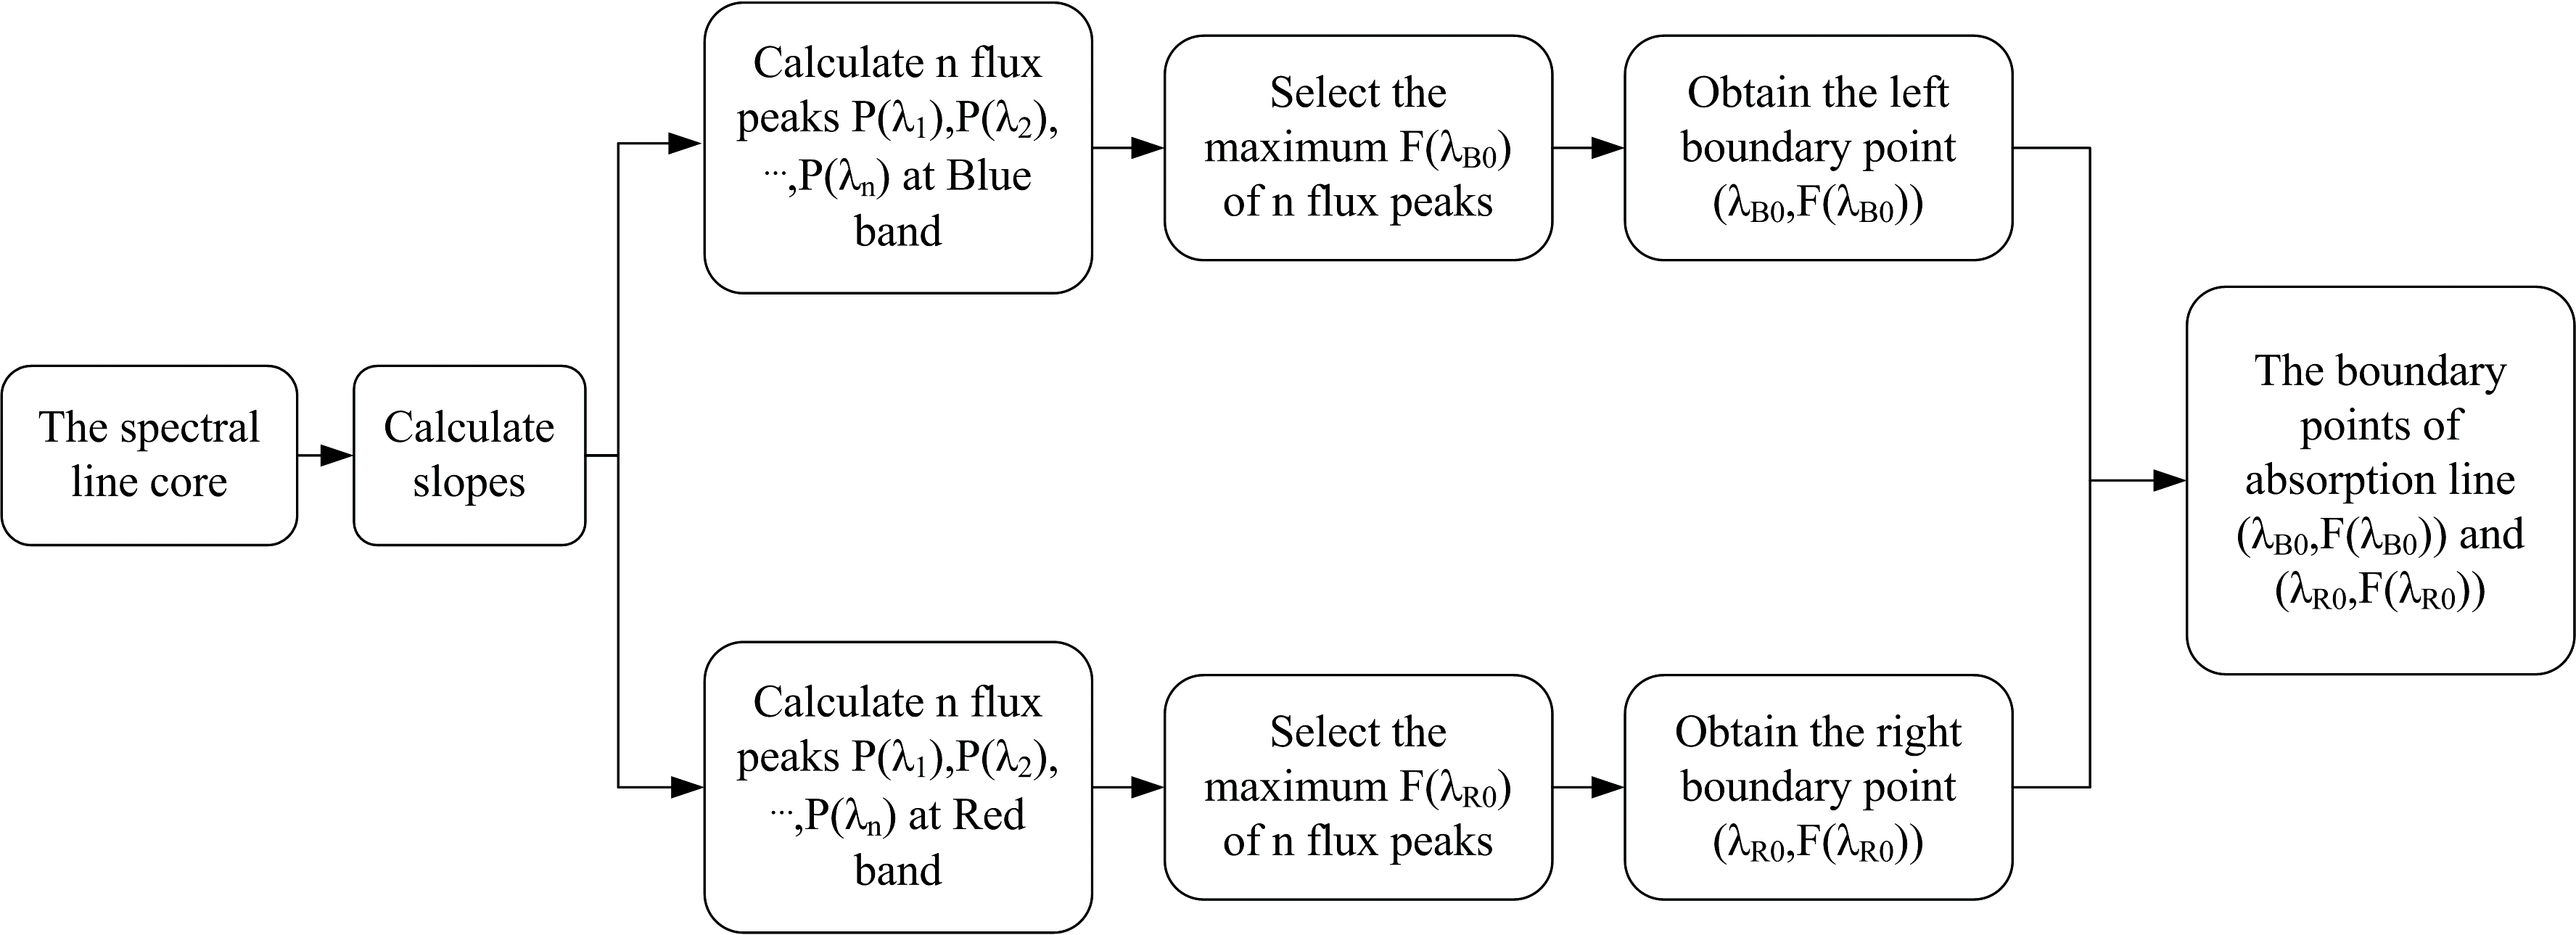 | 图1 吸收线轮廓范围的自适应确定方法Fig.1 Adaptive determination method for the profile of absorption line |
大天区多目标光纤光谱天文望远镜(LAMOST)[13, 14]已完成了对超过2 000万个天体的光谱观测, 并发布了相应的光谱数据。 实验选取了LAMOST DR10恒星光谱数据库的96 000条g波段, r波段及i波段信噪比大于10的光谱数据, 包括F、 G及K型恒星光谱数据各32 000条。 为消除噪声及尺度差异对实验结果的影响, 采用高斯核标准差(σ )为 0.5的高斯滤波器对光谱进行平滑去噪, 并用min-max函数将数据归一化到[0, 1]。 分别对吸收线Ca4227, Hβ , Mgb及Hα 的强弱进行了度量与分析。 依据经验及吸收线的强弱及复杂性, 将Hβ 及Hα 的边界因子n取值为5; Ca4227与Mgb的n取为3。
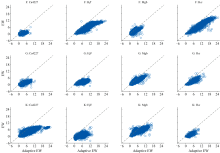
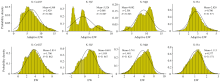
图2分别展示了F、 G及K型恒星光谱数据中各吸收线的两种线指数的散点分布情况。 其中, 各类型恒星光谱吸收线的两种线指数的散点分布均较为紧凑, 表明Adaptive EW方法在处理各类恒星复杂且多变的光谱吸收线时, 能有效确保计算结果的稳定性。 此外, 各吸收线的线指数的散点大多聚集于对角线下方, 表明Adaptive EW值普遍大于EW值, 说明两种方法存在一定差异, 且Adaptive EW能捕获复杂光谱的局部细节变化, 精准测定其范围与强度。
 | 图2 F、 G及K型恒星光谱中各吸收线的线指数值的散点分布图Fig.2 Scatter plots of line indices for absorption lines in F, G and K-type stellar spectra |
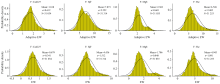
图3— 图5分别展示了F、 G及K型恒星光谱各吸收线的两种线指数处于(Mean-3δ , Mean+3δ )内的统计结果。 图3显示, F型恒星光谱各吸收线的Adaptive EW的均值与标准差均高于EW的。 对于吸收特征较强的Hβ 与Hα , 较小的EW值无法准确刻画吸收特征。 此外, 通过选取(Mean-3δ , Mean+3δ )区间内的线指数, 以降低低质量光谱的干扰。 而EW值仍存在负值, 使用这些负值描述吸收线强弱不符合物理逻辑。 可见EW方法中的固定范围无法适应光谱吸收线的真实变化, 而导致错误的量化结果。 Adaptive EW方法则能依据吸收线的局部趋势特征动态且灵活地确定其宽度与强度。
 | 图3 F型恒星光谱各吸收线Adaptive EW值及EW的统计结果Fig.3 Statistical results of Adaptive EW and EW values for absorption lines in F-type stellar spectra |
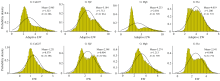
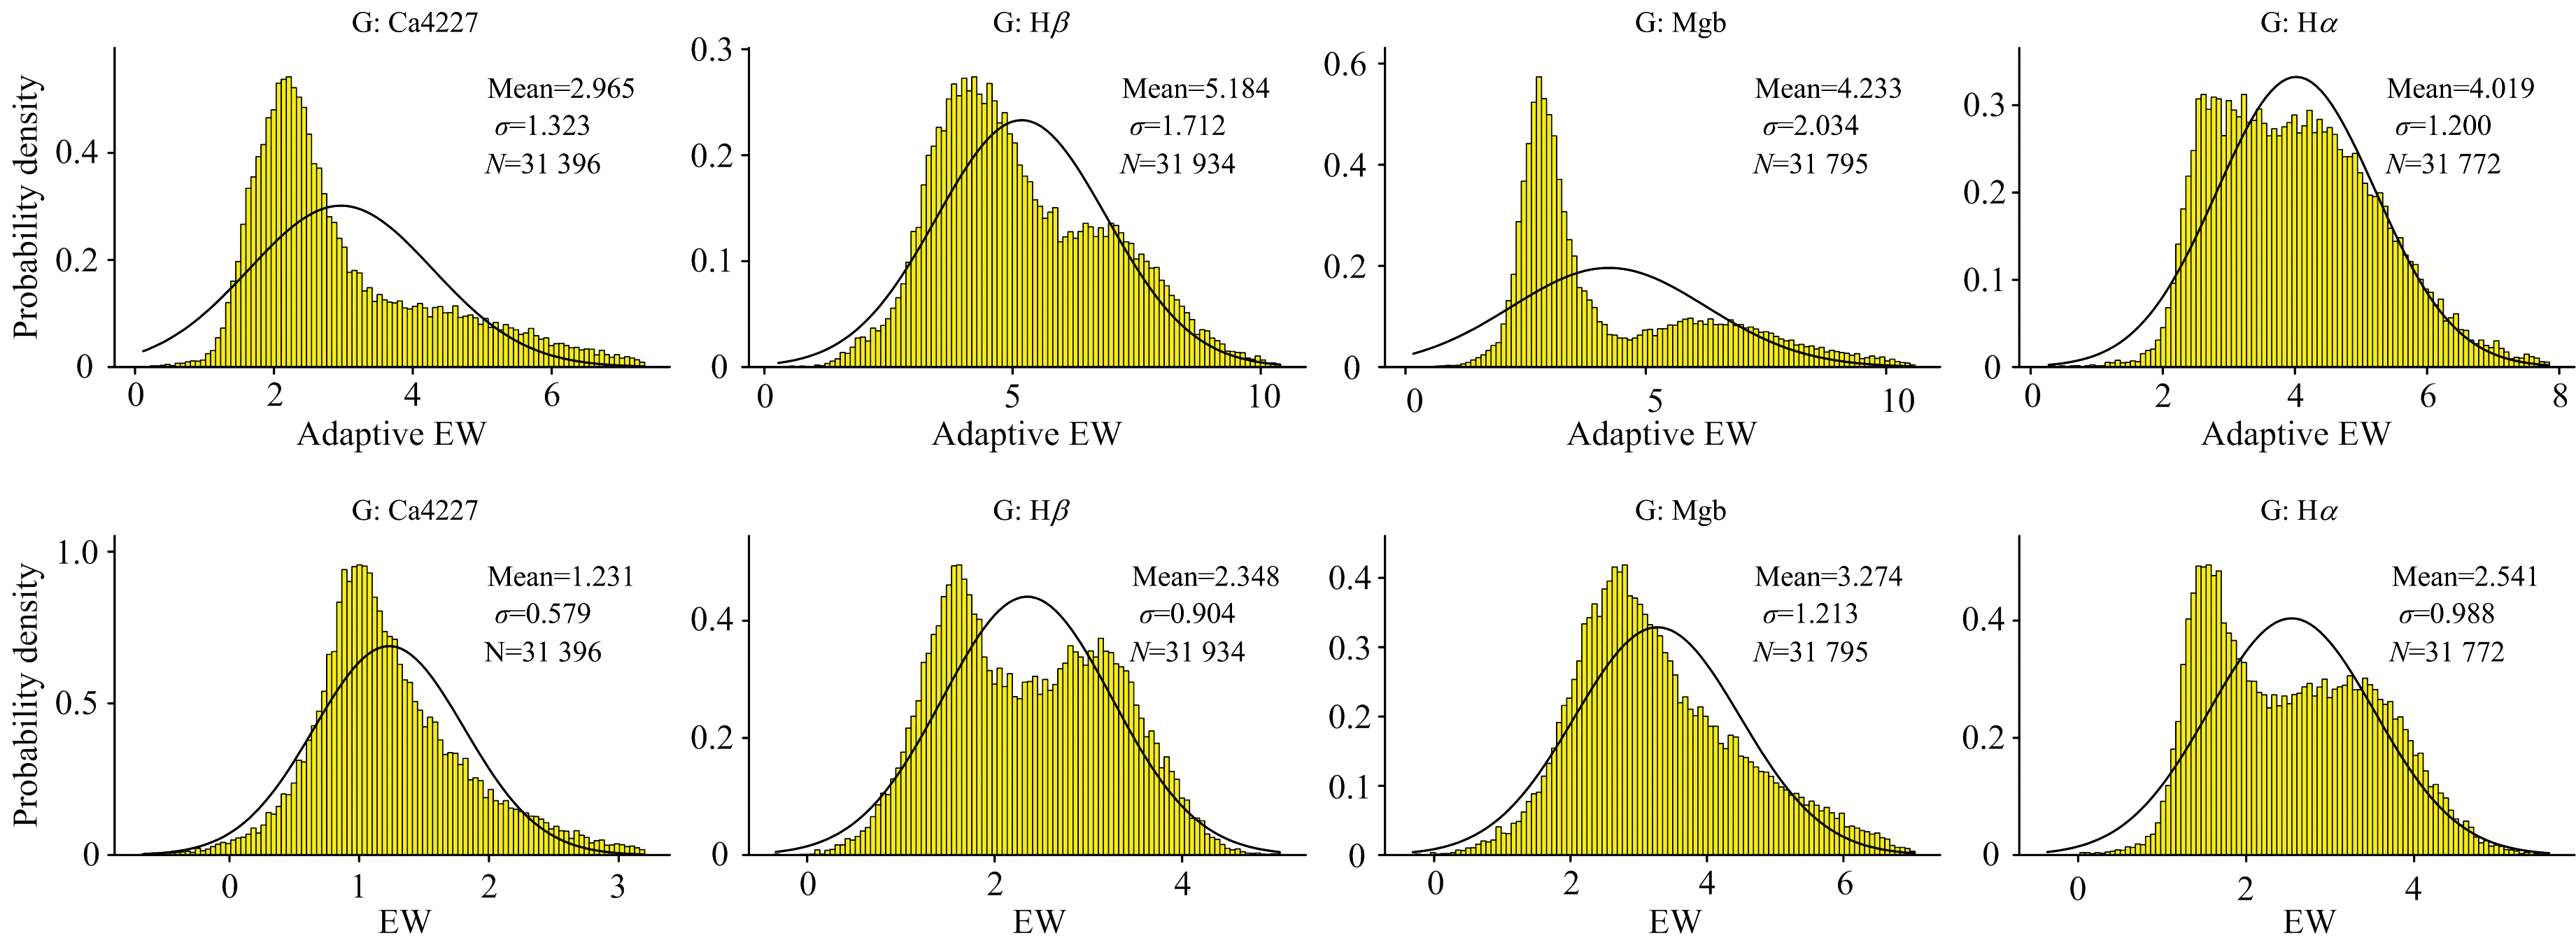 | 图4 G型恒星光谱各吸收线Adaptive EW值及EW的统计结果Fig.4 Statistical results of Adaptive EW and EW values for absorption lines in G-type stellar spectra |
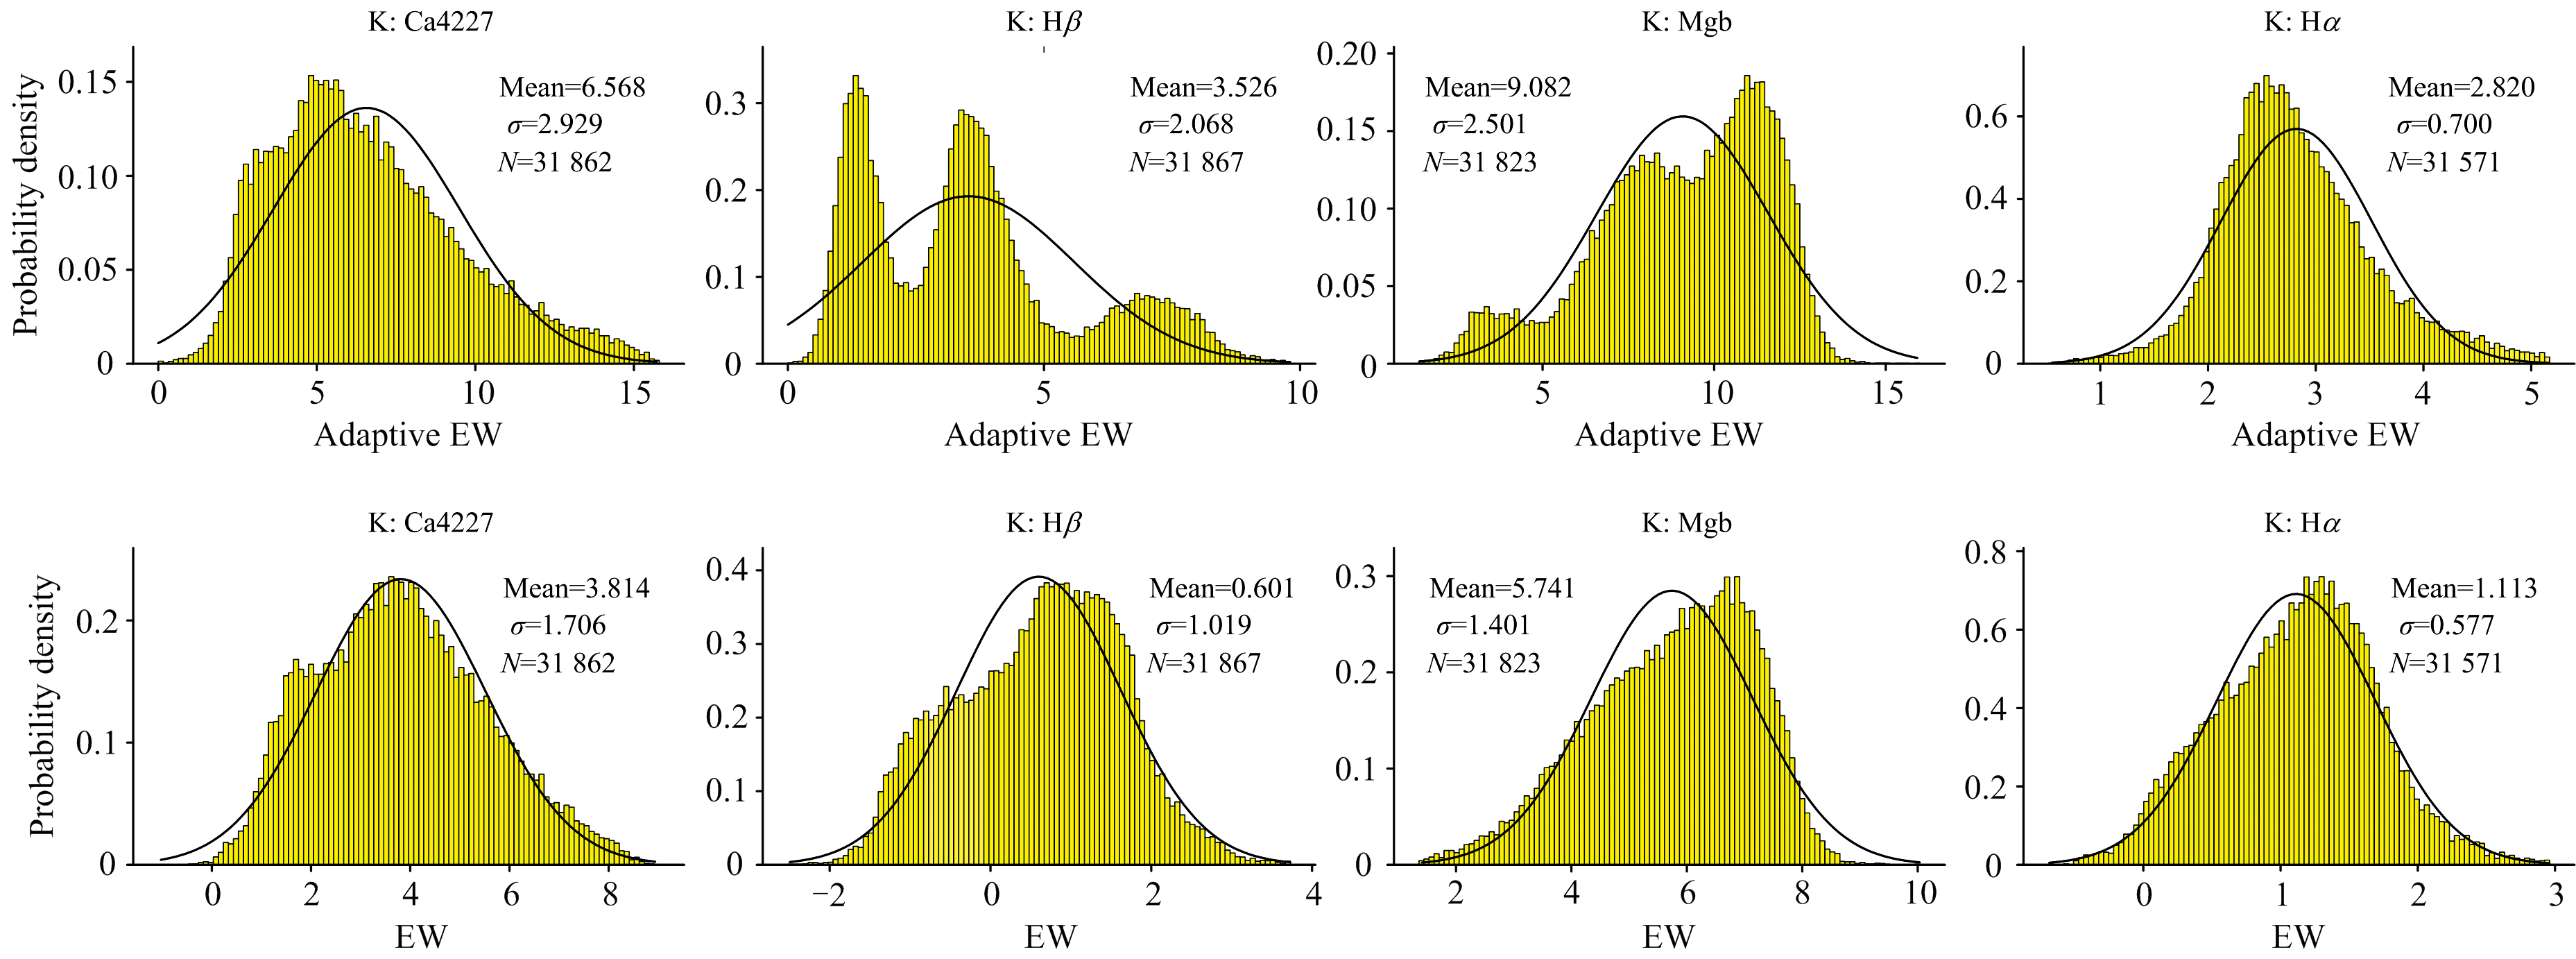 | 图5 K型恒星光谱各吸收线Adaptive EW值及EW的统计结果Fig.5 Statistical results of Adaptive EW and EW values for absorption lines in K-type stellar spectra |
图4及图5中G、 K型光谱的统计结果表明除了Hβ 及Hα 外, Mgb的吸收特征也较强, 且各吸收线的Adaptive EW标准差均大于EW的, 表明Adaptive EW方法在处理不同类型恒星光谱时具有更为复杂和多元的特性。
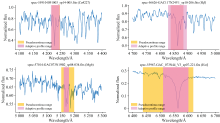
Adaptive EW值虽然更能反映吸收线的强弱, 但其离散度较大。 为验证Adaptive EW值的合理性, 图6— 图8直观展示了三种类型光谱各吸收线以两种方法获取的轮廓范围。 其中, 黄色区域为伪连续谱范围, 浅紫色区域为自适应轮廓范围。
 | 图6 F型光谱各吸收线的固定轮廓范围及自适应轮廓范围Fig.6 The fixed and adaptive profile ranges of absorption lines in F-type stellar spectra |
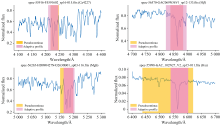
 | 图7 G型光谱各吸收线的固定轮廓范围及自适应轮廓范围Fig.7 The fixed and adaptive profiles of absorption lines in G-type stellar spectra |
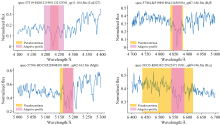
 | 图8 K型光谱各吸收线的固定轮廓范围及自适应轮廓范围Fig.8 The fixed and adaptive profiles of absorption lines in K-type stellar spectra |
由图6可知, 通过自适应方法获取的吸收线轮廓更合理。 例如吸收线Hβ 及Hα 的吸收强度较深, 由固定方法获取的Hβ 伪连续谱的范围过窄, Hα 的则过宽。 对吸收线Mgb, 图6中光谱通过固定区间的方法获取的伪连续谱范围, 在准确性上存在明显不足。 此外, 图6中吸收线Ca4227、 Hβ 、 Mgb及Hα 的EW分别为2.106 1、 -0.112 7、 -1.027 2及14.961 3; Adaptive EW分别为6.193 7、 1.956 8、 1.248 6、 22.729 9。 显然, 对于吸收特征较为明显的吸收线Hβ 与Mgb, 使用负EW值反映它们吸收强度是不准确的。 图7及图8显示G、 K型恒星光谱吸收线通过固定区间的方法获取的伪连续谱范围在刻画复杂吸收线强度时也不够准确。 而通过局部趋势特征自适应获取的边界, 能更准确地反映各吸收线的轮廓范围。
提出了一种基于光谱局部趋势特征自适应获取谱线轮廓范围边界点的方法, 并利用该范围的边界点计算出的线指数来度量谱线的强弱。 三类恒星光谱的实验分析表明, 相比固定区间的方法, 通过局部趋势变化获取的轮廓范围, 及以此得到的Adaptive EW, 在面对复杂光谱时能真实反映谱线的强弱, 进而为恒星光谱的研究与应用提供更可靠与有效的支持。
| [1] |
|
| [2] |
|
| [3] |
|
| [4] |
|
| [5] |
|
| [6] |
|
| [7] |
|
| [8] |
|
| [9] |
|
| [10] |
|
| [11] |
|
| [12] |
|
| [13] |
|
| [14] |
|