
基于自适应信号分解的农产品太赫兹光谱去噪方法研究
[吴静珠1  , 刘宇昊
, 刘宇昊1 , 杨一1, * , 谢传銮2 , 吕钟鸣1 , 李沂灿1 ]
, 刘宇昊, 谢传銮|
|


针对农产品太赫兹光谱信号中复杂基质导致的峰重叠问题及环境与系统噪声引起的动态非线性干扰, 该研究探究了基于自适应信号分解的去噪方法提升太赫兹光谱质量的可行性。 采用太赫兹时域光谱(THz-TDS)结合衰减全反射(ATR)附件采集了48个花生样品的吸收光谱, 以花生水分含量的THz-ATR定量预测模型为研究对象, 分别应用小波变换(WT)、 经验模态分解(EMD)、 局部均值分解(LMD)及其改进方法——分段局部均值分解(SLMD)和分段镜像延拓局部均值分解(PME-LMD)进行光谱去噪, 并通过支持向量回归(SVR)模型评估各方法的适用性。 实验结果表明: 经PME-LMD去噪后构建的花生水分预测模型性能最优, 其均方根误差(RMSE)、 决定系数( R2)和平均绝对百分比误差(MAPE)分别达到0.010、 0.912和0.040。 相较于传统方法, PME-LMD显著提升了光谱质量与模型预测精度。 研究提出的PME-LMD去噪策略有效抑制了太赫兹光谱信号中的非均匀噪声干扰, 为农产品太赫兹光谱分析提供了高效精准的信号预处理方法, 对太赫兹技术在农产品品质检测中的应用具有重要理论价值与工程指导意义。
Biography: WU Jing-zhu, female, (1979—), Professor, Beijing Key Laboratory of Big Data Technology for Food Safety, Beijing Technology and Business University e-mail: pubwu@163.com
To address the issues of peak overlap caused by complex matrices in agricultural product terahertz (THz) spectral signals and the dynamic, nonlinear interference induced by environmental and system noise, this study explores the feasibility of adaptive-signal-decomposition-based denoising methods to improve THz spectral quality. THz time-domain spectroscopy (THz-TDS) combined with an attenuated total reflection (ATR) accessory was used to collect THz absorbance spectra from 48 peanut samples. Taking the quantitative prediction model of peanut moisture content based on THz-ATR as an example, wavelet transform (WT), empirical mode decomposition (EMD), local mean decomposition (LMD), and its improved methods—segmented local mean decomposition (SLMD) and piecewise mirror extension local mean decomposition (PME-LMD)—were employed for spectral denoising. The applicability of different denoising methods was evaluated using a support vector regression (SVR) model. Experimental results show that the peanut moisture content prediction model constructed after PME-LMD denoising achieved the best performance, with a root mean square error (RMSE), coefficient of determination ( R2), and mean absolute percentage error (MAPE) of 0.010, 0.912, and 0.040, respectively. Compared with traditional methods, PME-LMD significantly improved spectral quality and model prediction performance. The PME-LMD denoising strategy proposed in this study effectively suppresses non-uniform noise interference in THz spectral signals, providing an efficient and accurate preprocessing method for THz spectral analysis of agricultural products. This research provides theoretical support and technical guidance for the application of THz technology for detecting agricultural product quality.
Terahertz (THz) waves are electromagnetic waves with a frequency range of 0.1~10 THz and a wavelength of 0.03~3 mm[1]. Since this frequency band lies between microwaves and infrared, it occupies a critical transition region from electronics to photonics and from macroscopic classical theory to microscopic quantum theory. As a result, THz waves exhibit a series of unique physical properties, such as high transmittance, low energy, fingerprint spectral features, and strong absorption by polar liquids[2, 3]. Given that major components of agricultural products, such as water, starch, and proteins, exhibit strong absorption in the THz spectral region[4, 5, 6], coupled with the distinct advantages of THz technology over other spectroscopic techniques, THz technology has increasingly become a research hotspot in agricultural product quality inspection. It has shown promising results and holds great potential as an important complement to infrared spectroscopy and X-ray technology[7, 8].
However, THz radiation primarily reflects weak intermolecular interactions (such as hydrogen bonds and van der Waals forces)[9], low-energy processes such as the backbone vibrations of biomacromolecules, and dipole rotations[10]. As a result, THz signals are inherently weak and highly susceptible to noise interference[11]. Additionally, agricultural products have complex matrices, and different compooents exhibit significant differences in THz-wave absorption and scattering characteristics, making it particularly challenging to extract spectral signals of target components[12]. Furthermore, environmental noise (such as moisture, vibrations, and electromagnetic interference) and system noise further reduce the signal-to-noise ratio (SNR) of THz spectra. Therefore, selecting an appropriate denoising method to enhance the quality of THz spectra has become a critical issue for the application of THz technology in agricultural product quality inspection[13]. Li et al.[14] applied dual Gaussian filtering for denoising THz spectral images of corn seeds. Their results indicated that while this method effectively preserved key structural information of the seeds, it was highly sensitive to environmental factors and exhibited limitations in handling complex noise interference. Ge et al.[15] investigated the detection of heavy metal contaminants in wheat using THz spectroscopy and employed the wavelet transform for spectral denoising preprocessing. The experimental results demonstrated that wavelet-based denoising performed at filtering high-frequency noise but was less effective at removing low-frequency noise, limiting its ability to handle complex, mixed noise. Jiang et al.[16] proposed a deep learning-based G-RRDB model to address noise in THz images of moldy wheat. Compared with traditional denoising methods, the G-RRDB model showed significant improvements in peak signal-to-noise ratio (PSNR) and structural similarity (SSIM), achieving a final classification accuracy of 92.8%. However, its high computational complexity, long training time, and substantial computing resource requirements limited its widespread application in practical scenarios. These studies explored the advantages and disadvantages of denoising methods based on traditional filtering, frequency-domain transformation filtering, and deep learning in the context of THz spectral analysis, providing valuable insights and references for future research.
To address issues such as peak overlap caused by complex matrices in agricultural product THz spectral signals and dynamic nonlinear interference induced by environmental and system noise, this study explores the feasibility of adaptive signal decomposition methods to improve THz spectral quality. This approach decomposes complex signals into multiple intrinsic mode functions or sub-signals, extracting useful information while removing noise. It offers significant advantages in noise suppression and feature extraction for complex, nonlinear, and non-stationary signals[17, 18, 19]. Taking the construction of a quantitative prediction model for peanut moisture content based on THz Attenuated Total Reflection (ATR) spectroscopy as an example, this study investigates the performance of three typical adaptive signal decomposition methods— Wavelet Transform (WT), Empirical Mode Decomposition (EMD), and Local Mean Decomposition (LMD)— in enhancing THz spectral quality. Considering the highly non-uniform noise distribution in THz spectra, this study proposes two novel denoising strategies: Segmented Local Mean Decomposition (SLMD) and Piecewise Mirror Extension Local Mean Decomposition (PME-LMD). The applicability of different denoising methods is evaluated using a Support Vector Regression (SVR) model. Fromthe perspective of non-uniform spectral noise distribution, this study provides an effective and refined denoising strategy for processing THz spectral data of agricultural products, offering theoretical foundations and technical support for the practical application of THz technology in agricultural product quality monitoring.
Moisture content is a crucial indicator for assessing the quality of agricultural products. However, the strong absorption of THz waves by environmental moisture, along with the overlapping absorption characteristics of other components in agricultural products within the THz spectral range, poses significant challenges for accurately predicting moisture content using THz spectroscopy. To thoroughly investigate the effectiveness of adaptive signal decomposition-based denoising methods, this study specifically selects the construction of a THz-ATR prediction model for peanut moisture content as a case study. The experiment uses Yuanhua 308 peanuts as samples. To prepare samples with different moisture content levels, the peanut samples were placed in an environment at 40 ℃ and 100% relative humidity. Each day, a batch of samples was removed. After exposure to air for varying durations, samples were collected. A total of 12 batches and 48 samples were prepared.
The seed samples were crushed using the FW-200 high-speed universal grinder, and their moisture content was rapidly measured using the Mettler-Toledo HB43-S halogen moisture analyzer. The statistical information on moisture content for the 48 samples is shown in the Table 1 below.
| Table 1 Statistical information of sample moisture content |
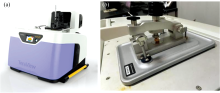
The experiment utilized a TeraPulse 4000 terahertz time-domain spectroscopy (THz-TDS) system with an ATR accessory to collect the spectra of peanut samples, as shown in Fig.1. The spectrometer parameters were set as follows: the spectral range was 0.2~359.94 cm-1, the resolution was 0.94 cm-1, and each sample was scanned 500 times. The experimental environment temperature was maintained at 22 ℃. During the experiment, a SICOLAB mini air compressor was used to purge the sampling chamber with dry air, reducing the influence of environmental water vapor on THz spectral measurements.
 | Fig.1 THz spectrometer and acquisition accessories (a): TeraPulse 4000 spectrometer; (b): ATR attachments |
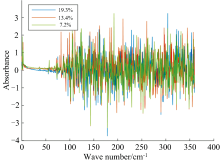
As representative examples, Fig.2 presents the absorbance spectra of peanut samples with moisture contents of 19.3%, 13.4%, and 7.2%, corresponding to high, medium, and low moisture levels relative to the overall sample average (12.93%). These samples were selected to illustrate typical spectral features under different moisture conditions. Spectral curve analysis indicates that in the range of 0.2~76 cm-1, the spectral profiles are distinct yet highly similar and consistent, with no significant noise interference. However, in the range of 76~359.94 cm-1, the signal exhibits drastic and irregular fluctuations, with no observable characteristic signals from the samples. This indicates that the THz spectra of peanut samples exhibit a significant non-uniform noise distribution.
 | Fig.2 Absorbance spectra of peanut samples with different moisture contents |
The adaptive signal decomposition method decomposes complex signals into multiple intrinsic mode functions or sub-signals, allowing the extraction of useful information while removing noise. This method does not require prior assumptions and can adaptively select an appropriate basis for decomposition, making it suitable for processing complex, non-stationary, and nonlinear signals.Since agricultural product THz spectral signals are affected by issues such as peak overlap due to complex matrices and dynamic, nonlinear interference from environmental and system noise, this study explores the applicability of typical adaptive signal decomposition methods— WT, EMD, and LMD— for THz spectral denoising. Additionally, given the significant non-uniformity in the noise distribution in peanut THz spectral signals, this study proposes improved methods: SLMD and PME-LMD.
1.4.1 Wavelet transform method
WT is a signal analysis method that combines time and frequency localization characteristics[20]. Through scale transformation and translation operations, it enables multi-scale fine analysis of spectral data, achieving hightime-resolution analysis in high-frequency bands and high-frequency-resolution analysis in low-frequency bands, making it highly suitable for non-stationary signal processing. The continuous wavelet transform (CWT) of a one-dimensional signal f(t)f(t) can be expressed as the convolution of the signal with a series of wavelet mother functions, as shown in Equation (1)
Where CWT(a, b) represents the wavelet coefficients, a is the wavelet scale parameter, b is the wavelet translation parameter, Ψ (t) is the wavelet mother function, and Ψ * (t) denotes the complex conjugate of Ψ (t).
The essence of the wavelet transform is to project the THz absorbance spectrum of f(x) onto the wavelet function Ψ * (t), then apply threshold processing to the wavelet coefficients corresponding to different high and low frequencies, and finally reconstruct the signal[21]. In the wavelet transform, selecting an appropriate wavelet basis and the number of decomposition levels significantly impac denoising performance.
1.4.2 Empirical mode decomposition method
EMD is a method for analyzing nonlinear and non-stationary time series. Compared with traditional methods, EMD generates basis functions directly from the signal data, making it intuitive and adaptive. Its core principle is to decompose the signal into several Intrinsic Mode Functions (IMFs) and reveal their time-frequency characteristics through the Hilbert transform, making it well-suited for processing nonlinear and non-stationary signals.
In the EMD algorithm, the definition of an IMF includes the following criteria: the number of extrema and zero-crossings in the data must be equal or differ by at most one, and the mean of the envelope defined by the local extrema must be zero at any given point. An IMF intuitively represents the amplitude and frequency variations of the data over time.
The steps of the EMD algorithm are as follows:
① Identify the local maxima and minima of the signal and connect these points using cubic spline interpolation to form the upper envelope u(t) and lower envelope v(t).
② Calculate the mean of the upper and lower envelopes m(t), using the following formula
③ The formula for calculating the component functions in the EMD algorithm is as follows
④ Check if h(t) satisfies the IMF conditions. If it does, label it as the first IMF component c1(t); if it does not, treat h(t) as the new signal and repeat the previous steps until the IMF is obtained. Once an IMF component is extracted from the original signal, remove it from the signal, then repeat the above process on the remaining signal to obtain the next IMF component. This process is repeated until EMD algorithm's termination conditions are met, indicating that the signal has been fully decomposed. The termination condition of the EMD algorithm is based on the Cauchy convergence criterion, which is specifically defined by the following formula
$S D_{k}=\frac{\displaystyle\sum_{t=0}^{T}\left|h_{k-1}(t)-h_{k}(t)\right|^{2}}{\displaystyle\sum_{t=0}^{T} h_{k-1}(t)^{2}}$(4)
Where: T represents the signal length. The decomposition ends when SDk is smaller than the set threshold.
1.4.3 Local mean decomposition method
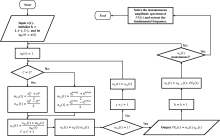
LMD is a method for time-frequency analysis of multi-component signals, proposed by Jonathan S. Smith et al.[22] in 2005. LMD adaptively decomposes a complex signal into a collection of single-component amplitude and frequency-modulated signals, accurately reflecting the time-frequency characteristics of the original signal. LMD can automatically adjust the decomposition process based on the signal's features, effectively extracting instantaneous frequency and amplitude information. Compared to EMD, LMD performs better in solving issues such as modal aliasing, endpoint effects, and curve fitting. By extracting finer local features, LMD reduces false components and over- or under-enveloping problems. Due to its high adaptability and precise time-frequency analysis capability, LMD is widely regarded in the field of non-stationary signal processing [23].
The specific decomposition steps of LMD are shown in Fig.3.
 | Fig.3 Flowchart of the LMD decomposition steps |
1.4.4 Segmented local mean decomposition method
Based on the spectral analysis in section 1.3, it is evident that agricultural product THz spectra exhibit significant non-uniform noise distribution characteristics. Therefore, this study proposes the SLMD method, which first divides the THz spectrum into several segments and then applies Local Mean Decomposition and signal reconstruction to each segment[24].
The SLMD method improves the flexibility and accuracy of complex signal processing by handling different noise characteristics in various segments. It is suitable for processing non-stationary and nonlinear signals. This segmented processing approach effectively integrates the local characteristics of the signal with its overall structure, enabling a more refined adaptation to the non-uniform noise distribution within the signal. It holds promise for further improving the effectiveness and accuracy of signal processing.
1.4.5 Piecewise mirror extension local mean decomposition method
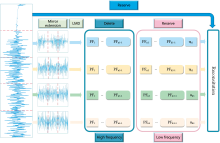
When using the SLMD method, the spectrum needs to be segmented, and each segment requires independent LMD denoising. Too many segmentation points can lead to divergence at both ends of the spectrum and cause the signal to spread toward the center, exacerbating endpoint effects[25]. To address this issue, this paper introduces the Mirror Extension technique[26, 27], based on SLMD, and proposes the PME-LMD method. Mirror extension effectively prevents endpoint effects at the beginning and end of signal processing, maintaining the signal's continuity and integrity during denoising, thereby improving the endpoint effects of SLMD[28]. The denoising process of the PME-LMD method is shown in Fig.4.
 | Fig.4 PME-LMD denoising process |
The PME-LMD method follows the steps below:
(1) Divide the spectral signal into several intervals based on the distribution levels of noise in the spectrum. This step aims to process regions with different noise levels more precisely.
(2) Perform mirror extension on each divided interval, i.e., extend the mirror image to the left and right, forming the piecewise mirror extension (PME) spectrum.
(3) Use LMD to decompose each PME spectrum, obtaining a series of intrinsic mode functions (PFs) and a final residual component uk. The goal is to extract components with different frequencies from the signal and identify noise components.
(4) Analyze the decomposition results of each PME spectrum, remove the high-frequency noise components from the spectra PFs, and retain the low-frequency components that reflect the essential characteristics of the signal. Then, reconstruct the signal after the removal to obtain the denoised THz spectrum.
SVR constructs the optimal regression hyperplane by minimizing structural risk, emphasizing the model's generalization ability. SVR is suitable for small sample sizes, high-dimensional, and nonlinear problems, providing strong nonlinear approximation and generalization through high-dimensional mapping, a unique loss function, and regularization. In this study, SVR is used to construct a quantitative THz analysis model for peanut moisture content.
In this study, the performance of the regression model is evaluated using three metrics: Root Mean Square Error (RMSE), Coefficient of Determination (R2), and Mean Absolute Percentage Error (MAPE).
(1) Root Mean Square Error (RMSE): It is the square root of the average of the squared differences between the observed values and the model's predicted values. It is a commonly used metric to assess the magnitude of the model's prediction error. The calculation formula is as follows:
$\mathrm{RMSE}=\sqrt{\frac{1}{n} \displaystyle\sum_{i=1}^{n}\left(y_{i}-\hat{y}_{i}\right)^{2}}$(5)
Where yi is the actual value, $\hat{y}_{i}$ is the predicted value, and RMSE is the number of samples. The smaller the value, the smaller the difference between the model's predicted values and the actual values, indicating better model performance.
(2) Coefficient of Determination (R2): This is an indicator of the model's ability to explain the variability of the variables, i.e., the proportion of the data variability that can be explained. The calculation formula is as follows:
$R^{2}=1-\frac{\displaystyle\sum_{i=1}^{n}\left(y_{i}-\hat{y}_{i}\right)^{2}}{\displaystyle\sum_{i=1}^{n}\left(y_{i}-\bar{y}_{i}\right)^{2}}$(6)
Where $\bar{y}_{i}$ is the mean of the actual values, the value of R2 typically ranges from 0 to 1. The closer the value is to 1, the better the model explains the data's variability. The higher the R2 value, the better the model's fit.
(3) Mean Absolute Percentage Error (MAPE): This is the average of the absolute differences between the observed values and the predicted values, expressed as a percentage of the actual values. It is an indicator of prediction accuracy and is suitable for assessing the prediction performance of data on different scales. The calculation formula is as follows:
$\text { MAPE }=\frac{100 \%}{n} \displaystyle\sum_{i=1}^{n}\left|\frac{y_{i}-\hat{y}_{i}}{y_{i}}\right|$(7)
The smaller the MAPE value, the higher the model's prediction accuracy. It is suitable for comparing model performance across datasets of different magnitudes.
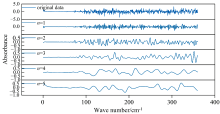
In wavelet transform denoising, the selection of the wavelet basis function and the decomposition level significantly affect the denoising effect. The Sym8 wavelet function, with its compact support, good continuity, and symmetry, is suitable for denoising signals with good continuity. Therefore, the Sym8 wavelet was chosen as the wavelet basis function. To compare denoising effects across different decomposition levels, the absorbance spectrum of a sample with 13.4% RH was used as an example. The original sample was decomposed into 5 levels, as shown in Fig.5, where n represents the decomposition level. From the Figure, it can be observed that as the decomposition level increases, spectral details are lost, and the signal distortion gradually intensifies.
 | Fig.5 Reconstructed spectra at different decomposition scales using the Sym8 wavelet basis function |
The peanut samples were randomly divided into training and test sets at a 3∶ 1 ratio, with 36 for training and 12 for testing. The SVR model was used to develop a quantitative analysis model for peanut moisture content at different decomposition levels, and the test set results are shown in the Table 2.
| Table 2 Quantitative model indicators for peanut moisture content based on WT denoising processing |
As shown in the Table 2, as the wavelet decomposition level increases, the evaluation metrics deteriorate, and the denoising effect declines. This indicates that a decomposition level of 1 is optimal for the THz absorbance spectrum using the Sym8 wavelet function. As illustrated in the Figure 5, the wavelet denoising result at a decomposition scale of 1 effectively removes most high-frequency noise while preserving the primary trend of the original absorbance spectrum without denoising.
The denoising performance of WT is highly influenced by the choice of wavelet basis function and decomposition level, and its ability to handle nonlinear signals is limited. In contrast, EMD is a fully adaptive signal decomposition method that does not require a predefined basis function, making it suitable for processing nonlinear and non-stationary signals. Using the absorbance spectrum of a sample with a moisture content of 13.4% RH as an example, the EMD denoising result is shown in Fig.6. The processed absorbance spectrum appears smoother with reduced fluctuations, but some noise and mode mixing remain.
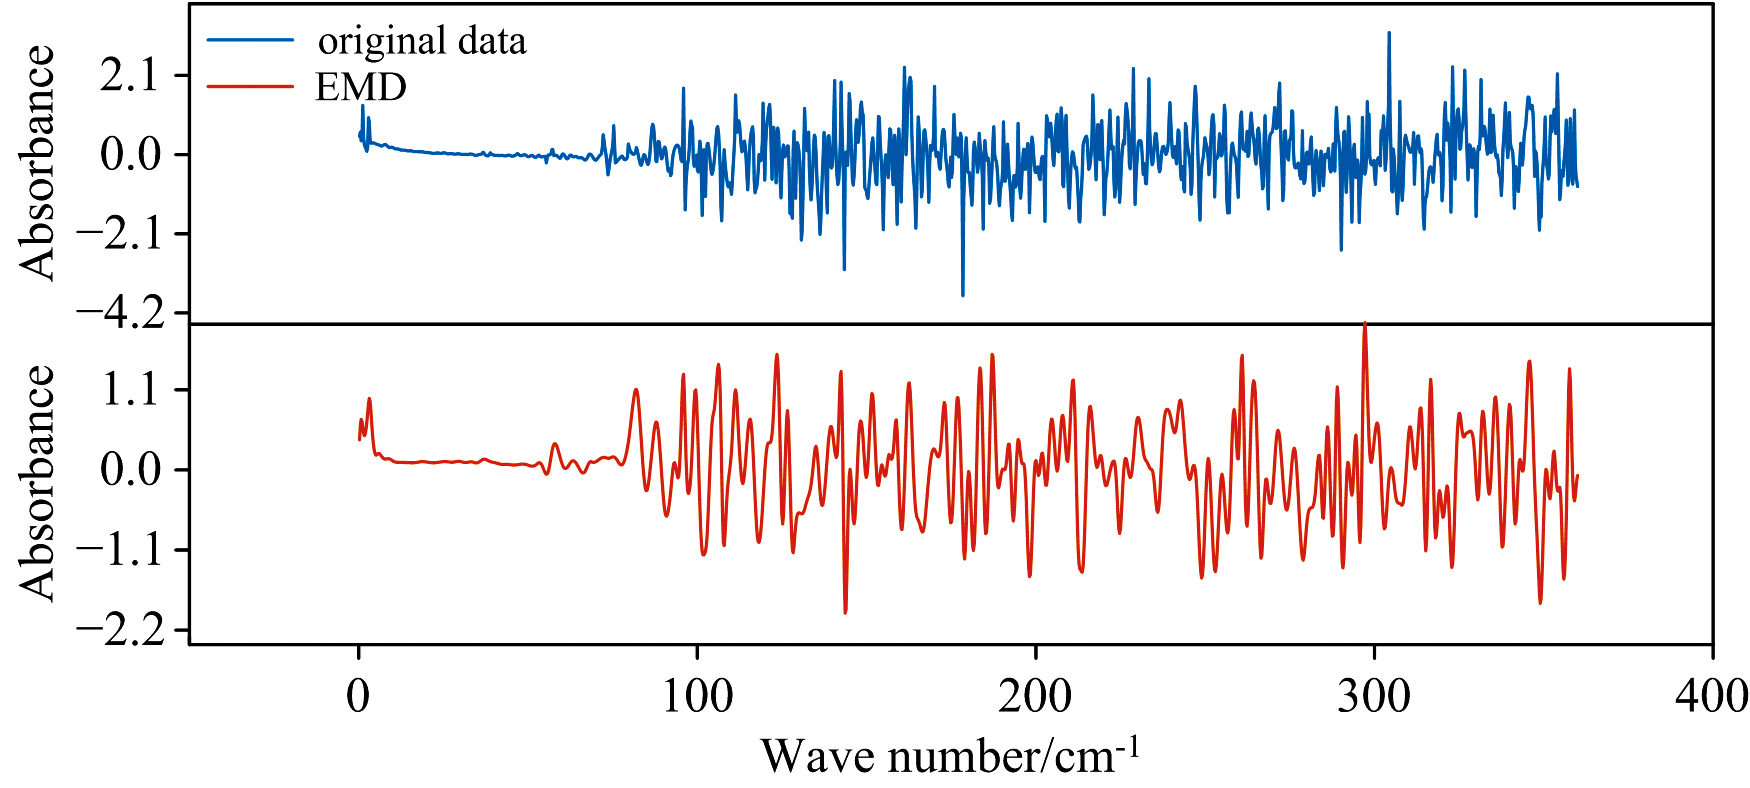 | Fig.6 Sample spectrum before and after EMD denoising processing |
Using the same training and testing sets as in Section 2.1, an SVR model for peanut moisture content was constructed, with the results shown in the Table 3. The evaluation metrics of the model based on the EMD-processed absorbance spectrum were superior to those of the unprocessed original spectrum, indicating that this denoising method can enhance the signal-to-noise ratio (SNR) of the spectrum to some extent. However, its performance was inferior to that of WT, suggesting that EMD may suffer from severe mode mixing and endpoint effects, resulting in suboptimal processing [29].
| Table 3 Quantitative model metrics for peanut moisture content based on EMD denoising processing |
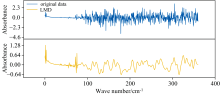
Due to the significant uneven distribution of noise in the peanut THz spectra, the noise is less noticeable in the < 76 cm-1 region, while it significantly increases in the > 76 cm-1 region. Therefore, the experiment first retains the spectral range with wavenumbers < 76 cm-1, and applies LMD denoising to the region with significant noise (> 76 cm-1). The high-frequency component is removed, while the remaining components are retained and the spectrum is reconstructed. Fig.7 shows the spectra before and after LMD processing. The LMD-processed spectrum is smoother and exhibits less signal fluctuation compared to the original spectrum. Therefore, LMD can effectively remove substantial noise, but it may also lead to over-smoothing, resulting in the loss of important features and details in the signal.
 | Fig.7 Sample spectra before and after LMD denoising treatment |
Using the training and testing sets from Section 2.1, the results of the peanut moisture content SVR model are shown in the Table 4. The model performance after LMD treatment is better than that of the model without denoising preprocessing and the model after EMD treatment, indicating that LMD is effective in reducing spectral noise and improving spectral quality. However, considering that there may still be uneven noise distribution in the wavenumber range > 76 cm-1, applying uniform LMD treatment to this range could lead to signal distortion in the noise-free or low-frequency noise regions. Therefore, the modeling effect still needs further improvement.
| Table 4 Peanut moisture content quantitative model indicators based on LMD denoising processing |
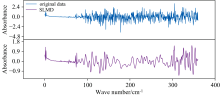
To address uneven spectral noise, this paper proposes the SLMD method. By dividing the spectrum into segments, applying LMD decomposition, and then reconstructing, SLMD achieves more precise denoising for uneven noise. In this study, the portion of the THz absorbance spectrum with higher noise, specifically the range from 76 to 359.94 cm-1, is uniformly divided into 2, 3, 4, and 5 segments. Each segment undergoes LMD decomposition, removing high-frequency components PF1, reconstructing the remaining components PFs, and then stitching together the reconstructed spectra from different intervals to form the full spectrum. The SLMD-denoised absorbance spectrum for a sample with a moisture content of 13.4% RH, using a decomposition scale of 4, is shown in Fig.8. The denoised curve's smoothness falls between EMD and LMD, effectively reducing noise while better preserving the original signal's characteristics. This method optimizes complex noise distributions by decomposing and reconstructing across different noise intervals, achieving better denoising performance than single LMD.
 | Fig.8 Sample spectra before and after SLMD denoising processing |
Using the training and test sets from Section 2.1, the SVR results for the peanut moisture content model are shown in the Table 5. When applying the SLMD method with 3 and 4 spectral segmentations, the model performance is significantly better than that of a single LMD, especially when the segmentation number is 4, where the model performs optimally with an RMSE, R2, and MAPE of 0.011, 0.872, and 0.042, respectively. However, when the number of segments is increased to 5, the model's performance decreases slightly compared to the 4-segment model. This phenomenon may be due to the SLMD method, with excessive segmentation, exacerbating its own endpoint effect. The endpoint effect may cause data divergence at the extremes. When there are too many segments, the spectral length of each window becomes shorter, meaning more data points are affected by the endpoint effect, which in turn affects the model's performance.
| Table 5 Quantitative model indicators for peanut moisture content based on SLMD denoising treatment |
To address the impact of endpoint effects on signal processing quality, this paper proposes the PME-LMD denoising method based on SLMD. This method effectively reduces data divergence at the endpoints by applying mirror extension at both ends of each segmented interval. Using the training and test sets from Section 2.1, the peanut moisture content SVR model was constructed, and the results are shown in the Table 6. After processing with the PME-LMD method, the constructed model demonstrates the best performance in terms of RMSE, R2, and MAPE compared to other denoising methods such as CWT, LMD, and SLMD, with values of 0.010, 0.912, and 0.040, respectively. This result also confirms that PME-LMD effectively -mitigates the enhanced endpoint effects caused by excessive segmentation, thereby ensuring higher-quality signal reconstruction and analysis. It further illustrates the effectiveness of the PME-LMD method in reducing uneven noise and improving spectral quality, making it a practical and feasible approach for handling uneven noise in THz spectra of agricultural products.
| Table 6 Quantitative model indicators of peanut moisture content based on adaptive signal decomposition denoising |
This study uses the absorbance spectra of 48 peanut samples with different moisture contents measured by the THz-TDS system and its ATR accessory to explore the denoising applicability of methods such as WT, EMD, LMD, SLMD, and PME-LMD. The experimental results show that traditional WT, EMD, and LMD methods have limitations in THz spectral denoising. In contrast, SLMD improves the signal-to-noise ratio via segmentation, and PME-LMD further optimizes endpoint effects, significantly enhancing denoising performance. Based on the spectra processed by different denoising methods, SVR quantitative prediction models for peanut moisture content were established. Among them, the PME-LMD method performed the best, with an RMSE of 0.010, an R2 of 0.912, and a MAPE of 0.040, significantly improving the prediction accuracy compared to traditional methods. The PME-LMD-based denoising strategy proposed in this study -effectively reduces interference from environmental factors, non-target components, and system noise, significantly improving the quality of THz spectral signals and quantitative analysis performance. It provides a theoretical basis and methodological support for the application of THz technology in agricultural product moisture detection and quality monitoring.
Declaration of Competing Interest: The authors declare that they have no known competing financial interests or personal relationships that could have appeared to influence the work reported in this paper.
| [1] |
|
| [2] |
|
| [3] |
|
| [4] |
|
| [5] |
|
| [6] |
|
| [7] |
|
| [8] |
|
| [9] |
|
| [10] |
|
| [11] |
|
| [12] |
|
| [13] |
|
| [14] |
|
| [15] |
|
| [16] |
|
| [17] |
|
| [18] |
|
| [19] |
|
| [20] |
|
| [21] |
|
| [22] |
|
| [23] |
|
| [24] |
|
| [25] |
|
| [26] |
|
| [27] |
|
| [28] |
|
| [29] |
|