
黄渤海沉积物有机碳光谱分析在不同仪器间的差异
[范萍萍 , 李雪莹, 邱慧敏, 侯广利, 刘岩
* ]
, 李雪莹, 邱慧敏, 侯广利, 刘岩]
|
|


作者简介: 范萍萍, 女, 1980年生, 齐鲁工业大学(山东省科学院)研究员 e-mail: fanpp_qd@qlu.edu.cn
光谱仪作为可见-近红外光谱分析核心工具, 对于光谱分析的影响还有待深入研究。 这里, 以黄渤海沉积物为研究对象, 利用安捷伦Cary 5000、 ASD FieldSpec 4、 海洋光学QEPro三种光谱仪, 研究有机碳含量的反射光谱及其光谱分析在不同光谱仪间的差异。 其中, Cary 5000为室内台式光谱仪, FieldSpec 4和QEPro是便携式光谱仪; QEPro只能采集200~1 000 nm的反射率, 而且反射率在三种光谱仪中最高; Cary 5000和FieldSpec 4能够采集完整的可见-近红外反射率(350~2 500 nm), 光谱曲线几乎完全一致, 尤其是近红外部分, 但Cary 5000采集的反射率高于FieldSpec 4。 三种光谱仪的光谱分析能力也存在显著差异, 其中, Cary 5000的光谱分析能力最强, 其光谱模型具有很强的预测能力, 建模集 r2高达0.99, 验证集 r2高达0.86, 均方根误差(RMSE)在建模集和验证集分别为0.04、 0.11, 相对分析偏差(RPD)高达2.6, 显示了对黄渤海沉积物有机碳强大的预测能力。 FieldSpec 4的建模集 r2很高, 达到0.98, 但验证集 r2仅为0.56, RMSE从建模集的0.06降为预测集的0.19, RPD仅为1.4, 显示在黄渤海沉积物有机碳的预测中准确度很低。 QEPro的建模集和验证集 r2都很低, 分别为0.75、 0.59, RMSE保持稳定, 均为0.18, RPD刚超出1.5(RPD=1.6), 显示在黄渤海沉积物有机碳的预测上具有一定的准确度。 可见, 室内光谱仪比便携式光谱仪具有更强的光谱分析能力, 可能是因为室内光谱仪的配置更好。 同为便携式光谱仪, 在黄渤海沉积物有机碳的光谱分析方面, QEPro具有和FieldSpec 4一样的光谱分析能力, 甚至在稳定性上更好。 由于QEPro的价格相对低廉, 因此在室外沉积物/土壤碳氮光谱分析中, 具有更好的性价比。 该研究深入比较了不同光谱仪在相同样品的光谱分析中的差异, 为不同研究的光谱分析及其模型转移提供了有效参考。
Spectrometers are the core tool in spectral analysis, but it is still unclear how spectrometers influence the results of spectral analysis. Here, we studied the spectral analysis of organic carbon in sediments of the Yellow Sea and Bohai Sea using Agilent Cary 5000, ASD FieldSpec 4, and Ocean Optics QEPro and compared differences in the reflectance spectra of organic carbon and their spectral analysis. Cary 5000 is an indoor spectrometer, and FieldSpec 4 and QEPro are portable spectrometers. QEPro could only collect the reflectance between 200 and 1 000 nm, and the reflectance is the highest among the three spectrometers. Cary 5000 and FieldSpec 4 could collect the reflectance of the complete visible and near-infrared waveband (350~2 500 nm), and both spectral curves were almost identical, especially in the near-infrared bands. However, the reflectance collected by Cary 5000 is higher than that by FieldSpec 4. The abilities of spectral analysis of organic carbon concentrations in the Yellow and Bohai Sea were also different across the three spectrometers. Cary 5000 had the strongest ability to perform spectral analysis. The spectral models in Cary 5000 had a strong prediction ability of organic carbon concentrations in sediments. In Cary 5000, the r2 of the calibration set was as high as 0.99, and the r2 of the validation set was as high as 0.86; the root mean square error (RMSE) of the calibration set and validation set was 0.04 and 0.11, respectively; the relative prediction deviation (RPD) was as high as 2.6, showing a strong ability to predict sediment organic carbon. In FieldSpec 4, r2 of the calibration set was as high as 0.98, but r2 of the validation set was only 0.56; RMSE decreased from 0.06 to 0.19, and RPD was as low as 1.4, showing a low prediction ability of sediment organic carbon. In QEPro, r2 of the calibration set and validation set were both low (0.75 and 0.59, respectively), RMSE were stable and as high as 0.18, and RPD was larger than 1.5 (1.6), showing a convincing prediction ability of sediment organic carbon. Results showed that the portable spectrometers were worse than indoor instruments in spectral analysis due to their lower technological performance. For the portable spectrometers, results in spectral analysis were not different between FieldSpec 4 and QEPro, and even the results of QEPro were more stable. Therefore, we think QEPro can be replace with FieldSpec 4 in rapidly determining sediment organic carbon by spectroscopy because QEPro is cost-effective. In this study, the differences among three types of spectrometers in the spectral analysis of the same sample were compared, which provided an effective reference for the spectral analysis and model transfer of different studies.
可见-近红外光谱分析快速测定了土壤或沉积物中有机碳含量, 已成功分析多种土壤或沉积物样品[1, 2, 3, 4]。 Rossel等[1]利用ASD的室内光谱仪Labspec分析了澳大利亚10 677个农业土壤的多个属性, 包括土壤有机碳(SOC), 其光谱模型预测能力强大, r2> 0.90, 相对分析误差RPD(标准偏差和标准误差的比值, > 2.0表示预测能力强)高达2.2。 Liu等[2]利用ASD的野外光谱仪FieldSpec分析了中国森林土壤的SOC含量, 同样取得了极好的预测效果, r2高达0.94, 相对误差(预测值与实测值之差与实测值的百分比)< 10%。 李雪莹等[3, 4]利用海洋光学便携式光谱仪QEPro分析了海洋沉积物的碳含量, 都取得了较好的预测效果, r2> 0.80, RPD高达2.2以上。
在已有土壤或沉积物的可见-近红外反射光谱分析研究中, ASD的Labspec或FieldSpec系列是最常用的光谱仪, 显示了其良好的性能和口碑[5, 6]。 但是, ASD光谱仪的价格昂贵, 也有较少研究使用其他光谱仪, 如海洋光学的QE系列[3, 4, 7]。 利用QE系列光谱仪, 分析了大量的土壤和沉积物的碳氮磷等参数, 都显示了较好的光谱分析能力[3, 4, 7]。 那么, 针对相同样品, 不同光谱仪的分析能力有多大差异呢?
为此, 本研究将以中国黄渤海沉积物有机碳的光谱分析为例, 比较安捷伦Cary 5000、 ASD FieldSpec 4、 海洋光学QEPro三种光谱仪在测定有机碳反射光谱及其在光谱分析中的差异。 由于Cary 5000属于室内设备, 而FieldSpec 4和QEPro属于便携式, 其中Cary 5000和FieldSpec 4的波长范围350~2 500 nm, 而QEPro的波长范围200~1 000 nm, 因此我们假设Cary 5000的光谱分析结果最好, 其次是FieldSpec 4, 最差的是QEPro。
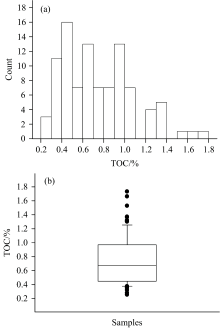
从黄渤海几十个站位采集的样品中[4], 随机抽取了96个沉积物样品, 用于本研究。 样品经冻干研磨后, 过0.5 mm筛, 分成2部分, 一部分用于测定总有机碳(TOC)含量, 一部分用于采集可见-近红外光谱。 其中, 沉积物中有机碳的含量, 利用海洋监测规范第5部分: 沉积物分析(GB17378.5— 2007)18.2热导法测定, 盐酸去除无机碳后, 利用元素分析仪(Vario EL IIIElemental Analyzer)测定总碳含量(%), 即为TOC含量(%)。 这些沉积物的TOC含量分布在0.25%~1.73%之间, 平均值为0.75%, 中值为0.67%(图1)。
 | 图1 黄渤海沉积物样品的有机碳含量 (a): 分布图; (b): 四分位图Fig.1 Concentrations of organic carbon in sediments of Yellow Sea and Bohai Sea (a): Distribution; (b): Quartile map |
分别利用Cary 5000、 FieldSpec 4、 QEPro(狭缝10 μ m)三个光谱仪采集可见-近红外光谱, 这三台仪器的技术参数如表1所示。 其中, Cary 5000利用专门的粉末样品池和漫反射组件进行测量, FieldSpec 4和QEPro利用光纤探头进行漫反射测量。 反射光谱采集都通过软件控制, 其中, Cary 5000的设置为波长间隔1 nm, 扫描速度600 nm· min-1, 每个样品重复测定5次; FieldSpec 4的设置为每s测3次、 暗电流100次、 参考光谱10次, 每个样品重复测定5次, 每15 min校准一次白板; QEPro需要把光纤插入海洋光学的探头支架(RPH-1)的45° 孔中, 保证样品和探头形成45° 角, 积分时间600 ms, 采样间隔1 nm, 每个样品重复测定5次。
| 表1 本研究所用的三个光谱仪的技术参数 Table 1 Overview of the three spectrometers used in this study |
每个样品都用5个反射光谱的平均值作为这个样品的反射光谱, 每个光谱仪都有96个样品的反射光谱, 取这96个样品的反射光谱的平均值作为每个光谱仪的反射光谱, 用于比较相同样品在不同光谱仪间的反射光谱的差异。
针对每个光谱仪的96个样品, 通过K-S分类法以2∶ 1的比例把96个样品分成建模集和验证集; 针对建模集, 利用偏最小二乘回归(PLSR)建立光谱模型; 利用验证集的样品验证已建的光谱模型, 通过r2、 RMSE和RPD评价建模效果[8]。
如图2所示, 不同仪器采集的反射光谱存在较大差异。 其中, QEPro只能采集1 000 nm以下的反射光谱, 而且反射率最高; Cary 5000和FieldSpec 4能够采集完整的可见-近红外反射光谱, 光谱曲线特征几乎完全一致, 尤其是近红外部分, 但Cary 5000的反射率高于FieldSpec 4。
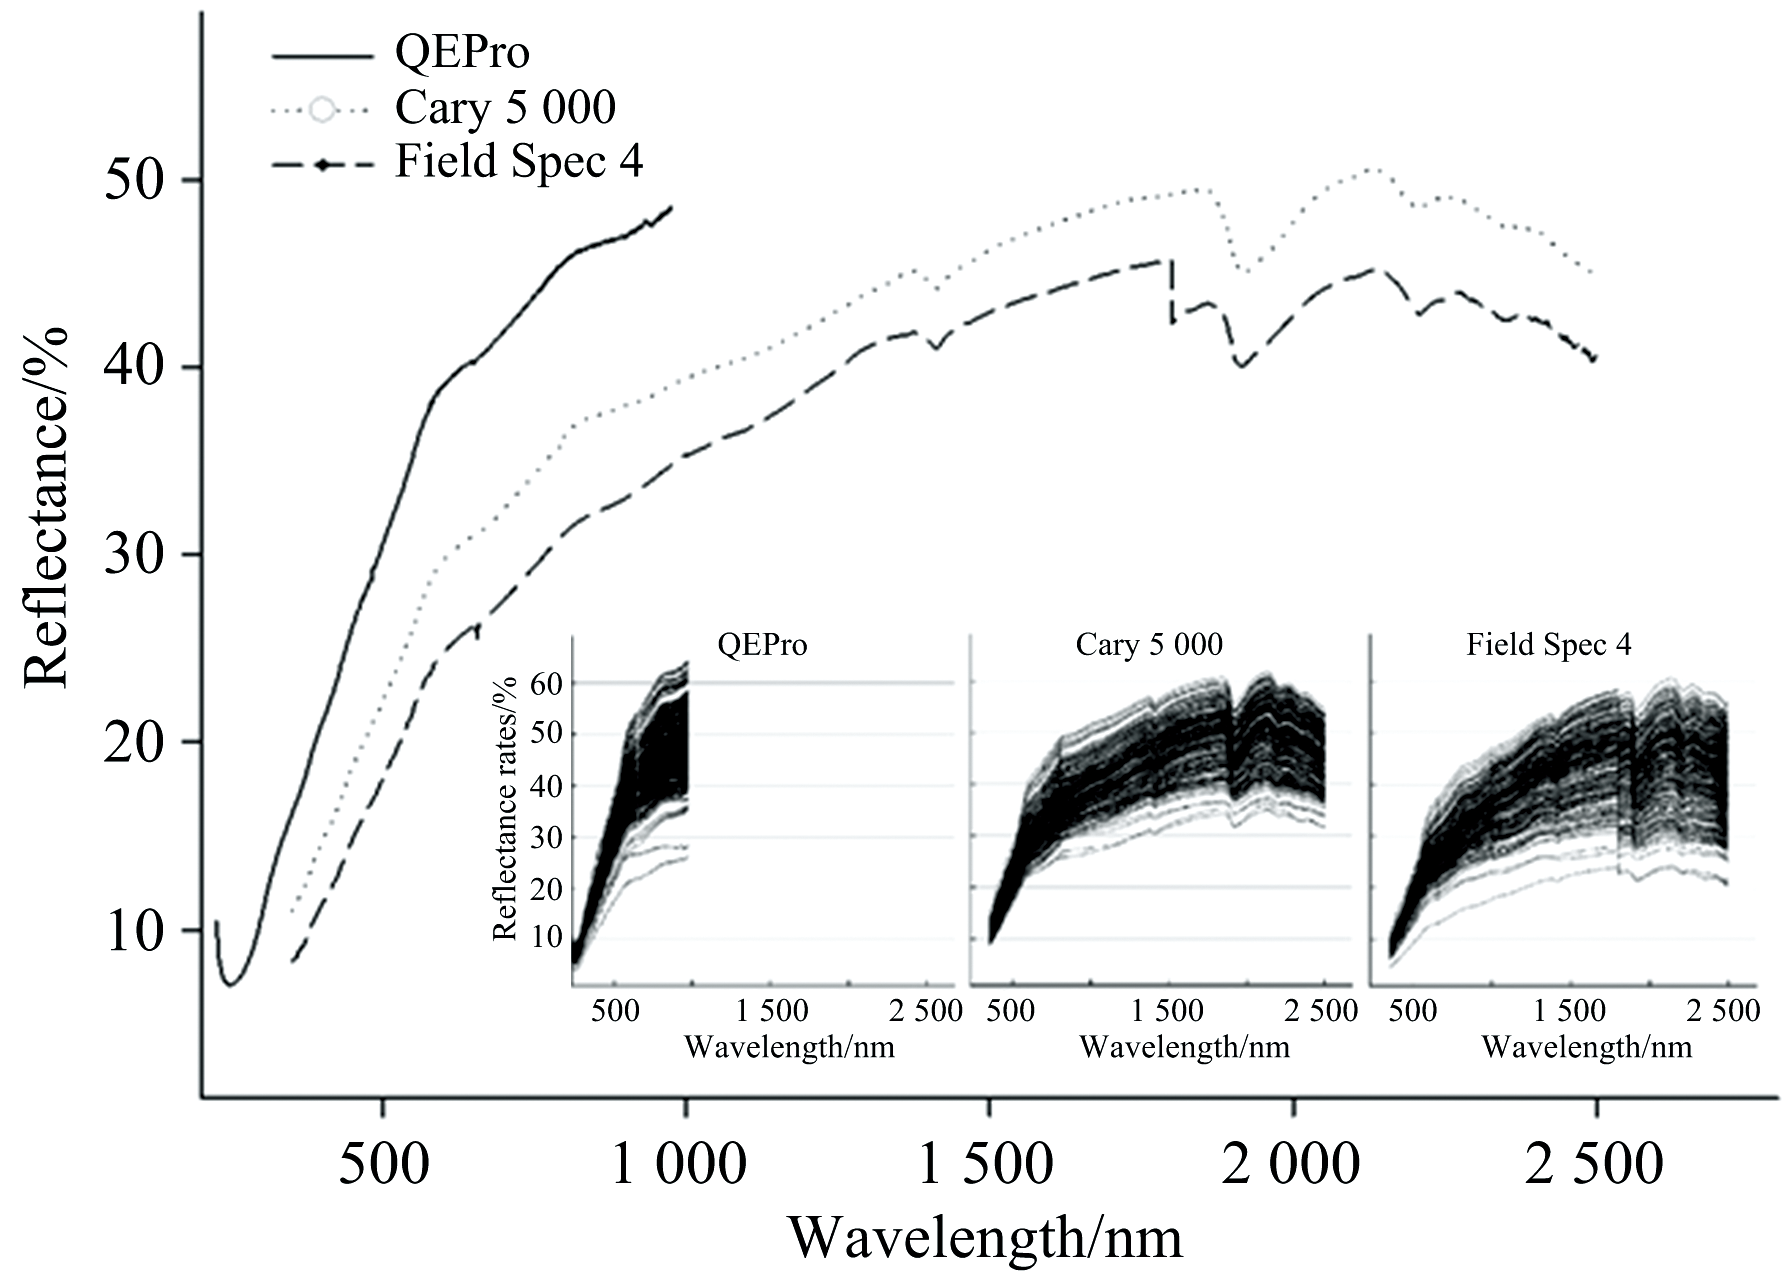 | 图2 黄渤海沉积物在三个光谱仪的可见-近红外反射光谱Fig.2 The visible and near infrared reflectance spectra of sediments in the Yellow Sea and Bohai Sea collected by the three spectrometers |
光谱分析结果也存在较大差异(表2)。 Cary 5000的光谱模型最好, 建模集r2高达0.99, RMSEC仅为0.04, 验证集r2高达0.86, RMSEP=0.11, RPD=2.6(表2)。 FieldSpec 4和QEPro的建模集r2分别为0.98、 0.75, 建模集RMSE分别为0.06、 0.18, 而验证集r2分别为0.56、 0.59, 验证集RMSE分别为0.21、 0.18, RPD分别为1.4、 1.6。
| 表2 三个光谱仪对黄渤海沉积物有机碳的光谱分析 Table 2 Spectral analysis of organic carbon in sediments of the Yellow Sea and Bohai Sea by the three spectrometers |
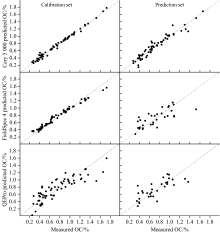
可见, Cary 5000的建模的光谱模型是最好的, 这从图3也可以得到进一步印证。 Cary 5000的光谱模型预测能力强, 数据离散程度小。 FieldSpec 4的建模集较好, 显著优于QEPro, 但到了验证集, 预测能力变低, 数据离散程度大, 显示误差比QEPro大; 而QEPro无论在建模集还是验证集, 一直保持一致的预测能力。
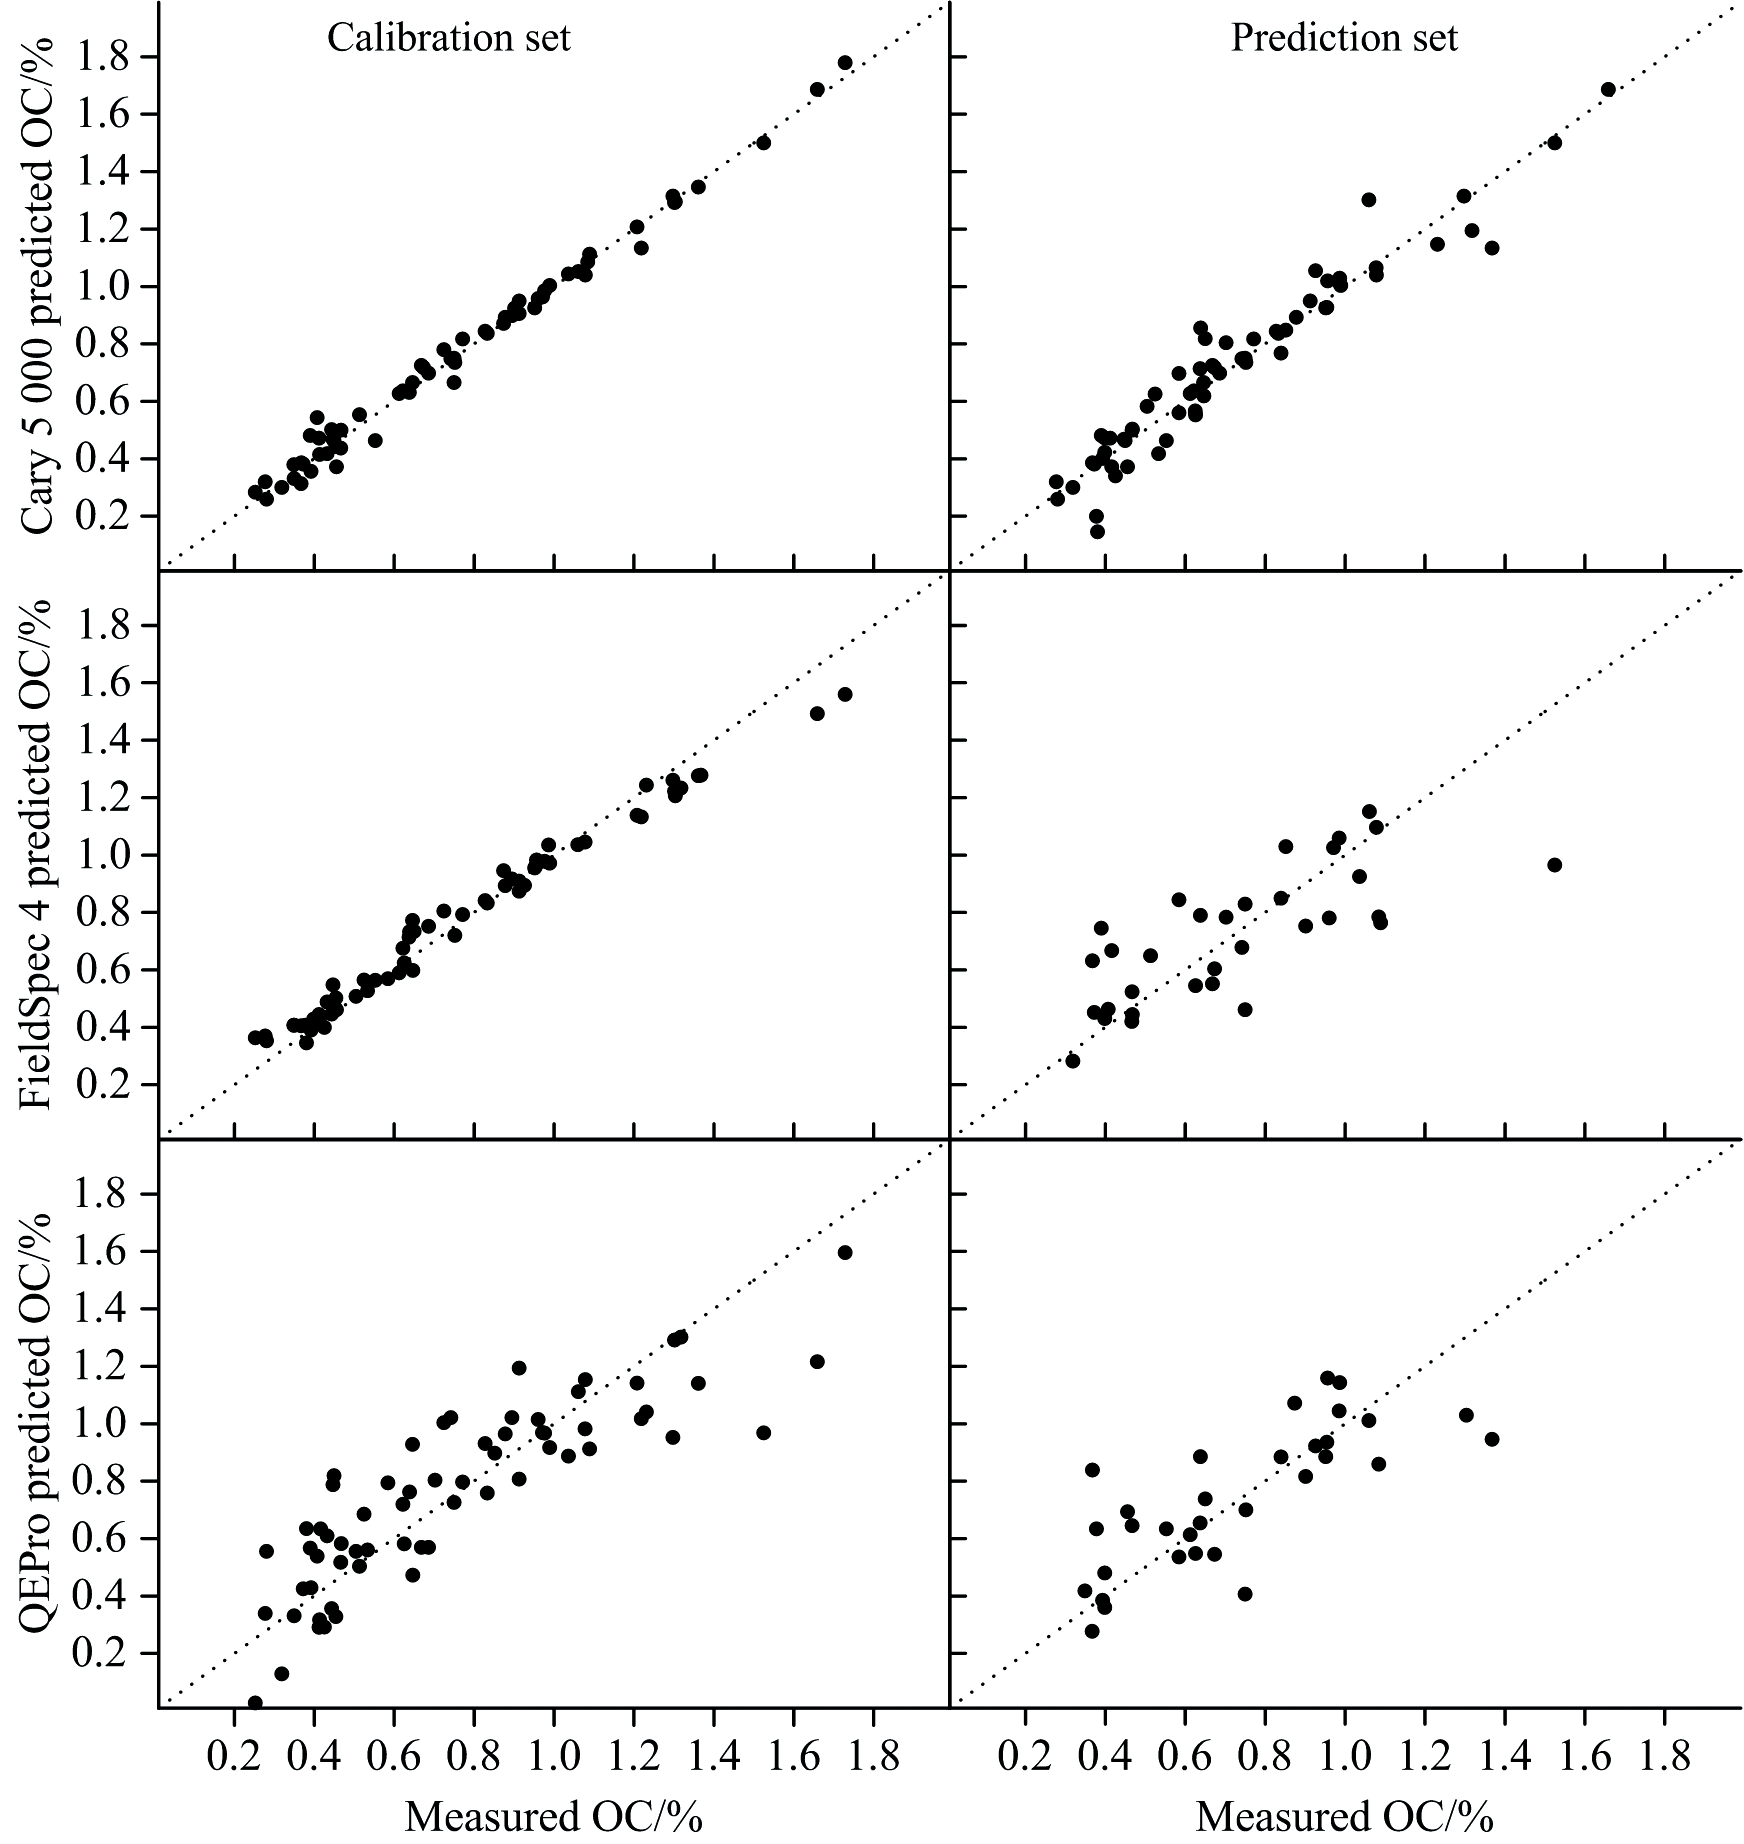 | 图3 利用三个光谱仪建立的黄渤海沉积物有机碳的光谱模型2.3 不同光谱仪建立的TOC光谱模型Fig.3 Spectral models of organic carbon in sediments of the Yellow Sea and Bohai Sea by the three spectrometers |
同假设一致, 便携式仪器的光谱分析结果都比室内仪器差(图3, 表2), 这可能是因为光谱仪在光谱分辨率、 系统信噪比、 杂散光、 探测器等方面存在较大差异(表1)。 Linderhom等[6]曾经利用ASD的室内光谱仪LabSpec及两款其他的便携式光谱仪测定土壤的分类, 发现室内光谱仪的分类能力比便携式的强, 可能是因为ASD的LabSpec光谱仪具有较宽的光谱范围、 较好的检测器。 本研究中, Cary5000是室内光谱仪, 技术指标也优于其他两个便携式光谱仪, 尤其是在信噪比、 杂散光、 波长重复性和波长准确性上, 具有显著优势(表1)。
但同假设也有不一致, 对于便携式光谱仪, FieldSpec 4和QEPro的效果是不相上下的(图3, 表2), 甚至可以说QEPro的效果更稳定, 至少对于本研究的黄渤海沉积物的有机碳是这样的。 QEPro的建模集和验证集具有更一致的预测能力, 虽然在建模集的误差(数据离散程度)最大, 但在验证集的误差低于FieldSpec 4, 显示了QEPro在检测沉积物有机碳上的强大光谱分析能力(图3、 表2)。 Yahaya等[5]在研究相同样品在不同光谱仪间的模型转移时, 也发现QE65000光谱仪建立的光谱模型能够较好地转移到FieldSpec 3光谱仪上, 显示QE系列的光谱仪和FieldSpec系列的光谱仪具有较好的通用性。
这意味着, 如果误差要求不太高, 对于稳定性要求更大的话, QEPro是不错的选择, 因为价格低, 适合室外使用。 但如果想建立一种光谱速测技术, 替代室内传统化学分析的话, 无疑Cary 5000是更好的选择。 本研究为选择不同光谱仪进行有效科学研究提供了直接参考, 还为模型转移提供了科学依据。
此外, 不同的可见-近红外光谱仪的性能存在显著差异, 采集同一样品的反射光谱及形成的光谱分析的结果也不一样[5, 6, 9]。 通常情况下, 要共享不同光谱仪的光谱模型, 必须进行模型传递/转移[5, 9, 10, 11]。 然而, 这个模型转移的工作量巨大, 并且转移效果并不一定理想[5], 因此, 如果能够无障碍地比对不同光谱仪采集的数据, 建立由此及彼的密切、 稳定的关系, 那么, 光谱仪的选择盲区就自然能够解决了, 本研究也为解决这个盲区提供了有效途径, 较深入地研究了沉积物有机碳在不同光谱仪间呈现的关键属性上的差异。
不同可见-近红外光谱仪的性能存在显著差异, 采集同一样品的反射光谱并形成的光谱分析的结果可能也不一样。 本研究分别利用安捷伦Cary5000、 ASD(Analytical Spectral Devices) FieldSpec4、 海洋光学QEPro三种光谱仪, 研究了中国黄渤海沉积物有机碳的光谱分析。 结果显示, 相同样品在不同仪器中采集的光谱反射率存在显著区别。 光谱分析结果也不一样, 其中, Cary5000的预测能力最好, 误差最小, 最稳定(在建模集和验证集基本一致); FieldSpec4的预测能力在建模集中表现较好, 但到验证集中失去了优势; QEPro的预测能力一般, 但是在建模集和验证集都是基本一致的。 便携式仪器的光谱分析结果都比室内仪器差, 主要因为光谱仪的技术参数存在较大差异。 对于本研究的两种便携式光谱仪FieldSpec4和QEPro, 如果误差要求不太高, 对于稳定性要求更大的话, QEPro是不错的选择, 因为价格低, 更适合室外使用。 本研究为选择不同光谱仪进行有效科学研究提供了直接参考, 还为模型转移提供了科学依据。
| [1] |
|
| [2] |
|
| [3] |
|
| [4] |
|
| [5] |
|
| [6] |
|
| [7] |
|
| [8] |
|
| [9] |
|
| [10] |
|
| [11] |
|