
基于多光谱成像技术的火焰温度及辐射率分布测量方法研究
[王文松1  , 裴晨曦
, 裴晨曦2 , 杨斌1, * , 王志新2 , 强科杰2 , 王莹1 ]
, 裴晨曦, 王志新|
|


火焰燃烧参数能直接反映火焰燃烧状态, 并对燃烧过程进行诊断、 预测和优化。 火焰温度及辐射率是燃烧状态的重要表征参数, 火焰温度及辐射率的准确测量对于建立燃烧模型、 优化燃烧过程和控制污染物排放有着非常重要的意义。 随着数字图像技术与光谱学的发展, 多光谱成像技术逐步应用于火焰燃烧温度及辐射率测量。 针对光谱仪空间分辨率低和RGB彩色相机光谱分辨率低的问题, 多光谱成像技术能获得兼顾空间分辨率及光谱分辨率的火焰光谱图像, 实现火焰温度及辐射率分布测量, 具有高时空分辨率、 响应快速及测温范围宽等优点。 因此, 提出了基于多光谱成像技术的火焰温度及辐射率测量方法, 搭建标准高温黑体辐射实验测量系统, 对多光谱相机665~960 nm波段开展高温黑体辐射响应系数标定实验, 获得多光谱相机25波段光谱响应标定系数, 通过四阶多项式拟合建立多光谱相机各波段下仪器响应值与理论辐射强度之间的关系, 并开展多光谱成像技术测量验证实验, 结果显示温度与辐射率测量的相对偏差分别小于1%与4%。 在此基础上, 以蜡烛火焰为研究对象, 建立了火焰多光谱成像测量系统, 获得了蜡烛火焰多光谱辐射图像, 基于普朗克辐射定律参数拟合方法, 实现了蜡烛火焰温度与辐射率分布测量。 测量结果表明: 火焰竖直平面上火焰中心区温度及辐射率均高于火焰上部和底部; 蜡烛火焰温度测量结果范围约为1 350~2 050 K, 火焰中心区最高温度约为2 050 K; 蜡烛火焰辐射率测量结果范围约为0.04~0.36, 火焰中心区最高辐射率为0.36。 测量结果与蜡烛火焰燃烧过程及辐射特性分布规律一致。
Biography: WANG Wen-song, (1998—), Master Degree Candidate, University of Shanghai for Science and Technology e-mail: 1033707094@qq.com
Flame combustion parameters can directly reflect the flame combustion state and diagnose, predict and optimize the combustion process. The accurate measurement of flame combustion temperature and emissivity is of great importance for building combustion models, optimizing combustion processes and controlling pollutant emissions. With the development of digital image technology and spectroscopy, multispectral imaging technology has been gradually applied to flame combustion temperature and emissivity measurement. For the problems of low spatial resolution of the spectrometer and low spectral resolution of RGB color camera, multispectral imaging technology can obtain flame spectral images with both spatial and spectral resolution and realize temperature and emissivity distribution measurement of flame, which has the advantages of high spatial and spectral resolution, fast response and wide temperature range. Here, the temperature and emissivity measurement method of flame based on multispectral imaging technology was proposed.The standard high-temperature blackbody radiation experimental measurement system was built to carry out the high-temperature blackbody radiation response coefficient calibration experiments for the 665~960 nm band of multispectral imaging camera. The 25 band spectral response calibration coefficient of multispectral imaging camera was obtained, and the relationship between the instrument response value and theoretical radiation intensity at each band of multispectral imaging camera was established by fourth-order polynomial fitting. The measurement-validated experiment of multispectral imaging technology was carried out. The relative deviation of temperature and emissivity measurement is less than 1% and 4%, respectively. The flame multispectral imaging measurement system was established with a candle flame as the research object. The multispectral radiation images of the candle flame were obtained, and the temperature and emissivity distribution measurement was realized based on Planck’s radiation law parameter fitting method.The measurement results show that the temperature and emissivity in the vertical plane of the central area of flame are higher than those in the upper and bottom in the vertical plane of flame; the range of flame temperature measurement results is about 1 350~2 050 K and the highest temperature in the central area is approximately 2 050 K; the range of flame emissivity measurement results is about 0.04~0.36, and the highest emissivity in the central area is 0.36. The measurement results are consistent with the candle flame-burning process and the distribution pattern of radiation characteristics.
Combustion, as a chemical reaction, widely exists in metallurgy, power stations, aerospace and other industrial production processes.Flame temperature and emissivity can directly reflect the combustion state, then diagnose, predict and optimize the device. Its accurate measurement is significant for establishing a combustion model, optimizing the combustion process and controlling pollutant emissions[1, 2, 3]. With the development of spectroscopy and digital image technology, flame radiation measurement has become one of the research hotspots in combustion diagnosis technology[4]. Compared with active laser spectroscopy[5, 6, 7, 8], the passive flame radiation measurement method has the advantages of non-contact, high spatial and temporal resolution, reliable system and no influence of combustion particle scattering, which is more suitable for online measurements of combustion flame parameters in the presence of industry.
The radiation image method is based on the image formed by projecting the radiation intensity emitted by combustion flame onto the image sensor area array. The two-dimensional distribution measurements of flame combustion parameters were realized by the processing of RGB three-band mode digital image. Matsuoka et al. calculated the 2D flame temperature field based on the two-color method through the obtained internal flame image of the diesel engine[9]. In order to further improve the spatial resolution of radiation image thermometry, Hossain et al. used cameras to obtain flame images from different viewing angles based on the two-color method. Combined with optical tomography, the 3D flame radiation image is reconstructed by Logical Filtered Back Projection (LFBP), Simultaneous iterative reconstruction and Algebraic Reconstruction Techniques (SART). Then, the 3D temperature field of flame is obtained[10]. Zhou et al devoted to the visualization and online detection technology of 2D and 3D temperature fields of combustion in furnace and proposed a variety of multi-parameter inversion algorithms based on the thermal radiation of the combustion field. Distribution of Ratio of Energy Scattered or Reflected (DRESOR) method based on the improved Tikhonov regularization method is used to invert the temperature field and radiation characteristics of dispersive media from the measured radiation images. Adding a certain random normal distribution error to the calculated radiant energy distribution, the error of the final result is less than 3%[11, 12, 13, 14]. Xu et al. applied light field imaging technology to the inversion of the 3D temperature field of flame and proposed a new method of 3D temperature measurement based on single and multi-light field cameras[15, 16]. Based on light field imaging, Niu et al. used the generalized source multiple flow method (GSMFM) to calculate the corresponding light intensity and optimized the simultaneous reconstruction method of photothermal parameters of dispersed media based on the hybrid optimization algorithm of least-square QR decomposition-particle swarm optimization (LSQR-PSO), which greatly improved the reconstruction accuracy of temperature field and radiation characteristic parameters of media[17].
Under the rapid development of multispectral imaging technology in recent years[18, 19], this technique adds a spectral dimension to the traditional two spatial dimensions by multispectral imaging camera to measure the radiation intensity of many continuous bands at each imaging unit. Multispectral imaging techniques can generate spectral images containing spatial and spectral information[20]. It is helpful to improve the measurement accuracy of flame combustion parameters. Liu et al. applied hyperspectral imaging technology to combustion diagnosis, combined multi-wavelength with radiation characteristics, and proposed a combustion parameter analysis method based on Newton iteration to realize the measurement of flame internal parameter distribution[21]. Mahfouz et al. used a hyperspectral camera to study the reaction rate intensity in and around a turbulent flame mixed with light diesel, waste cooking oil and light and light diesel fuel. The error between calculated flame temperature and thermocouple measurement data is less than 2%[22].
To further improve the measurement accuracy of temperature and emissivity, the measurement method of flame temperature and emissivity based on parameter fitting of Planck’ s blackbody radiation law is proposed by obtaining flame multispectral radiation images. The spectral response coefficients of 25 bands of multispectral imaging cameras are obtained by calibrating the response coefficients of high-temperature blackbody radiation multispectral imaging cameras. Therefore, the experimental study on measuring the temperature and emissivity distribution of typical candle flame is carried out.
Unlike color RGB cameras, which have only three bands per pixel, the sensors of multispectral cameras have dozens to hundreds of various bands for each pixel. Multispectral imaging technology can simultaneously obtain information on the spatial distribution of combustion flameand spectral information in multiple bands; this technology has higher spectral resolution and can use the rich radiation spectral information to analyze the emissivity model of combustion flame. The spectral response bandwidth of each band is small, and the integrated response within the band can be equivalent to the single wavelength response, which can reflect the information of combustion flame in the spectral dimension more accurately. As shown in Fig.1, this is the schematic diagram of multispectral imaging. Fig.1(a) shows the schematic diagram of multispectral imaging. When the flame high-temperature radiation source into the front slit of the spectral module is filtered into a line, this line through the prism-grating-prism group after the spectral expansion in the direction perpendicular to this line, and then reflected the microarray sensor assembly, can achieve the same radiation source of multiple different wavelength imaging. The spectral imaging technique uses microarray photoreceptors, as shown in Fig.1(b), where each spatial image element of the microarray sensor of the multispectral camera which used in this paper has a detector with 25 bands ranging from 665 to 960 nm. Thus, the acquired two-dimensional multispectral image can be reconstructed into a three-dimensional image based on the response of each band.
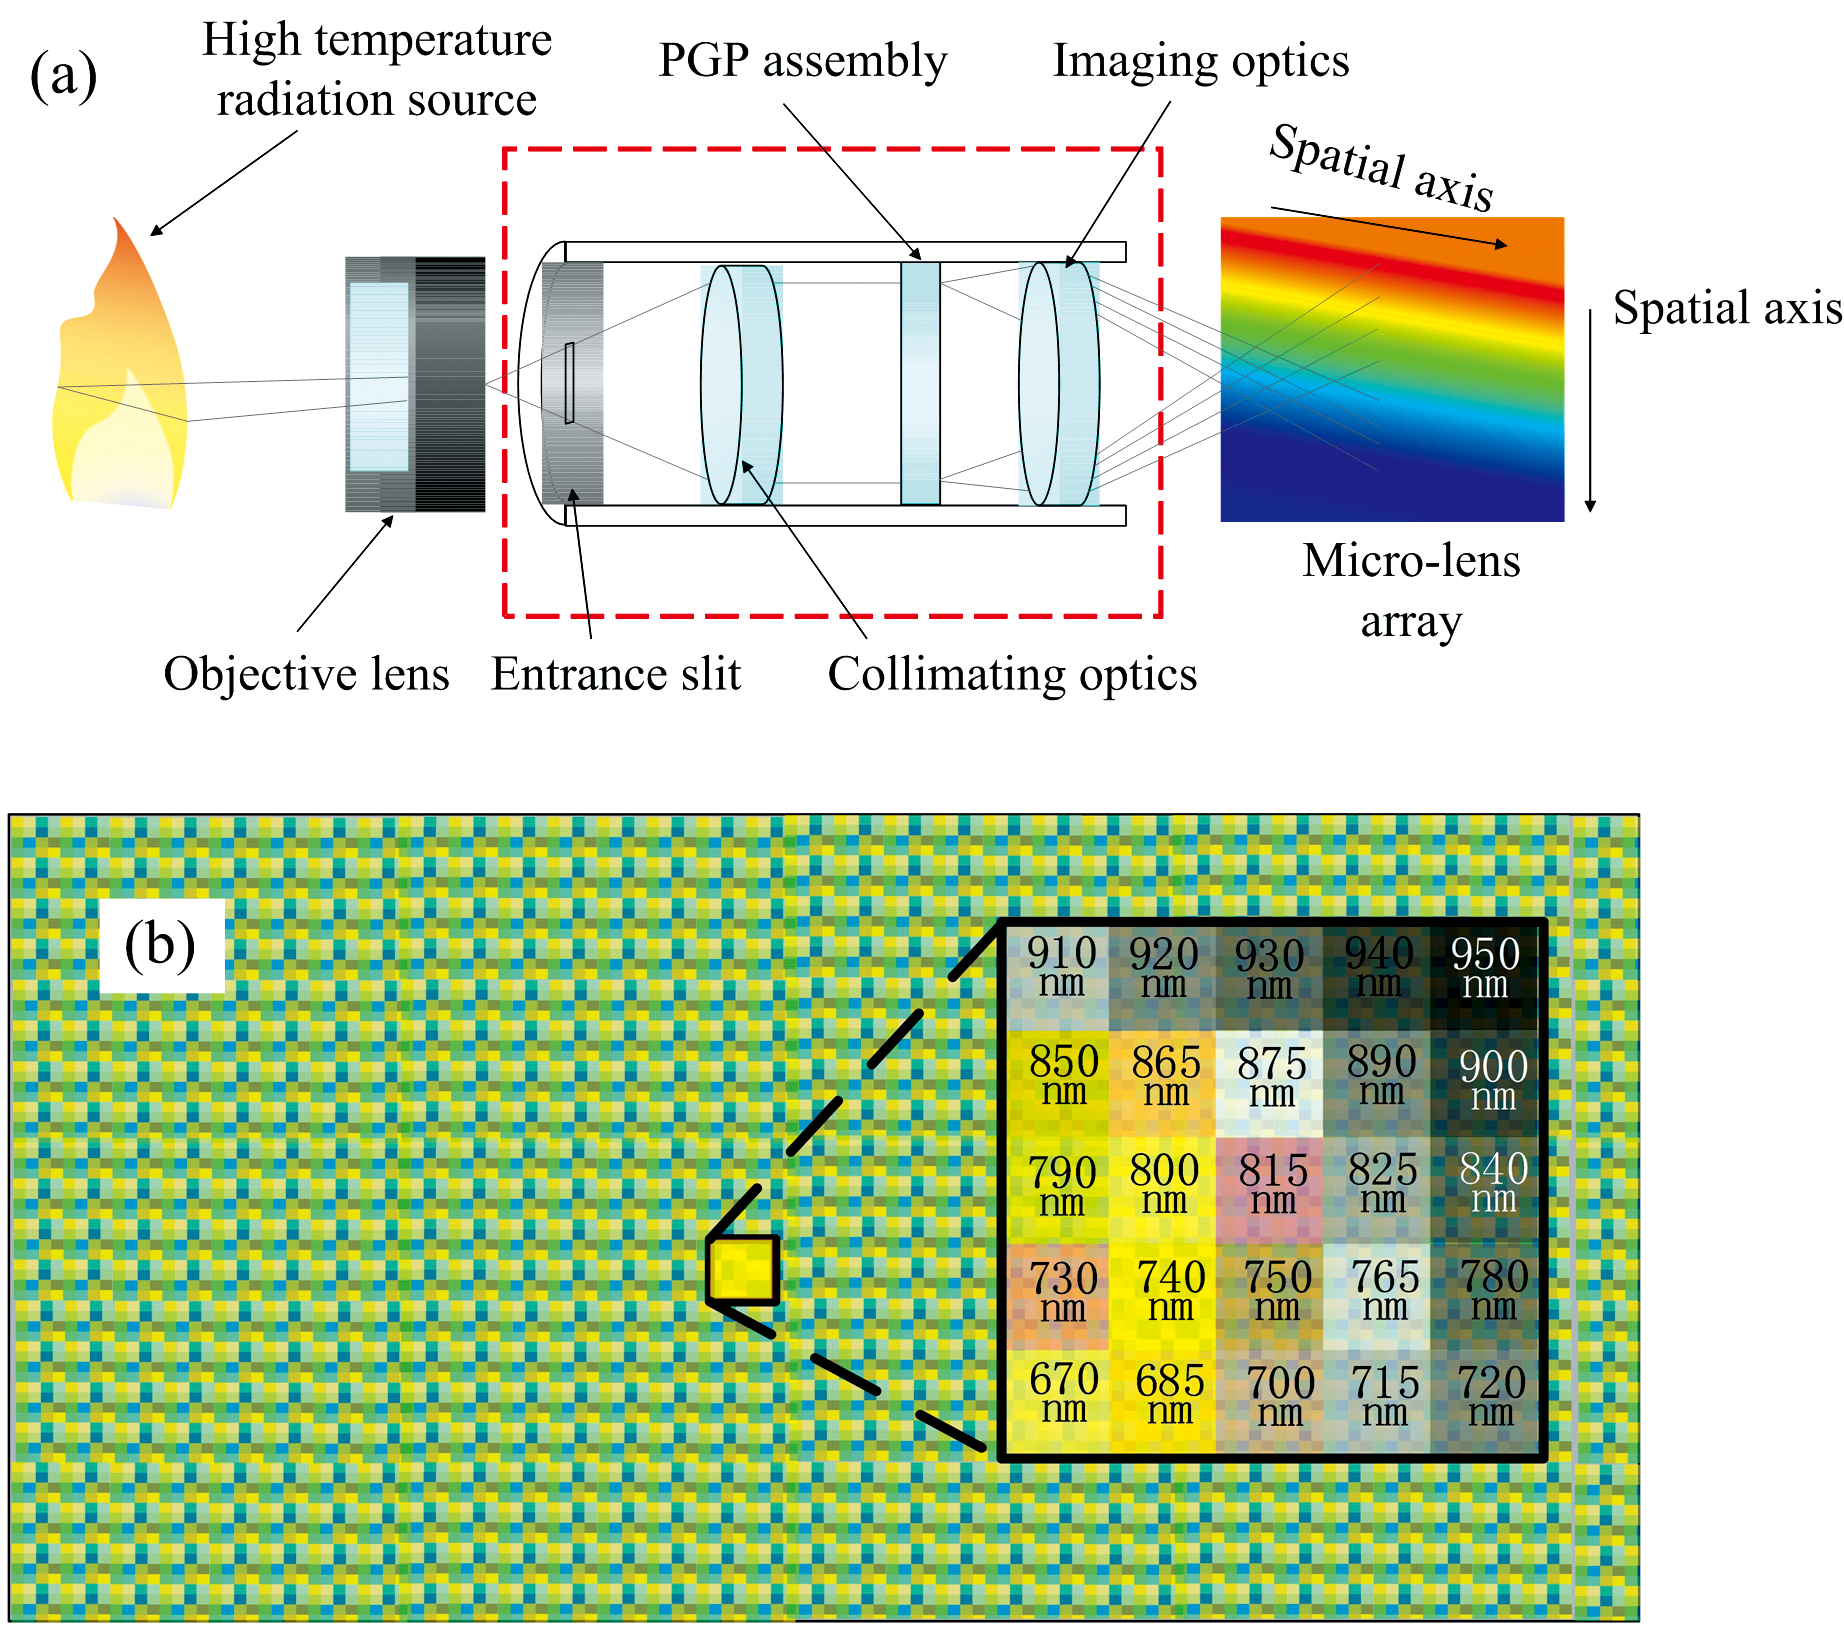 | Fig.1 Schematic of multispectral imaging (a) and Microarray sensor (b) (a): Multispectral imaging schematic; (b): Microarray sensors |
Planck’ s blackbody radiation law[23, 24] describes the change of spectral radiation force of an actual object with wavelength at a specific temperature
where Eλ is spectral radiation force, W· m-3; ε λ is the actual emissivity of the object; T is thermodynamic temperature, K; λ is wavelength, μ m; C1=3.741 9× 10-16 W· m2 and C2=1.438 8× 10⁻² m· K are the first and second Planck radiation constants, respectively. When the temperature and wavelength follow λ T≤ 3 000 μ m· K, plank’ s law can be simplified to Wien’ s law
In measuring temperature and emissivity parameters based on radiation spectroscopy, it is necessary to use multispectral imaging system to measure radiation signals at different wavelengths of radiation objects. Because the measured radiation image signal is the electrical signal after photoelectric conversion, it is the relative intensity related to the response characteristics of multispectral camera. Therefore, it is necessary to calibrate the absolute intensity of multispectral imaging system by using a standard blackbody furnace, and the radiation intensity detected by the spectrometer can be expressed as:
In the equation, the absolute radiation intensity of Emλ multispectral imaging camera calibrated by standard high-temperature radiation source in λ band, Rλ is the response value of multispectral imaging camera in this band, t is the exposure time, and ai(i=1~4) is the coefficients of each order of assumed polynomial relationship, which is obtained by blackbody furnace calibration experiment. Based on the nonlinear least square algorithm, the measured radiation intensity is selected and combined with Equation (2) to establish an objective function, as shown in Equation (4)
$\text{minf}\left( \text{ }\!\!\varepsilon\!\!\text{ }, \text{T} \right)=\text{min}\overset{n}{\mathop{\underset{\lambda =1}{\mathop \sum }\, }}\, {{(\text{ln}{{E}_{\lambda }}-\text{ln}{{E}_{m\lambda }})}^{2}}=\text{ }\!\!~\!\!\text{ min}\overset{n}{\mathop{\underset{\lambda =1}{\mathop \sum }\, }}\, {{\left( \text{ln}\varepsilon +\text{ln}{{C}_{1}}-5\text{ln}\lambda -\frac{{{C}_{2}}}{\lambda T}-\text{ln}{{E}_{m\lambda }} \right)}^{2}}$(4)
where C1 and C2 are known constants, and n is a number of the wavelengths when wavelength is λ . When the objective function f(ε , T) gets the minimum value, ε and T are the emissivity and temperature of pixels obtained by fitting. According to ε and T, the binding force E of flame in the range of high temperature can be calculated based on Stefan-Boltzmann’ s law.
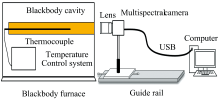
The experimental system of standard high-temperature blackbody radiation multispectral imaging, as shown in Fig.2 is built. The calibration system consists of a blackbody furnace (Shanghai Fuyuan Photoelectric Technology Co., Ltd., HFY-203B), multispectral camera(XIMEA, VIS-NIR, IMEC), zoom lens and computer. The blackbody furnace is used as the standard blackbody radiation source, and the blackbody radiation objects at different temperatures are obtained by setting different temperature values. The 25 bands response law of standard high-temperature blackbody radiation spectral image is studied, and the inversion algorithm of temperature and emissivity parameter distribution of multispectral image is established. The zoom lens is used to accurately focus on the radiation cavity’ s target surface. The lens transmits the blackbody radiation optical signal to a multi-spectral camera sensor array for photoelectric conversion to obtain the multispectral radiation image of the target surface of the blackbody furnace. The range of multispectral cameras is 665~960 nm, and each spatial pixel unit corresponds to 25 spectral bands. The sampling frame rate of the multispectral camera is 80 fps, and the total pixel arrangement is 2 045× 1 088 pixels. The spectral bandwidth of each band is within 15 nm.
 | Fig.2 The experimental system of standard high-temperature blackbody radiation multispectral imaging |
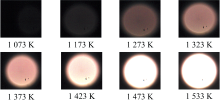
The radiation image of the blackbody radiation target surface was collected by multispectral camera. The temperature resolution of the blackbody furnace is 1 ℃. The temperature sensor is a double platinum-rhodium thermocouple, and the range of temperature measurement accuracy of this thermocouple is ± 0.4%× t. The temperature range is 500~1 450 ℃, and the effective emissivity range is 0.98~0.99. Traditional industrial cameras display images through RGB color industrial mode, represented by the response values of R, G and B color channels, whose representative wavelengths are 700.0, 546.1 and 435.8 nm, respectively. Since the spectral range of the multispectral imaging camera is in the near-infrared band of 665~960 nm, the response values of the 18th, 12th and 6th bands (the central wavelengths are 877.54, 803.03 and 728.57 nm) were selected to establish the pseudo-color radiation image according to the RGB color industrial standard. Therefore, a blackbody furnace was used to calibrate the response intensity of the multispectral camera in the temperature range of 1 073~1 533 K, and the pseudo-color radiation image obtained is shown in Fig.3.
 | Fig.3 The pseudo-color images of blackbody radiation at different temperatures |
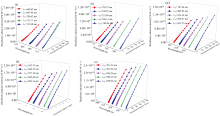
The blackbody furnace provides radiation reference values of the blackbody radiation intensity at different temperatures to obtain the response coefficient between the 25 band camera response value and the theoretical blackbody radiation intensity. According to Equation (3), the fourth-order polynomial is used to characterize the relationship between the instrument response value and the absolute radiation intensity at each wavelength of unit exposure time, as shown in Fig.4.
 | Fig.4 Polynomial fitting results of 25 bands response of multispectral camera (a): 669.62~712.40 nm band; (b): 728.57~780.96 nm band; (c): 787.48~841.37 nm band; (d): 852.25~898.14 nm band; (e): 913.34~949.92 nm band |
In order to verify the accuracy of the spectral images’ temperature and emissivity measurement results, six different sets of blackbody furnace temperatures were set in the temperature range of 1 100~1 600 K. The temperature and emissivity measurements were analyzed and compared with the blackbody furnace set temperature to calculate the measurement error. The results of the temperature and emissivity measurements are shown in Table 1. The corrected radiation spectra in the 670~950 nm band were analyzed using the parameter fitting method to obtain the corresponding temperature Tm and emissivity ε . Compared with the experimental blackbody furnace set temperature Tb and emissivity 0.99, it can be seen that the relative deviation of the temperature and reference value of the radiation spectrometry method is less than 1%. The measurement deviation of the emissivity is less than 3%, thus verifying the accuracy of the radiation spectrometry method for high temperature flame radiation parameters.
| Table 1 Measurement results of the verification experiment |
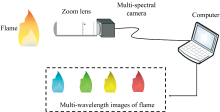
The candle flame is the typical diffusion flame, involving the processes of solid fuel liquefaction by heat, liquid fuel evaporation and diffusion combustion. Candle flame temperature and emissivity directly reflect combustion state, and their accurate measurement is significant for the study of diffusion flame. The experimental system of high-temperature flame measurement is built based on multispectral radiation images, as shown in Fig.5. The measurement system mainly composed zoom lens, multispectral camera and computer. The radiation light of high-temperature flame is mapped to the target surface of multispectral camera sensor through the lens for spectral imaging. The multispectral image is sent to the computer to decompose the 2D information obtained by the sensor target into spatial pixel information and multispectral information corresponding to each pixel. Then the parameters of the temperature field and emissivity field of high-temperature flame are calculated.
 | Fig.5 Schematic diagram of multispectral radiation image flame measurement system |
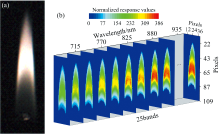
Using multispectral camera to collect the radiation image of high-temperature flame, not only the radiation image of the flame can be obtained, but also the spectral information of each pixel can be analyzed. Then the emissivity parameters and temperature parameters of different positions of the flame can be obtained. The multispectral imaging system is used to capture flame radiation images. The camera can capture flame images and create 25 images with 217 (h)× 409 (v) pixels.During the candle flame measurement, when the flame burning state is stable, the candle flame is imaged by a multispectral camera, and the multispectral image contains spatial and spectral information, which can be used to analyze the spatial and spectral distribution of flame radiation properties. The multi-band spectral radiation images of the candle flame obtained based on the above experimental system measurements are shown in Fig.6. The pseudo-color image of high-temperature flame is shown in Fig.6(a), and the pseudo-color radiation image is established according to the RGB threebands color image by selecting the spatial distribution of response intensity in the 18th, 12th and 6th bands respectively. The intensity distribution of multispectral radiation image is 3D, x, y plane represents the distribution of radiation intensity at spatial pixels, z-axis represents the response intensity distribution of 25 bands in the range of 665~960 nm, and the bit depth of spectral camera sensor is 10 bits. It can be seen from Fig.6(b) that the radiation intensity of different wave bands is different, which is determined by the radiation intensity of high-temperature flame in each wave band and the response characteristics of the sensor.
 | Fig.6 Flame multispectral image (a): Flame pseudo color chart; (b): Response diagram of each waveband of the flame |
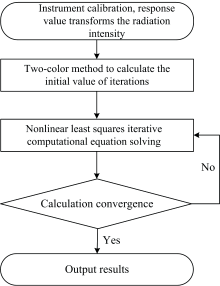
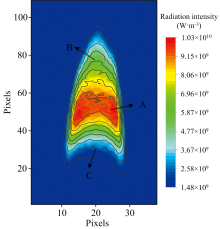
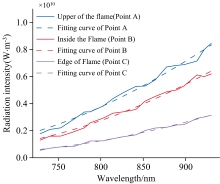
Based on the principle of multispectral radiation image temperature and emissivity measurement and nonlinear least square fitting, the two-color method is used as the iterative initial value. The main analysis process of solving the combustion parameters of high-temperature flame is shown in Fig.7. An image of a typical candle flame intensity at a wavelength of 949.92 nm is shown in Fig.8. As multispectral imaging is a path-integrated projection in the vertical plane of flame, it can be seen that the intensity of the candle flame radiation in the vertical plane of the central area of the flame is higher, the bottom of the vertical plane of the flame and above the radiation is weaker. It is due to the bottom area of the flame after the candle is heated, the paraffin wax is liquefied and transported through the wick, which is further heated to evaporate to produce paraffin evaporation gas; in the vertical plane of the central area of flame the paraffin evaporation gas is pyrolyzed to produce solid particles of charcoal smoke and lighter hydrocarbons and other combustible components, which diffuse outwards to react with oxygen in the environment, resulting in a higher temperature in the vertical plane of central area of flame. The temperature in the central area of the vertical plane flame is higher, and due to the high-temperature soot, the radiation spectrum is stronger in the near-infrared band; as the combustion reaction ends, the temperature decreases in the area above the flame along the vertical plane. Therefore, the analysis of candle flame radiation spectra usually selects three typical characteristic points in the bottom area, central area and top area in the vertical plane of the flame as the object[25]. As shown in Fig.8, the radiation spectra of three pixels, points A, B and C, are selected and analyzed to characterize the spectral features of the bottom area, central area and top area in the vertical plane of flame, respectively. The response radiation spectra of the extracted pixel points A, B and C are corrected by the sensor response curves obtained from the calibration experiments, and the resulting radiation spectra are shown as solid lines in Fig.9, where the spectral radiation intensity of the pixels at points A, B and C increases with increasing wavelength. Based on Plank’ s law of spectral radiation force formula for the theoretical radiation spectrum in the 690~950 nm band for temperature and emissivity parameters fitting analysis, the dashed line is the fitted curve for high-temperature flame at each position of the temperature, emissivity and radiation intensity parameters as shown in Table 2, temperature and emissivity parameters are obtained by nonlinear least squares parameter fitting analysis method, candle flame spectral distribution shows continuous characteristics, the intensity of the radiation is determined by both the emissivity and the temperature. The intensity is calculated by combining the measured emissivity and temperature with the Equation (5).
 | Fig.7 Flow chart of combustion parameter measurement data processing |
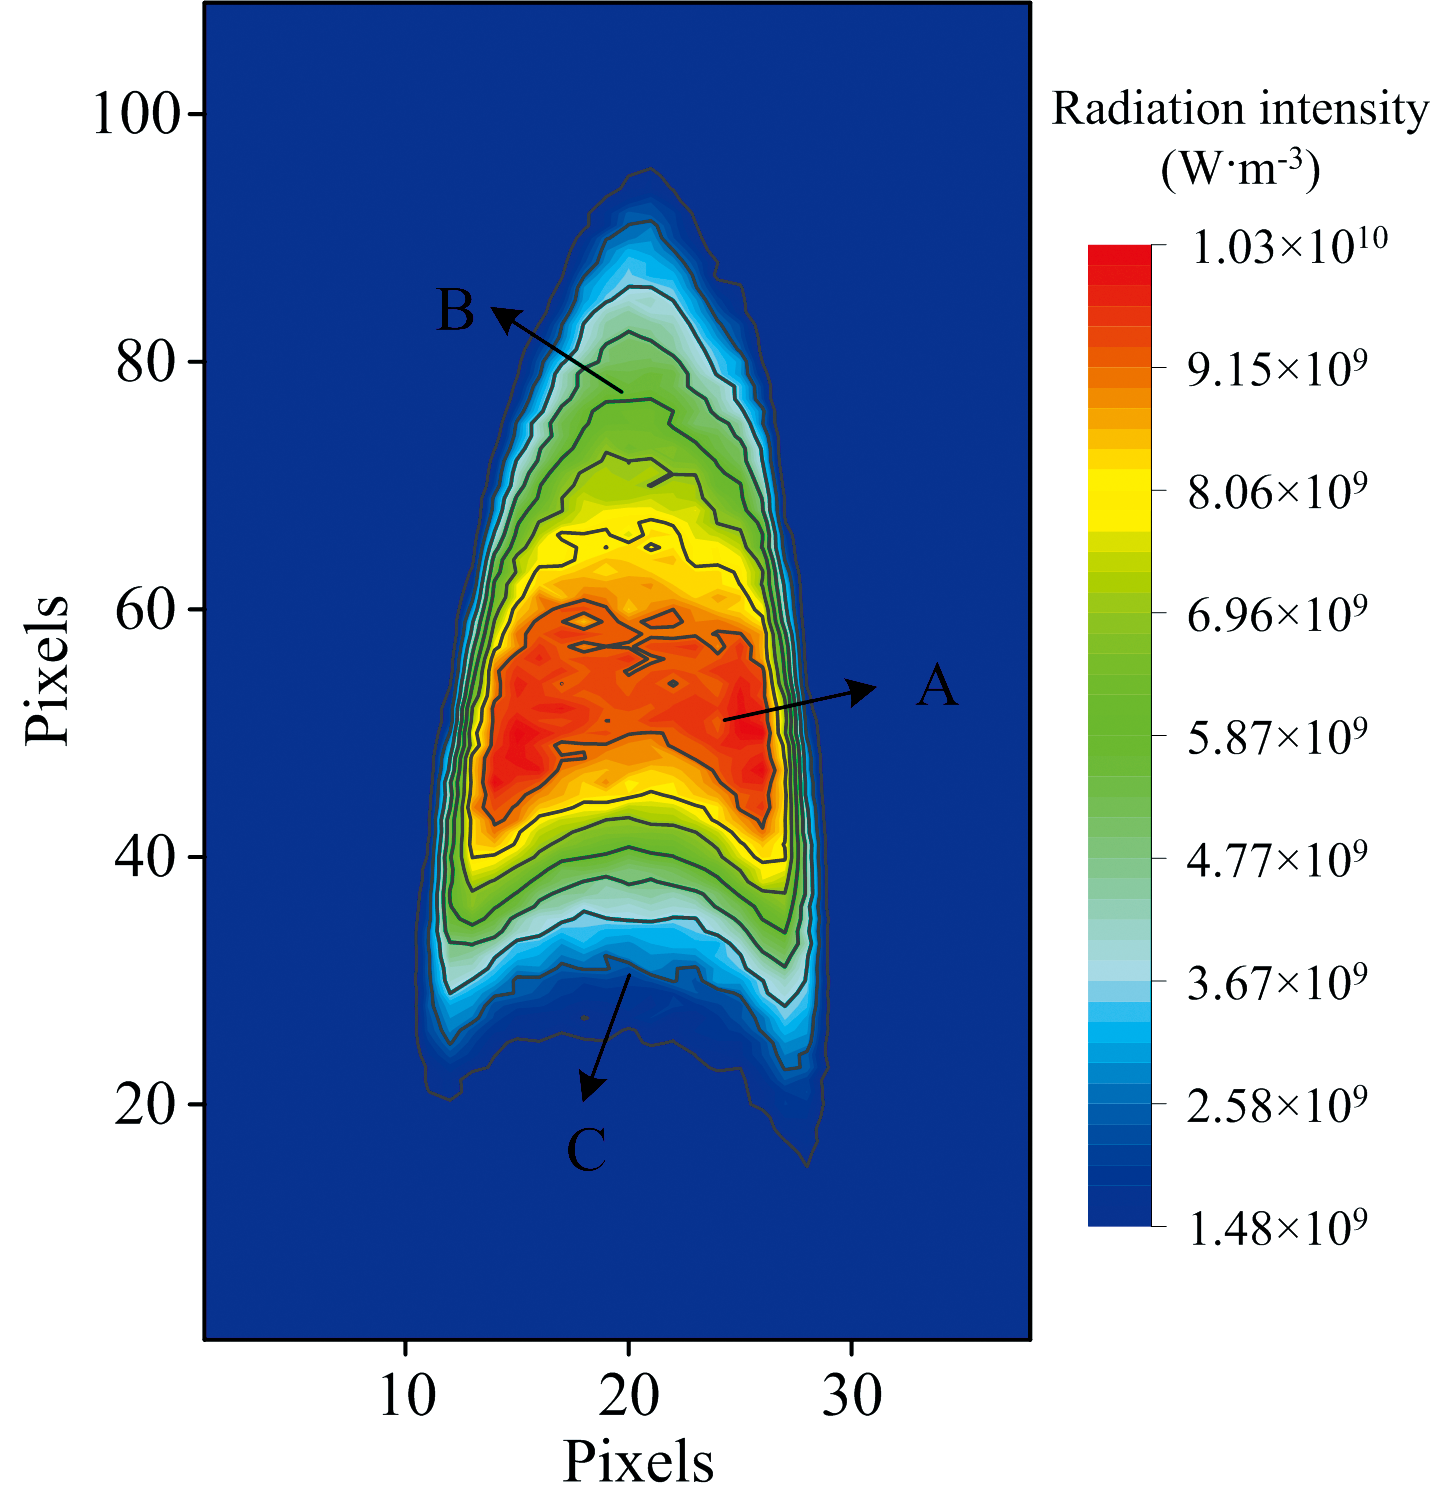 | Fig.8 Typical radiation intensity distribution of the candle flame at 949.92 nm |
 | Fig.9 The flame radiation intensity varying with wavelength at points A, B, C |
| Table 2 Measurement resultsof flame temperature and emissivity |
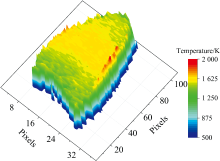
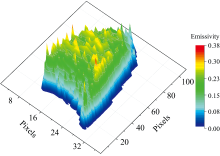
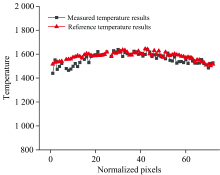
The spatial distribution of temperature and emissivity of candle flame is analyzed, as shown in Fig.10 and Fig.11. It can be seen that the range of temperature distribution diagram that measurement results is about 1 350~2 050 K. The maximum temperature in the vertical plane ofthe central area of flame is approximately 2 050 K, consistent with Thomsen et al.[6] who measured the peak candle flame temperature of 2 000~2 200 K. In addition, the measurement results of the candle flame mid-axis temperature distribution in reference[26] were compared with the measurement results of multispectral imaging in this paper to verify that the maximum relative deviation of the visible temperature was 6.10%, as shown in Fig.12, further confirming the reliability of the flame candle temperature measurements in this paper. In addition, the candle flame range of emissivity is about 0.04 to 0.36, with the highest emissivity in the vertical plane of the central area of the flame being approximately 0.36, consistent with the candle emissivity measurements by Zheng et al.[25]. It is clear from these measurements that the paraffin evaporation gas from the evaporation of the candle by heat diffuses outwards in the vertical plane of the central area of flame and reacts with oxygen in the environment by combustion, resulting in a higher flame temperature in this region. In addition, the emissivity in this region is also higher since the paraffin evaporation gas produces more charcoal smoke solid particles from pyrolysis near the wick in the vertical plane of the central area of flame, and the flame radiation in the 665~960 nm band is mainly from high-temperature solid particle radiation.
 | Fig.10 Measurement result of flame temperature distribution |
 | Fig.11 Measurement result of flame emissivity distribution |
 | Fig.12 Comparison of flame temperature measurement results |
In this paper, the characterization of candle flame spectra by multispectral imaging techniques is mainly studied, and the following findings are obtained:
(1) A method for measuring the temperature and emissivity of multispectral imaging based on Planck’ s law parameter fitting is investigated. The spectral response coefficients for each band of the multispectral imaging device are obtained utilizing a standard high-temperature blackbody radiation experimental measurement system, and the relative deviations of temperature and emissivity measurements are verified to is less than 1% and 3% respectively.
(2) The temperature and emissivity measurements of multispectral imaging were applied to the measurement of candle flame. The results show that the temperature and emissivity in the vertical plane of the central area of candle flame are higher than those of the upper and lower parts in the vertical plane of flame; the range of flame temperature is about 1 350~2 050 K. The highest temperature of the vertical flame central area is about 2 050 K. The range of candle flame emissivity is about 0.04~0.36, and the highest emissivity in the vertical plane of the central area of flame is about 0.36. The results are consistent with the combustion process of the candle flame and the distribution of radiation characteristics.
| [1] |
|
| [2] |
|
| [3] |
|
| [4] |
|
| [5] |
|
| [6] |
|
| [7] |
|
| [8] |
|
| [9] |
|
| [10] |
|
| [11] |
|
| [12] |
|
| [13] |
|
| [14] |
|
| [15] |
|
| [16] |
|
| [17] |
|
| [18] |
|
| [19] |
|
| [20] |
|
| [21] |
|
| [22] |
|
| [23] |
|
| [24] |
|
| [25] |
|
| [26] |
|