

基于特征波长积分算法的土壤有机质抗水分干扰模型研究
引用本文
赵锐, 宋海燕, 赵耀, 苏勤, 李伟, 孙义舒, 谌英敏. 基于特征波长积分算法的土壤有机质抗水分干扰模型研究[J]. 光谱学与光谱分析, 2022,42(3): 984-989.
ZHAO Rui, SONG Hai-yan, ZHAO Yao, SU Qin, LI Wei, SUN Yi-shu, CHEN Ying-min. Research on Anti-Moisture Interference Soil Organic Matter Model Based on Characteristic Wavelength Integration Algorithm[J]. Spectroscopy and Spectral Analysis, 2022,42(3): 984-989.
Doi:10.3964/j.issn.1000-0593(2022)03-0984-06
Permissions
ZHAO Rui, SONG Hai-yan, ZHAO Yao, SU Qin, LI Wei, SUN Yi-shu, CHEN Ying-min. Research on Anti-Moisture Interference Soil Organic Matter Model Based on Characteristic Wavelength Integration Algorithm[J]. Spectroscopy and Spectral Analysis, 2022,42(3): 984-989.
Doi:10.3964/j.issn.1000-0593(2022)03-0984-06
Copyright©2022, 《光谱学与光谱分析》期刊社
《光谱学与光谱分析》期刊社 所有
基于特征波长积分算法的土壤有机质抗水分干扰模型研究
摘要
土壤有机质是土壤的重要成分, 也是农作物生长的重要营养指标。 快速、 准确检测土壤有机质含量对施肥管理具有重要意义。 近年来, 近红外光谱被广泛应用于土壤有机质的快速检测, 然而土壤有机质敏感波段易受土壤水分干扰, 从而会影响到土壤有机质的预测结果。 在山西省境内采集了140个土壤样本, 采用ASD光谱仪分别获取了不同含水率(0%, 5%, 10%, 15%, 17%)土壤样本谱图曲线(350~2 500 nm)。 为了提高土壤有机质预测模型精度, 提出特征波长积分算法, 即通过特征波长处吸光度的积分值作为自变量进行建模的方法, 建立了土壤有机质预测模型及抗水分干扰修正系数模型。 结果表明: (1)使用特征波长处吸光度的积分值作为自变量建立的土壤有机质预测模型统计参数优于传统的使用特征波长处的吸光度值作为自变量的建模方法; (2)校正后的湿土光谱更加接近干土土样, 在一定程度上解决了传统水分修正系数在水分含量较高时修正效果较差的问题; (3)提高了湿土样本的预测精度, 预测相关系数( RP)提升了约0.09, 预测均方根误差(RMSEP)降低了约1.72 。 说明该方法可以有效降低水分对土壤有机质光谱的影响, 提高不同含水率土壤有机质的预测精度, 可为后续仪器开发提供理论支持。
关键词:
土壤有机质; 近红外光谱; 积分算法; 水分修正系数
中图分类号:O434.3
文献标志码:A
Research on Anti-Moisture Interference Soil Organic Matter Model Based on Characteristic Wavelength Integration Algorithm
Abstract
As an important component in soil, soil organic matter (SOM) is a critical nutrition index in the process of crop growth. Rapid and accurate detection of SOM content is of great significance for the fertilization management. In recent years, NIR has been widely used in the rapid detection of SOM. However, soil moisture is one of the important factors that affect the prediction results of SOM. In this study, 140 soil samples were collected in Shanxi Province, and the spectral information with different water content (0%, 5%, 10%, 15%, 17%) was collected by ASD spectrometer (350~2 500 nm). In order to improve the accuracy of the SOM prediction model, a characteristic wavelength integration algorithm (taking the integral absorbance value at characteristic wavelength as the independent variable) was proposed. The results show that: (1) the statistical parameters of the SOM prediction model established by this algorithm are better than the traditional characteristic wavelength modeling method; (2) the moisture correction model established by this algorithm can eliminate the influence of moisture, and the corrected spectra of wet soil samples are closer to the corresponding dry soil samples; (3) the prediction accuracy of wet soil samples is improved. The RP increased by about 0.09 and RMSEP decreased by about 1.72. The results show that the method can effectively reduce the influence of soil moisture on the spectral characteristics of SOM, improve the prediction accuracy of SOM with different water content, and provide theoretical support for the subsequent instrument development.
Keyword:
Soil organic matter; Near-infrared spectroscopy; Integration algorithm; Moisture correction coefficient
Introduction
Near-infrared spectroscopy (NIRS) has been widely used in analysing and detecting material components in the agricultural field due to its advantages of high efficiency, rapid measurement, and non-destructivity. The soil organic matter (SOM) content is an important indicator to measure soil fertility. The measurement of SOM by NIRS has become an important direction in soil science research.
At present, the establishment of the SOM prediction model based on near-infrared spectroscopy technology is mainly divided into full band[1, 2, 3] and characteristic band[1, 4, 5]. The fullband modeling method will contain more spectral information. However, with the increase of useful information, the irrelevant information redundancy will also increase[1], This not only makes the model too complex, but also is not conducive to the subsequent instrument development. The characteristic band modeling method can significantly reduce the complexity of the model and improve the operation speed. However, because the NIR spectral band is a combination of multiple and combined bands of several different fundamental frequencies, there are a large number of overlapping spectral peaks and shoulder peaks[6], which makes it very difficult to extract the information of NIR spectrum and accurately determine the attribution of the spectral band. Therefore, modeling a certain region band centered on the characteristic wavelength can effectively alleviate the problems caused by single feature wavelength extraction and modeling, and improve the robustness of the model. In addition, due to the obvious absorption peak of soil moisture in the near infrared region, the spectral characteristics of SOM will be covered up[7], so it is necessary to remove the water interference for the prediction of SOM content. Domestic and foreign scholars have put forward some effective methods for the influence of moisture on the spectral measurement of organic matter, such as EPO (external parameter orthogonalization)[8, 9, 10], DS (direct standardization)[11], and constructing moisture correction coefficient[12].
Because of the spectral characteristics of NIR spectroscopy and the interference of moisture on the spectral curve of organic matter, the following two works were carried out: (1) A quantitative SOM prediction model was established by taking the integral absorbance value at characteristic wavelength as the independent variable; (2) A new algorithm of soil moisture correction coefficient is constructed based on the integral absorbance value of soil moisture at the characteristic wavelength.
1 Materials and methods
1.1 Sample
In this study, 140 soil samples were collected in Shanxi Province (Taigu, Guandishan, Youyu, Loufan, Ningwu) at a depth of 5~15 cm above the ground. All soil samples were air-dried and divided into two groups evenly. One group was used for SOM content detection. The other was used to prepare soil samples with a moisture content of 0%, 5%, 10%, 15%, and 17%. The SOM content is tested by the potassium dichromate method(National standard method of China, GB9834— 88). The statistic results show thatthe maximum content of organic matteris 63.98, the minimum is 4.02, the average is 19.475, and the standard deviation is 14.043.
1.2 Spectral data collection
The Field Spec3 spectrometer developed by the American ASD company was used to collect the spectral data of the soil samples. The main working parameters of the instrument are: spectral scanning range is 350~2 500 nm; data interval is 1 nm. After the spectrometer was preheating and stabilizing, soil sample was placed in a petri dish and scraped flat for spectrum collection. The whole spectral scanning process was carried out at room temperature. MATLAB_R2014b software was used for data analysis.
1.3 Integration algorithm based on characteristic band
Extraction of characteristic wavelengths can simplify the model, and more importantly, it can eliminate irrelevant or nonlinear variables. However, the wavelength obtained by different extraction methods always fluctuates within a range, and the space with a small fluctuation range is always the effective characteristic band. Therefore, this paper proposes an algorithm that takes the integral absorbance value at characteristic wavelength as the independent variable and establishes the model. It eliminates the local optimization defect of the characteristic wavelength extraction algorithm to a certain extent. The specific steps are as follows:
(1) Obtain the sensitive wavelength by using spectral characteristic wavelength extraction algorithm;
(2) Take the extracted characteristic wavelength value as the center, and calculate the approximate area surrounded by the spectral curve by taking a left and right n nm. The area of the rectangle is obtained by taking the difference of adjacent wavelengths as one side of the approximate rectangle and the corresponding absorbance value as the other side;
(3) Sum of all areas and take it as an independent variable.
The integration algorithm can be expressed as follows:
This formula, Aλ represents the absorbance value of the spectrum at the wavelength λ , i is the integration variable, mis the integration range, and ris the data interval of the spectrum curve measured by the spectrometer, here is 1 nm.
2 Results and discussion
2.1 Establishment of soil organic matter prediction model
ASD company’ s software View Spec Pro 6.0 was used for spectral preprocessing, and the spectra were obtained after the mean, splicing correction and spectral reflectance logarithm operation.The spectral data of 140 dry soil samples are shown in Fig.1. It can be seen that all samples have typical soil spectral characteristics, the visible light range (350~780 nm) curve shows a clear downward trend, the near-infrared band (780~2 500 nm) spectral curve is relatively flat, and there are obvious absorption peaks near 1 400, 1 950 and 2 200 nm.
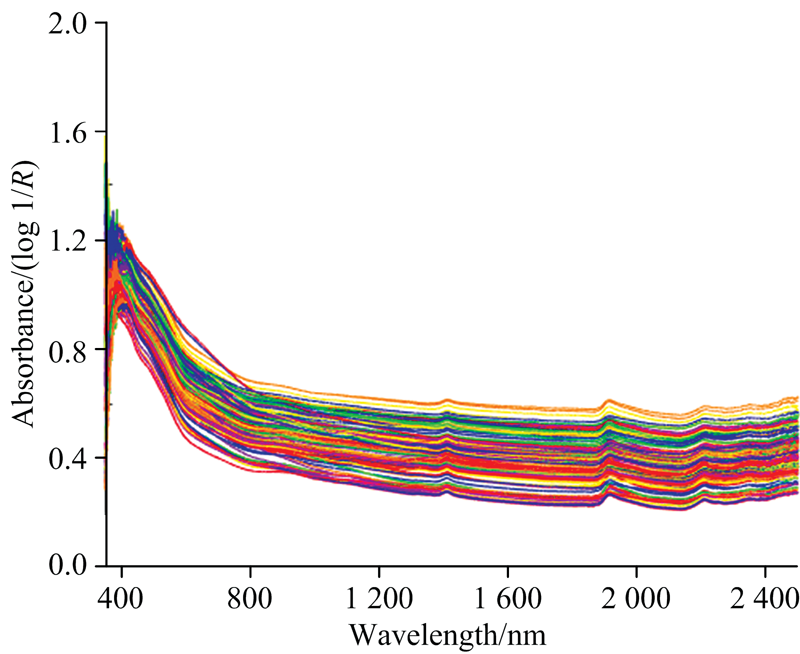 | Fig.1 Spectra of all the 140 soil samples |
2.1.1 Characteristic Wavelength Extraction
Successive projections algorithm(SPA) is a common and effective method of extracting characteristic wavelengths. This method uses projection analysis of vectors to select effective wavelengths with minimum redundancy and minimum collinearity[13]. Since the noise in the initial range of the instrument is generally high[1], the absorbance value in the range of 400~2 500 nm is selected as the research object in this paper.
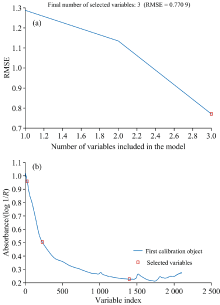
The root means square error (RMSE) distribution curve obtained by extracting characteristic wavelength with SPA and the extraction result of characteristic wavelength are shown in Fig.2. The red block in Fig.2 indicates the number and value of selected characteristic wavelength respectively. The extracted characteristic wavelengths are 627, 425, and 1 796 nm in order of importance, of which 627 nm is consistent with Wang’ s two-dimensional spectral extraction results[11], 425 nm is mainly due to the influence of goethite and hematite in soil components[14, 15], and 1 796 nm is affected by the content of lignin in soil[16].
 | Fig.2 The RMSE and characteristic wavelengths distribution curves after SPA |
2.1.2 SOM prediction model
According to the extracted characteristic wavelengths, the absorbance value of characteristic wavelength and the integral absorbance values at characteristic wavelength are used as independent variables for modeling. The SPXY (sample set partitioning based on joint x-y distance) algorithm divides 110 dry samples for modeling and 30 dry samples for prediction. Since only three characteristic wavelengths are extracted in this study, multiple linear regression (MLR) is selected as the modeling method. In addition, MLR has more advantages in the later instrument development for its simple calculation.
The equations fitted by the two methods are as follows, which model (Ⅰ ) is used the absorbance value of characteristic wavelength and model (Ⅱ ) is used the integral absorbance values at a characteristic wavelength. The statistical parameters are shown in Table 1.
| Table 1 Comparison of statistical parameters in wavelength and integration modeling |
Where y represents the SOM content. A627, A452, A1 796 respectively represent the absorbance values of soil samples at the wavelengths of 627, 452 and 1 796 nm.
It can be seen from the statistical parameter table that RP is increased and RMSEP is reduced when the absorbance integral value at characteristic wavelength is taken as the independent variable. Sousing the integral value as an independent variable can make the model more robust.
2.2 Analysis of spectral prediction results of wet soil
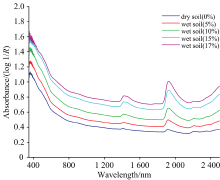
The average spectra of 140 wet soil samples with different moisture contents are shown in Fig.3. It can be seen from the figure that with the increase of soil moisture, the absorption peaks that appear near the water-sensitive bands of 1 415, 1 929, and 2 210 nm are quite obvious, which is consistent with the research results of Wang[11].
 | Fig.3 Average spectra of wet soil samples with different moisture content |
2.2.1 Reconstruction of wet soil spectrum
As soil moisture has obvious absorption peaks around 1 415, 1 929, and 2 210 nm[11], the absorbance values at these three wavelengths construct the soil moisture correction coefficient. The specific algorithm of the correction coefficient is as follows:
Where MCC represents the moisture correction coefficient, A2 210, A1 929 and A1 415 respectively represent the absorbance values of the wet soil samples at the wavelengths of 2 210, 1 929, and 1 415 nm,
Reconstruct the spectrum of wet soil using the following formula:
Where RWSλ is absorbance values at wavelength λ of samples with different moisture content after correction; WSλ and DSλ are the absorbance values of wet soil and dry soil under corresponding wavelength λ , andnis the number of samples.
The reconstructed spectral curves are shown in Fig.4(a)— (d) (taking the organic matter content of 32.57 g· kg-1 as an example). It can be seen that the peak value of the reconstructed spectra in the water-sensitive band decreases significantly and is closer to the spectral curve of dry soil. In addition, when the moisture content is high (such as 15%, 17%), the correction effect of this method is better than Hu[17]. The results show that this method can solve the influence of different moisture content on the change of soil spectral absorbance.
 | Fig.4 Spectra of reconstructed soil sample in different moisture content (taking the organic matter content of 32.57 g· kg-1 as an example) (a): 5%; (b): 10%; (c): 15%; (d): 17% |
2.2.2 Prediction model and evaluation of wet soil
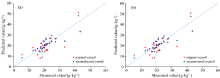
In order to verify the prediction effect of the two models for wet soil samples, the measured and predicted values of organic matter in wet soil were fitted and analyzed (Fig.5). Among them, Fig.5(a) is model Ⅰ , Fig.5(b) is model Ⅱ . In Fig.5, wet soil samples are marked red, and the corrected wet soil samples are marked with blue. The closer the fitting result is to 1∶ 1 (line in the figure), the higher the accuracy of model prediction is, and the related statistical parameters are shown in Table 2.
 | Fig.5 Wavelength modeling (a) and integral modeling (b) comparison of SOM measured and SOM predicted values |
| Table 2 Comparison of prediction model parameters of SOM in wet soil |
It can be seen from Fig.5 that the soil moisture correction algorithm can effectively eliminate the moisture affection on SOM prediction. The RP increased by about 0.08 and RMSEP decreased by about 1.63 g· kg-1 in both model Ⅰ and model Ⅱ . Compared with using the absorbance value at characteristic wavelength as the independent variable, the model established by using the integral value as the independent variable has better correlation (RP) and lower error (RMSEP) for prediction results. It shows that model Ⅱ contains more effective information about the SOM than model Ⅰ .
3 Conclusions
In this paper, the integral absorbance value at characteristic wavelength was used as an independent variable for modeling, and a soil moisture correction coefficient constructed by an integration algorithm was proposed. The main conclusions are as follows:
(1) The spectra of soil samples with different moisture content have clearer moisture absorption peaks than dry soil samples, which will mask the characteristic spectral information of SOM and affect the prediction accuracy of SOM content.
(2) Compared with the traditional characteristic wavelength modeling method, using the integral absorbance value at a characteristic wavelength can cover more effective bands. After verification, the model can be improved to a certain extent by using the integral absorbance value at characteristic wavelength as the independent variable.
(3) Moisture correction coefficient algorithm using the integral idea was proposed, which can obviously eliminate moisture’ s influence.
(4) The combination of integrated modeling method and moisture correction coefficient can effectively eliminate the influence of soil moisture on the prediction of organic matter content, which can be used as the theoretical basis for the establishment of SOM anti-moisture interference model and instrument development.
参考文献
| [1] |
|
| [2] |
|
| [3] |
|
| [4] |
|
| [5] |
|
| [6] |
|
| [7] |
|
| [8] |
|
| [9] |
|
| [10] |
|
| [11] |
|
| [12] |
|
| [13] |
|
| [14] |
|
| [15] |
|
| [16] |
|
| [17] |
|