基于高光谱的工夫红茶发酵品质程度判别方法
[杨崇山1, 2  , 董春旺
, 董春旺2, * , 江用文2 , 安霆1, 2 , 赵岩1, * ]
, 董春旺, 江用文]
|
|


发酵作为影响红茶品质形成的重要流程, 发酵品质程度的判断主要基于人工经验, 难以实现准确客观的评价。 该研究主要针对于工夫红茶发酵工序, 以不同发酵时序下的样品为对象, 利用高光谱检测技术并结合化学计量学方法, 对制备的不同发酵程度的样本进行无损检测和智能判别。 首先利用高光谱成像仪(400~1 000 nm)采集工夫红茶发酵样品的高光谱数据, 并根据气温、 茶叶嫩度、 萎凋情况、 揉捻过程、 发酵叶颜色及香气等现场生产信息, 将6个不同发酵时序下的样本, 根据发酵程度依次划分为3类(轻度发酵、 适度发酵、 过度发酵)。 为了降低采集高光谱信息时因培养皿中发酵叶的不平整而产生的散射现象对光谱数据的影响, 选取标准正态变量变换算法(standard normal variate, SNV)与多元散射校正算法(multiplicative scatter correction, MSC)对全波段光谱进行预处理, 将预处理后的光谱数据进行主成分分析(principal components analysis, PCA), 分别得到前3个主成分的三维载荷图, 根据样本在图中的空间分布特征, 因而选择效果较好的SNV预处理方法。 以全波段光谱最优主成分作为模型输入量, 建立邻近算法(K-nearest neighbor, KNN)、 随机森林(random forests, RF)、 极限学习机(extreme learning machine, ELM)判别模型, 识别率分别为63.89%, 94.44%和86.11%, 结果表明, 非线性模型(RF、 ELM)识别率较高, 其中RF模型性能优于ELM模型。 为比较基于全波段与特征波长建立的工夫红茶发酵品质程度模型判别效果, 采用连续投影算法(successive projections algorithm, SPA)提取31个特征波长进行PCA降维处理, 以特征波长最优主成分作为模型输入量, 构建SPA-KNN, SPA-RF和SPA-ELM判别模型, 识别率分别为83.33%, 91.67%和91.67%。 通过SPA对变量筛选后, SPA-KNN和SPA-ELM模型性能明显提高, SPA-RF模型识别准确度略有下降。 与特征波长建立的模型相比, 全波段建立的RF模型性能最佳, 对工夫红茶轻度发酵、 适度发酵、 过度发酵的判别率分别达到了100%, 83.33%和83.33%。 研究结果为推进红茶智能化、 数字化加工的实现, 提供了理论基础和科学依据。
YANG Chong-shan, (1995—), Postgraduate of School of Mechanical and Electrical Engineering, Shihezi University e-mail:1029345485@qq.com
Fermentation is a crucial process that affects the quality of black tea. The quality of fermentation is mainly judged on artificial experience, hence making it difficult to accomplish an accurate and objective evaluation. The objective of this study is to investigate the fermentation quality of Congou at different times and temperatures using non-destructive techniques and intelligent discrimination methods (chemometrics). For this purpose, different congou fermentation samples were prepared at different fermentation timings. Thereafter, these samples under went testing by hyperspectral detection technology and chemometrics methods. First, the hyperspectral imager (400~1 000 nm) was used to collect the hyperspectral data of Congou fermentation samples. Next, according to the on-site production information, such as temperature, tea tenderness, withering condition, rolling process, fermentation leaf color, aroma, and so on, six different fermentation samples under different time series were divided into three categories according to the degree of fermentation (light, moderate, and excessive fermentation). Standard normal variate (SNV) and multiple scatter correction (MSC) were selected to preprocess the full-band spectrum.Principal components analysis (PCA) was applied to the preprocessed spectral data to obtain the three-dimensional load maps of the first three principal components (PCs). Thereafter, a better SNV preprocessing method was selected according to the spatial distribution characteristics of the samples in the map. The k-nearest neighbor (KNN), random forests (RF), and extreme learning machine (ELM) discriminant models were established by using the optimal PCs of the full-band spectrum as the model input.The recognition rates of KNN, RF, and ELM were 63.89%, 94.44%, and 86.11%, respectively. The results showed that the recognition rate of the non-linear model (RF, ELM) was higher, and the performance of the RF model was better than that of the ELM model. 31 characteristic wavelengths were extracted by successive projections algorithm (SPA) for PCA dimension reduction.The SPA-KNN, SPA-RF and SPA-ELM discriminant models were constructed, and their recognition rates were 83.33%, 91.67%, and 91.67%, respectively. After the variables were screened by SPA, the performances of SPA-KNN and SPA-ELM models were found to be significantly improved, and the recognition accuracy of the SPA-RF model was slightly decreased. As compared with the model established by the characteristic wavelength, the RF model established in the whole band showed the best performance, and the discrimination rates of light fermentation, moderate fermentation and excessive fermentation of Congoureached at 100%, 83.33%, and 83.33%, respectively. The research results provided a theoretical and scientific basis for advancing the realization of intelligent and digital processing of black tea.
Consumers widely seek black tea because of its good taste; the presence of several functional components such as phenols, amino acids, soluble sugar, and so on; and its rapid and increased production[1]. According to the latest data released by the National Bureau of Statistics of China, China’ s black tea industry continues to maintain a trend of steady growth. In 2018, the output of black tea reached 233 300 tons, which showed an increase of 50.7% from 2013 and an increase of 251.9% from 2008. Fermentation is the oxidation-reduction reaction of polyphenols, mainly comprising catechins, to form o-quinones, which are further polymerized to form diflavanols, and finally oxidized to tea pigments such as theaflavins and thearubigins, which determine the quality and flavor of the black tea[2]. At present, the quality of black tea fermentation at home and abroad is mainly judged on the experience of the teamaker, which is highly subjective and can easily lead to the inconsistent quality of the finished tea. To accurately determine the quality of black tea fermentation, it is necessary to use latest equipment and continuous physical and chemical testing of key quality indicators. Obviously, the artificial method by the teamaker cannot quickly perceive the quality information of black tea fermentation and cannot meet the needs of the industrial production of black tea. Therefore, it is particularly important to seek an effective rapid non-destructive testing method to distinguish the different fermentation qualities of black tea.
At present, hyperspectral technology has attracted widespread attention because of its rapid, comprehensive and accurate advantages. At the same time, it also had remarkable achievements in the quality detection, quality grade determination and origin traceability of agricultural products. Huang Yuping et al.[3] established a partial least squares-discriminant analysis (PLS-DA) model to distinguish the quality grades of tomatoes based on the collected spectral information of tomatoes, and found the recognition rate to be 95%. Liu et al.[4] proposed a band subset recognition method based on the neighborhood rough set theory with the best discrimination ability by using five different preprocessing methods and three band selection algorithms. The extreme learning machine (ELM) and random forests (RF) models were constructed to identify the thermal damage of imported soybean, and the classification reached an accuracy of 100%. Tian et al.[5] used hyperspectral data combined with the principal component analysis (PCA), pseudocolor image conversion technology and improved watershed segmentation algorithm to identify the rotten citrus fruits, and determined the recognition rate as 94%. Yuan et al.[6] created two disease indexes through hyperspectral data— tea anthracnose ratio index and tea anthracnose normalized index— and developed a combination of unsupervised classification and adaptive two-dimensional threshold treatment strategies to detect tea tree anthracnose. Farahmand Babellahi et al.[7] used the preprocessed hyperspectral data to establish a PLS-DA model for the online classification of fresh fruits and refrigerated fruits. Ruben Van de Vijver et al.[8] established PLS-DA and support vector machine models for the classification of diseased plants and non-diseased plants by collecting the hyperspectral images of potato plants infected by Agrobacterium tumefaciens and healthy plants.
There are a few related studies on the hyperspectral imaging technology in tea processing, and most of them focus on determining the changes in the water content during tea withering[9]. The objective of this study is to explore and identify the fermentation quality of Congou by other non-destructive testing techniques, such as electrical characteristics, the hyperspectral information of black tea samples at different fermentation times, as well as establish a discrimination model. A prediction model with high precision and strong generalization was selected by comparing the prediction results of the models, which provided the theoretical and scientific basis for the development of an internet-based non-destructive testing and intelligent monitoring system for measuring the quality of fermentation.
The tea samples selected in this study were picked from a plantation located in Shengzhou City, Zhejiang Province. The raw materials of the fresh tea leaves belonged to the varieties of Tieguanyin, with the tenderness was one bud and one leaf. The processing conditions of withering, rolling, and fermentation were similar for all the leaves. The fermentation experiment was conducted in an artificial climate box. For this experiment, the fermentation temperature was kept at 30 ℃, and the relative humidity was set at 90%. The fermentation time of black tea was generally 3~4 hours. The fermentation time was extended to 5 hours, so that the range of the sample set covers all the stages of black tea fermentation[10]. The black tea fermented leaves stacked in the area were divided into three layers, with each of them having a thickness of 5 cm.
The experiment was conducted on September 15, 2019 in the Processing Building of Tea Research Institute, Chinese Academy of Agricultural Sciences. After 12 hours of natural withering, the moisture content was determined as 61% according to the results of the moisture analyzer (the average of three measurements). The rolling process was conducted as follows: empty rolling for 15 min → light rolling for 10 min → heavy rolling for 5 min → light rolling for 5 min → heavy rolling for 5 min → light rolling for 5 min, with a total of 45 min. When the leaves were fermented in an artificial climate box for 4 hours, the color of the fermented leaves basically changed to reddish-yellow. Additionally, their aroma changed from grassy aroma to fresh aroma. In summary, based on empirical judgment, 0~3 h of time was adjudged as mild fermentation (the label was 1), 4h was adjudged as moderate fermentation (the label was 2), and 5h was adjudged as excessive fermentation (the label was 3).
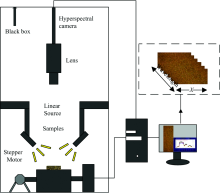
The hyperspectral image acquisition system mainly included an imaging spectrometer (ImSpector, V10E, Finland), a set of 150-W optical fiber halogen lamps (DC-950A, Dolan-Jenner, Co., USA), and a set of high precision conveying devices (Zhuoli Hanguang, SC300-1A, Beijing) along with other components. Figure 1 shows a schematic diagram of the structure. The (20± 0.5) g of fermented leaves were weighed on an electronic scale as a sample and were evenly spread in a quartz culture dish with the size of ϕ 70 mm× 10 mm. The stacking thickness was 15 mm, and the top of samples was flushed with the upper surface of the dish. Then, the hyperspectral image was collected. The sampling interval was 1 h each time, and a hyperspectral image was collected in the upper, middle, and lower layers, respectively. Importantly, a rectangular hyperspectral image containing 300× 300 pixels was used as the region of interest (ROI). Each image selected eight ROIs; four each on the left and the right sides, which were symmetrically distributed. The average value of spectra in ROI was calculated, and eight spectra were extracted from each layer. As a result, 144 spectra were obtained.
 | Fig.1 Schematic diagram of the structure of the hyperspectral acquisition system |
The spectra obtained by the hyperspectral lens used in the experiment were in the visible and near-infrared band (400~1 000 nm), and had a resolution of 2.8 nm and a selected sampling interval of 0.67 nm. Before collecting the prepared black tea fermentation samples, the machine was turned on to preheat the samples for 30 minutes to obtain a clearer image. After many debugging tests, the final selected exposure time was 4 ms, the sample conveying speed was 1.25 mm· s-1, and the distance between the sample and the lens was 18 cm. The black and white corrections of the collected hyperspectral image were conducted according to the following formula (1).
In formula (1), Ic represents the spectrum data after correcting the original spectrum, Rr represent the initial spectral data, Rd represent the calibration spectrum with a reflectivity of 0% under the lens hood, Rw represents a calibration spectrum with white calibration, whose reflectivity was close to 99.9%, and DN represents the highest value of light intensity (DN=4 095)[11], The subsequent data extraction and analysis were completed in ENVI 5.3 and MATLAB 2019a.
PCA is a method that reduces the dimensionality of the data sets and converts multiple features into a smaller number of main features without losing the main features of the spectrum[12]. As a variable selection algorithm, the SPA can eliminate redundant data in hyperspectral information and obtain effective characteristic wavelengths. In constructing the model, the interactive verification method was used to optimize the model, and the different PCs obtained after PCA processing were used as the input values of the model. Based on KNN, RF and ELM modeling methods, the full-band model and characteristic wavelength model were established. Next, the prediction results were analyzed and compared. Finally, the best model was determined according to the discrimination results.
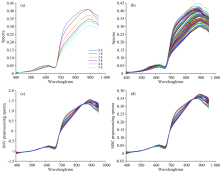
Figure 2 (a) shows the hyperspectral curve of a group of black tea fermentation samples (0~5 h). The absorption peak and reflection valley can be clearly observed through the spectral. The absorbance of the sample at 670 nm decreases, whereas the absorbance of the sample at 900 nm increases. Due to the changes in its surface color and endoplasmic composition during fermentation, the average spectrum of black tea fermentation samples at different times exhibit obvious differences. In the collection of hyperspectral data, the unevenness of the fermented leaves in the petri dish will cause scattering, thereby resulting in inaccurate spectral information[13]. SNV and MSC preprocessing methods were used to reduce the effects of noise in the original spectrum, correct the spectral difference caused by scattering, and reduce the effects of interference information. The spectral curves before and after correction are shown in Fig.2 (b), (c) and (d).
 | Fig.2 (a) The spectral curves of a group of fermented leaves of Congou; (b) Original spectral curves of fermented leaves of Congou; (c) The spectral curve of fermented leaves of Congou after SNV pretreatment; (d) Spectral curve of fermented leaves of Congou after MSC pretreatment (d) |
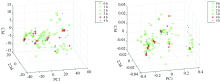
The original spectra of Congou fermented leaves were pretreated with the SNV and MSC methods, and were then analyzed by PCA. Figure 3(a) shows the three-dimensional load distribution diagram obtained after pretreatment with the SNV method. Its PC1 contribution rate was 86.42%, and the PC2 and PC3 values were 8.35% and 3.85%, respectively. Figure 3(b) shows the three-dimensional load distribution diagram obtained after pretreatment with the MSC method. The contribution rate of PC1 was 99.24%, and the PC2 and PC3 values were 0.35% and 0.20%, respectively. From the coordinate axis scale of the three-dimensional load diagram, it can be observed that the sample distribution area at different fermentation times after being pretreated by the MSC method was dense, and there were overlapping areas. Furthermore, it can also be observed from the sample distribution trend that the distribution of moderate fermentation and over fermentation samples after SNV pretreatment was concentrated, and the sample distribution areas at different fermentation times were also different; however, some areas were still crossing each other. Therefore, further model identification was needed to distinguish the black tea samples with different degrees of fermentation. The PC1 contribution rate reached 99.24% after preprocessing by the MSC method, which was not conducive to determining the best model results according to the number of different PCs; therefore, the SNV method was selected for preprocessing the spectral data[14].
 | Fig.3 (a) Three-dimensional load diagram of the first three principal components obtained after SNV pretreatment; (b) Three-dimensional load diagram of the first three principal components obtained after MSC pretreatment |
The Kennard-Stone (K-S) method was used to divide the 144 black tea fermentation sample data sets, wherein there were 108 training set and 36 prediction set samples.
2.3.1 Discriminant analysis based on the full-band model
(1) Discrimination results of the KNN model
The KNN discriminant model was established under different PC numbers and K parameters based on the full-band spectrum[15]. When k=1 and the numbers of PC was 4, the performance of the KNN model was the best, and the recognition accuracies of training and prediction sets were 81.48% and 63.89%, respectively.
(2) Discrimination results of the RF model
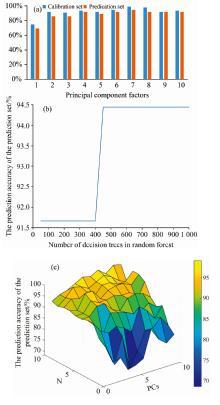
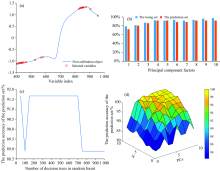
Figure 4(a) shows the recognition effect of the RF model under different PC numbers. As shown in the figure, when the number of PC was 7, the RF model had the best performance, and the recognition accuracies of the training and prediction sets were 99.07% and 94.44%, respectively[16]. Figure 4(b) shows the optimization result of the decision tree within the selected range of the RF model when the number of PC was 7. When the decision tree was between 450 and 1 000, the RF model achieved the best recognition rate.
 | Fig.4 (a) The discrimination result of the fermentation quality degree of the RF model established by the whole band; (b) The impact of different decision tree numbers on the model in the RF model; (c) The evaluation results of the ELM model established by the full-band on the fermentation quality |
(3) Discrimination results of ELM model
As a machine learning algorithm established by the feed-forward neural network, the ELM algorithm showed a good generalization[17]. PC information was extracted from the spectral data by PCA, and then fed into the ELM model with the sigmoid function as the activation function to discriminate the samples of different fermentation degrees. The number of hidden layers (N) and the number of different PCs were used as the input of the model. Because different numbers of N and PCs will affect the prediction performance of the model, 11 N values (0~10, the step size was 1) and 10 PCs numbers (1~10, the step size was 1) were selected for further optimization. It can be seen from Figure 4(c) that when the number of PCs was 9 and N was 10, the model had the best recognition effect, and the discrimination rates of the training and prediction sets were 87.96% and 86.11%, respectively.
Table 1 shows the discrimination results of KNN, RF and ELM models established in the whole band on the fermentation quality of Congou. As compared with the linear KNN model, the discrimination effects of non-linear RF and ELM models were better, and the recognition rate of the mild fermentation degree of Congou reached 100%. Overall, the RF model showed the best performance.
| Table 1 Judgment results of the fermentation quality of Congou based on different models established in the full-band |
2.3.2 Discriminant analysis of the characteristic wavelength model based on SPA selection
SPA was used to extract characteristic wavelengths from the full-band spectral data. Finally, 31 characteristic wavelengths were obtained for the discrimination analysis of fermentation quality of Congou. Their distribution is shown in Fig.5 (a).
 | Fig.5 (a) Distribution of characteristic wavelengths on the curve; (b) The discrimination result of the SPA-RF model based on the effect of characteristic wavelength on the fermentation quality; (c) The effect of different decision tree numbers on the SPA-RF model; (d) The identification of fermentation quality by the SPA-ELM model based on the characteristic wavelength |
The 31 characteristic wavelengths underwent pretreatment with the SNV method, and were then analyzed by PCA. Finally, the SPA-KNN, SPA-RF and SPA-ELM discrimination models were established by using the different numbers of PC factors.
(1) Discrimination results of the SPA-KNN model
The SPA-KNN discriminant model was established under different PCs and K parameters based on the characteristic wavelength. When k=5 and the number of PCs was 1, the SPA-KNN model showed the best performance, and the recognition accuracies of the training and prediction sets were 85.19% and 83.33%, respectively.
(2) Discrimination results of the SPA-RF model
Figure 5(b) shows the discrimination result of the SPA-RF model. It could be seen from the figure that when the PCs was 4, the performance of SPA-RF model was the best, and the recognition accuracies of the training and prediction sets were 92.59% and 91.67%, respectively. Figure 5(c) shows the optimization results of the internal decision tree in the selected range when the SPA-RF model took the number of four PC factors as the input. When the decision tree was between 150 and 700, the SPA-RF model achieved the best performance.
(3) Discrimination results of the SPA-ELM model
In total, 11 N values (0~10, the step size was 1) and 10 PCs numbers (0~10, the step size was 1) of SPA-ELM model were selected to train the model for determining the optimal parameters. The model results are shown in Figure 5 (d). When the number of PCs was 6 and N was 9, the model showed the best recognition effect. At that time, the discrimination rates of the training and prediction sets were 93.52% and 91.67%, respectively.
Table 2 shows the discrimination results of the SPA-KNN, SPA-RF and SPA-ELM models based on the effects of characteristic wavelengths on black tea fermentation samples. From the table, it could be observed that the performance of non-linear SPA-RF and SPA-ELM models were better than that of the linear SPA-KNN models. In fact, the SPA-RF and SPA-ELM models had the same effect on the overall fermentation quality of Congou. However, for mild fermentation, the SPA-RF model showed a better discrimination effect, and the discrimination rate reached 100%.
| Table 2 Judgment results of fermentation quality of Congou based on different models based on characteristic wavelengths |
2.3.3 Discussion
From the above mentioned results, it could be observed that the hyperspectral information of Congou under different fermentation timings had certain differences.As compared with the models established in the whole band, the recognition rate of the SPA-KNN and SPA-ELM models established by the characteristic wavelength was significantly improved. The recognition rate of the SPA-RF model established by the characteristic wavelength had decreased, and the recognition effect of the RF model established based on the full-band was the best. The samples that led to the misjudgment were mainly concentrated between moderate and excessive fermentations. The following reasons maybe attributed to the above mentioned phenomenon.
(1) Because of the effects of temperature, humidity, time and many other factors during the fermentation of Congou, polyphenols under went a series of enzymatic oxidation reactions. As time progresses, the degree of reaction gradually became smoother as compared to the beginning of the reaction. Therefore, the established model was easy to misjudge within the scope of moderate fermentation and excessive fermentation.
(2) The formation, decomposition and transformation of the main components in black tea fermentation were extremely complex, and the distribution of the key components presented non-linear changes. As compared with the established linear KNN discriminant model, the non-linear RF and ELM discriminant models had better fitting effects and higher calculation capabilities for complexity; therefore, it could better identify the non-linear relationship between the degree of fermentation and the change of material composition.
(3) For the RF model established in the whole band, the discrimination effect of the RF model was better than that of the ELM model. The main reason was that the RF model could handle a large number of input variables, balance errors, and had strong self-learning and correction capabilities. The ELM model served as a feed-forward neural network algorithm that optimized parameters through iteration. However, it might not find the optimal parameters, which resulted in a prediction effect that was not as good as that of the RF model. After the characteristic wavelength was extracted by the SPA, the redundant information of hyperspectral data was eliminated and the performance of the ELM model was improved. As a result, the discrimination effect was equivalent to that of the RF model. The prediction performance of the SPA-RF model based on the characteristic wavelength for the samples without moderate fermentation was decreased. It might be attributed to the fact that the part of the wavelength that reflected the mild fermentation information was missing in the characteristic wavelength, which reduced the diversity of the model system. However, the number of PCs and variables used in the SPA-RF model was greatly reduced. PCA could reduce the data dimension. Less PCs input could reduce the calculation burden and improve the calculation speed. Therefore, the SPA-RF model was more in line with the timeliness requirements of online monitoring in production.
(1) The spectral data of black tea fermentation at six different times were collected by the hyperspectral system. The original spectra were pretreated by the SNV and MSC methods. The changing trend of the spectra after treatment was similar. Then, the PCA analysis was conducted, and the three-dimensional score map of the first three PCs after pretreatment with the SNV and MSC methods was obtained. According to the sample distribution in the figure, the sample distribution trend after SNV pretreatment was more concentrated, and the SNV method was preferred for the original spectrum pretreatment.
(2) To compare the performance of linear and non-linear models, the optimal PCs of the full-band spectrum after PCA processing was used as the model input, and three models, namely KNN, RF and ELM, were established for comparative research. The results showed that the non-linear RF and ELM models were better than the linear KNN model in judging the fermentation quality of Congou; however, the discrimination rate of RF and ELM models for the mild fermentation of black tea reached 100%. Overall, the RF model showed the best performance.
(3) To compare the discriminant effect of the fermentation quality degree model of Congou based on the full-band and the characteristic wavelength, the discriminant models of KNN, RF, ELM, SPA-KNN, SPA-RF and SPA-ELM were established with the optimal number of PCs that were obtained after PCA treatment as the model inputs. The recognition rate of the SPA-KNN and SPA-ELM models for samples with different fermentation quality levels was significantly improved as compared with that of the discriminant model established in the whole band. The SPA-RF model required the number of PCs was 4, which was less than other discriminant models. It also had a better performance as compared with other models. Therefore, it is more suitable for the online detection of fermentation quality of Congou.
| [1] |
|
| [2] |
|
| [3] |
|
| [4] |
|
| [5] |
|
| [6] |
|
| [7] |
|
| [8] |
|
| [9] |
|
| [10] |
|
| [11] |
|
| [12] |
|
| [13] |
|
| [14] |
|
| [15] |
|
| [16] |
|
| [17] |
|