引用本文
Ömer Söğüt, Betül Demirezen Kara, Gökhan Apaydın, Erhan Cengiz, Aye Kazancı. Examination of Polymeric Azomethine Compounds and Their Transition Metal Complexes by Using XRF and XRD Technique[J]. Spectroscopy and Spectral Analysis, 2020,40(1): 328-332.
Doi:10.3964/j.issn.1000-0593(2020)01-0328-05
Permissions
Doi:10.3964/j.issn.1000-0593(2020)01-0328-05
Copyright©2020, 《光谱学与光谱分析》期刊社
《光谱学与光谱分析》期刊社 所有
Examination of Polymeric Azomethine Compounds and Their Transition Metal Complexes by Using XRF and XRD Technique

Abstract
In this study, the electronic transition properties and structural analysis of the metal complexes (Ni(Ⅱ), Co(Ⅱ), Cu(Ⅱ) and Mn(Ⅱ)) of three different polymer ligands were performed by using XRF and X-ray diffraction (XRD) techniques, respectively. The structural analysis of the polymers and their complexes were performed by XRD technique and some of the polymers were found to be in the face-centred cubic (fcc) structure. In addition, the values of the present K X-ray intensity ratios are significantly greater than the values reported in literature.
Keyword:
XRF; XRD; Polymeric azomethine compounds and transition metal complexes
中图分类号:O657.3
文献标志码:A
Introduction
A Schiff base is a compound with functional group that contains a carbon-nitrogen double bond in which the nitrogen atom connected to an aryl or alkyl group. The common structural feature of these compounds is the azomethine group with a general formula R— HC=N— R. These compounds are an important class of ligands in coordination chemistry and have found extensive applications in various fields of science[1]. Schiff bases have also been shown to exhibit a broad range of biological activities including antifungal, antibacterial, antimalarial, antiproliferative, anti-inflammatory, antiviral, and antipyretic properties. Imine or azomethine groups are present in various natural, naturally derived, and non-natural compounds. The imine group present in such compounds has been shown to be critical to their biological activities. Schiff bases are important compounds owing to their wide range of industrial applications[2]. Transition metal complexes based on Schiff base ligands are very efficient catalysts in both heterogeneous and homogeneous reactions. The activities of these complexes vary depending on the coordination sites, ligands and central metal ions. Analysis of catalytic activity of transition metal complexes in various reactions show that the catalytic activity of transition metal Schiff base complexes shows variations with structure and type of Schiff base ligands present[3]. Polymers are high molecular weight materials formed by binding the chemical bonds with simple molecules called monomers. One of the simplest and easiest methods to obtain information about the electronic properties of an atom or element is to measure Kβ /Kα X-ray intensity ratios using XRF technique. There are several studies in the literature regarding this subject[4, 5, 6, 7, 8, 9, 10, 11]. In 1991, a method for quantitative determination of defects in polymer layers was developed by Sapozhnikova and Chalykh[12] using X-ray microanalysis and scanning electron microscopy. Applicability of X-ray fluorescence spectroscopy as a method to determine thickness and composition of stacks of metal thin films have been investigated by Vrielink et al[13]. The synthesis of a new Cd(Ⅱ )-Ni(Ⅱ ) heterometallic coordination polymer based upon citric acid ligand have been carried aut and the structures of the polymers were investigated by X-ray structure, thermal stability, XPS and the fluorescent measurements[14].
1 Experimental
1.1 Preparation of polymeric metal complexes
Polymer1, polymer2 and polymer3 and their Cu(Ⅱ ), Co(Ⅱ ), Ni(Ⅱ ) and Mn(Ⅲ ) transition metal complexes were synthesized according to the methods used by Catanescu et al[15] (2001) and Jiang et al[16] (2006). In addition, these samples were prepared by Kazancı and the synthesizing methods of polymers are given in detail in earlier article of Kazancı et al[17] and in PhD thesis of Kazancı [18]. In addition, the structure of the polymer ligands and their metal complexes are given in PhD work of Kazancı [18]. Polymer1 was obtained by polymerization of 1, 2-phenylenediamine and terephthaldehyde. While obtained orange colour material is soluble in dimethylformamide and in dimethylsulfoxide, they are insoluble in common organic solvents. Polymer2 was obtained by polymerization 1, 4-phenylenediamine and okzaldehyde. While the obtained polymer2 is very slightly soluble in hot dimethylformamide, it issoluble in other solvents. Polymer3 was obtained by polymerization of 1, 4-fenilendiamin and phthalaldehyde. While obtained polymer3 is soluble in dimethylformamide and dimethylsulfoxide, they are insoluble in other solvents.
1.2 XRF measurement of the polymer and their complex
A 241Am radioisotope source having 50 mCi intensity has emitted 59.543 keV gamma rays have been used to excite the polymer samples. The characteristic X-rays emitted from the target were detected and analysed with an Ultra-LEGe detector with active area of 30 mm2, with thickness of 5 mm, and with polymer window thickness of 0.4 μ m. The measured energy resolution of the detector system was 150 eV at full-width half maximum for the Mn Kα line at 5.9 keV. The output from the preamplifier, with pulse pileup rejection capability, was fed to a multichannel analyser interfaced with a personal computer provided with suitable software for data acquisition and peak analysis. The sample was placed at 45° angles with respect to the direct beam and fluorescent X-rays emitted 90° to the detector. The live time was selected to be 2 000 s for all elements. All the samples were measured at least three times and the averages of these measurements were taken to minimize statistical errors[10]. The detail of the experimental procedure is given in earlier article in Sö
where NKα and NKβ are counts observed under the peaks corresponding to Kα and Kβ X-rays, respectively, ε Kα and ε Kβ are the efficiencies of detector for Kα and Kβ series of X-rays, respectively. G is the geometry factor and I is the intensity of the source. β Kα and β Kβ are the target self-absorption correction factor for both the incident and emitted radiation. The details of the I0Gε values and the self-absorption correction factor are given in our previous reports[7, 8, 11].
1.3 XRD measurement of the polymer samples
XRD is an important technique for studying the structural properties of the materials. The Philips X’ Pert PRO brand, emitting monochromatic CuKα radiation (λ = 0.154 056 nm), calibrated at 40 kV and 30 mA was used to take XRD measurements of samples. XRD measurements in the whole series of the thin films were done at room temperature, 2θ was between 40° and 100° , in step interval was 0.02° , and waiting time was 0.5 s in each step[7]. The characteristic XRD spectra of polymer ligands and metal complexes were taken. These spectra can be found in previous study of M. Sci thesis of Demirezen[19].The X-ray diffraction crystal structure analysis of the polymer complexes of produced with binding Mn, Co, Ni and Cu were made by XRD technique. The polymer complexes give XRD peaks for which are generally crystallized (except for poly3-Ni (Ⅱ )).
2 Results and Discussion
The measured values of Kβ /Kα X-ray intensity ratios of the polymeric metal complexes are given in Table 1. In addition, XRD measurements were carried out. The resulting peaks till 2θ =20° which are composed of their structure of the polymers. But, the observed peaks after 20° are considered to occur owing to metal ions bound to the polymer. All of the polymeric and transition metal ions conducive to XRD peaks were identified to be in the face-centred cubic structure (fcc). 2θ values, interplanar distances (d) and hkl planes obtained from XRD diffraction patterns of polymer1, polymer2 and polymer3. In spite of bonding with the same metal ions to three different polymeric structures such as polymer1, polymer2 and polymer3, the obtained XRD peaks were found to be different from each other. The cause of these differences is thought to be due to the different polymeric structures.
| Table 1 The values of Kβ /Kα X-ray intensity ratios polymeric azomethine compounds and transition metal complexes |
The values of Kβ /Kα X-ray intensity ratios of sample of Poly1-Co(Ⅱ ) were found to be differences 18%, 10.34%, 17.06%, 19%, 21.26% and 19% according to the values reported in literature Ertu
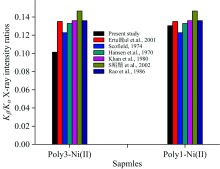
As seen from Figure 1, the value of Kβ /Kα X-ray intensity ratios of Poly3-Ni(Ⅱ ) complex structure are bigger than that of Poly1-Ni(Ⅱ ) complex structure.
 | Fig.1 The comparison of Kβ /Kα X-ray intensity measured in Poly3-Ni(Ⅱ ) and Poly1-Ni(Ⅱ ) complexes and the reported experimental and theoretical values in the literature |
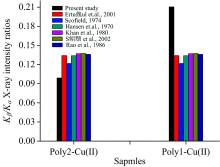
As shown in Figure 2, the value of Kβ /Kα X-ray intensity ratio of Poly2-Cu(Ⅱ ) complex structure was detected to be smaller than that of Poly1-Cu(Ⅱ )complex structure.
 | Fig.2 The comparison of Kβ /Kα X-ray intensity measured in Poly2-Cu(Ⅱ ) and Poly1-Cu(Ⅱ ) complexes and the reported experimental and theoretical values in the literature |
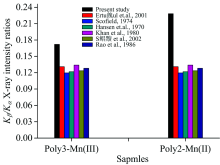
In addition, as seen from Figure 3, the value of Kβ /Kα X-ray intensity ratios of Poly2-Mn(Ⅲ ) complex structure was found to be bigger than that of Poly3-Mn(Ⅲ ) complex structure.
 | Fig.3 The comparison of Kβ /Kα X-ray intensity measured in Poly3-Mn(Ⅲ ) and Poly2-Mn(Ⅱ ) complexes and the reported experimental and theoretical values in the literature |
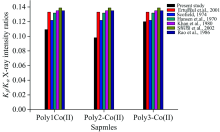
Finally, as seen from Figure 4, while the value of Kβ /Kα X-ray intensity ratios of poly2-Co(Ⅱ ) complex structure are smaller than that of Poly1-Co(Ⅱ ), the value of Kβ /Kα X-ray intensity ratios of poly1-Co(Ⅱ ) complex structure was detected having smaller than that of Poly3-Co(Ⅱ ) complex structure.
 | Fig.4 The comparison of Kβ /Kα X-ray intensity measured in Poly2-Co(Ⅱ ) and Poly3-Co(Ⅱ ) complexes and the reported experimental and theoretical values in the literature |
The measured Kβ /Kα X-ray intensity ratios are also different because Kβ /Kα X-ray intensity ratios measured elements are connected to the polymer having different structure. The reason for this may be increase or decrease the particularly Kβ X-rays transitions probabilities by change of factors such as the number of ligands, bond length and structure, coordination number in complex structure together with variation of the complex structure of the polymer. This change is affected most Kβ X-rays because Kβ X-rays generally consist of transitions from the outer shells to the inner shells. This variation has a special name that called chemical effects. In other words, the reason for these changes can also be chemical effects on Kβ /Kα X-ray intensity ratios. If an element attend to the chemical compounds, it may be displayed the differences in wavelength, intensity and shape of the line of the emitted X-rays by elements. While these differences increase the emission probability of Kβ X-rays, the emission probability of Kα X-rays may decrease. However, contrary to this event can be also measured. The chemical effects on Kβ /Kα X-ray intensity ratios basically may be connected to the change in the binding energy of the electrons that Auger event may cause. However, 3d elements are more sensitive to the chemical structure because of partially filled valence orbitals and unpaired d electrons. They have the multi-valency feature to be the outer electron shells of these elements too close together. The average bond length of a molecule varies according to valency. The change of the bond length will be effective in the shape of the molecular orbitals and in the bonding energies of molecular orbital electrons. This change in the binding energy will also be changed emission probability of Auger electrons and X-ray. The uncertainty in experimental measurements is estimated to be about 6% or less.
参考文献
| [1] |
|
| [2] |
|
| [3] |
|
| [4] |
|
| [5] |
|
| [6] |
|
| [7] |
|
| [8] |
|
| [9] |
|
| [10] |
|
| [11] |
|
| [12] |
|
| [13] |
|
| [14] |
|
| [15] |
|
| [16] |
|
| [17] |
|
| [18] |
|
| [19] |
|
| [20] |
|
| [21] |
|
| [22] |
|
| [23] |
|
| [24] |
|