

基于光谱吸收特征的土壤重金属反演及吸附机理研究
[王惠敏1, 2  , 谭琨
, 谭琨1, 2, 3, * , 武复宇1, 2 , 陈宇1, 2 , 陈力菡1, 2 ]
, 谭琨, 武复宇|
|


土壤中的重金属含量较少, 难以在光谱曲线上表现出明显的特征, 现有的土壤重金属反演实验多是通过统计的方法寻找重金属的敏感波段, 不能准确解释土壤重金属的反演机理, 难以建立土壤重金属反演的普适性模型, 通过分析铁锰氧化物、 有机质、 粘土矿物在土壤光谱曲线上的吸收特征, 深入研究了土壤重金属对可见光近红外光谱的影响, 分析了褐土中的重金属反演机理。 以徐州试验田为例, 共采集80个土壤样本。 首先, 利用ASD地物光谱仪测定土壤样本的光谱反射率, 并采用电感耦合等离子体质谱仪检测土壤样品中的Cr, Cd, Cu, Pb和Zn的含量。 然后, 土壤光谱经过包络线去除处理, 与重金属相关的吸收峰在480, 1 780和2 200 nm附近, 所显现的吸收峰主要受土壤中的铁锰氧化物、 有机质、 粘土矿物的影响。 在吸收峰位置提取了光谱吸收特征的四个参数: Depth480, Depth1 780, Depth2 200和Area2 200, 分析了它们随五种重金属含量变化的增减趋势, 发现四个参数数值与五种重金属含量有很强的相关性。 分析单个变量反演重金属发现, 参数Depth480反演Cr和Pb的效果较好, 参数Area2 200, Depth1 780反演Cd, Cu和Zn的效果比较好。 同时使用四个光谱吸收特征参数, 利用最小二乘法、 岭回归法、 支持向量回归法求取回归系数, 建立的五种重金属含量的反演模型比使用单变量建立的反演模型预测能力强且稳定, 五种重金属Cr, Cd, Cu, Pb和Zn反演效果最好的验证集决定系数分别是0.71, 0.84, 0.92, 0.80, 0.89。 结果表明, 在此研究区域Cr和Pb容易被铁锰氧化物吸附, 而Cd, Cu和Zn更容易被有机质、 粘土矿物吸附。 此研究为探究土壤光谱特征与土壤重金属含量之间的关系提供了参考。
Biography: WANG Hui-min, (1994—), NASG Key Laboratory of Land Environment and Disaster Monitoring, China University of Mining and Technology e-mail: wanghm9423@126.com
Heavy metals are scarce in soil, and it is difficult to identify their obvious characteristics in the soil spectrum. The previous soil heavy metal estimation methods have mostly applied statistical methods to find the characteristic bands, which cannot accurately explain the retrieval mechanism. It is therefore difficult to establish a universal model for soil heavy metal estimation. In order to investigate the influence of soil heavy metals in visible and near-infrared spectroscopy and analyze the retrieval mechanism of soil heavy metals, it is necessary to study the absorption characteristics of iron/manganese oxides, organic matter, clay minerals, etc. In this study, 80 soil samples were collected from the experimental field at Xuzhou, China. The spectra of the soil samples were measured with an Analytical Spectral Devices (ASD) field spectrometer. The soil heavy metal contents (Cr, Cd, Cu, Pb, and Zn) were determined by inductively coupled plasma-mass spectrometry. The soil spectra were processed by continuum removal. The absorption peaks related to heavy metals were around 480, 1 780, and 2 200 nm, which can be mainly attributed to iron/manganese oxides, organic matter, and clay minerals in the soil. The four spectral absorption characteristic parameters of Depth480, Depth1 780, Depth2 200, and Area2 200 were extracted at the positions of the absorption peaks. The variation trends of the parameters, along with the contents of the five heavy metals, were then analyzed. It was found that the four parameters were strongly correlated with the contents of the five heavy metals. Using a single variable to estimate the heavy metals, it was found that Depth480 had a higher estimation accuracy for Cr and Pb, and Area2 200 and Depth1 780 had a higher estimation accuracy for Cd, Cu, and Zn. The four spectral absorption characteristic parameters were implemented as independent variables, and the regression coefficients were obtained by ordinary least squares, ridge regression, and support vector regression. The heavy metal estimation model using the four spectral absorption characteristic parameters was stronger and more stable than those using only a single parameter. The best
Heavy metal ions in farmland soils can be absorbed and enriched by crops, and can thus become a threat to human health. It is therefore vital to obtain the heavy metal concentrations in soil. In recent years, many scholars have done a lot of work in estimating soil heavy metals by remote sensing. The characteristic bands are extracted by analyzing the soil hyperspectral data and combining this with physicochemical characteristics data to establish an estimation model for the heavy metals in soil. However, the composition of soil is complex. The soil spectrum is affected by organic matter, iron oxides, and clay minerals, so it is difficult to show the obvious spectral absorption features of heavy metals. Statistical analysis is always used to select the characteristic bands for soil heavy metals. First of all, spectra pre-treatment techniques such as the first-order differential, the second-order differential[1], the reciprocal logarithm[2], and continuum removal are applied, and the characteristic bands are then selected by correlation analysis or feature selection algorithm[3]. Shi et al.[4] found that 480, 600, 670, 810, 1 980, 2 050, and 2 290 nm in soil spectrum are important bands for estimating As in soil. Xu et al.[2] found that the characteristic bands for Cr, As, and Cu are 379, 1 778, and 2 018 nm, respectively. The characteristic bands of heavy metals found in different studies are quite different, due to the inconsistency of soil physical and chemical properties and the mechanism of heavy metal adsorption.
Therefore, researchers have also tried to explain the relationship between soil heavy metals and soil spectra from the retrieval mechanism. Wang et al.[5] showed that the estimation accuracy of heavy metals (Pb, Zn, Cu) in agricultural soils of different crop types in Yixing, Jiangsu province, was affected by soil organic matter. Xu et al.[6] analyzed the soil of different historical periods and found that Cd, Cu, and Ni were mostly affected by iron oxides, clay minerals, and organic matter. In addition, Cr was found to be influenced by many factors, and Pb by iron oxides and clay minerals. It is therefore necessary to study the adsorption of heavy metals by iron/manganese oxides, organic matter, and clay minerals in the cinnamon soil of the Xuzhou area.
Spectral absorption characteristic parameters have achieved good performances in mineral mapping[7], soil water content prediction[8], etc. However, this approach has seldom been used in soil heavy metal estimation. Choe et al.[9] found that R610, 500, Asym2 200, and Area2 200 had statistically significant relationships with stream sediment concentrations of Pb, Zn, and As, respectively. Jin et al.[10] estimated the Cd content of Inner Mongolia chestnut soil using the depth of the band, and they found that the predictive ability of this model was superior to that of other models using the spectral reflectance or the reciprocal logarithm.
In this study, we selected the cinnamon soil of Xuzhou in China as the research object, and analyzed the relationship between the spectral absorption characteristic parameters and the heavy metal concentrations. The heavy metals were estimated by using the spectral absorption parameters to explore the retrieval and adsorption mechanism of heavy metals in soil, which provided a reference to establish a universal model for soil heavy metal estimation.
The study area was the remote sensing experimental field (34° 13'N, 117° 08'E) near the north gate of Nanhu Campus of the China University of Mining and Technology, Xuzhou city, Jiangsu province, China. The soil type of the study area is cinnamon soil. The climate of Xuzhou is a warm temperate continental monsoon climate, with four distinct seasons and abundant sunshine. The average annual temperature is 14 ℃, and the average annual rainfall is 800~930 mm. The precipitation in the rainy season accounts for 56% of the whole year.
Four areas of 12.0× 11.8 m2, 11.8× 11.8 m2, 11.8× 11.6 m2, and 11.6× 11.6 m2 were trimmed of vegetation in the experimental field, and 10 soil samples were selected evenly from each area by the “ plum blossom” sampling method. The four areas included three areas where Cr, Pb, and Zn had been artificially added, respectively, and one normal control area. Plexiglass columns with a diameter of 20 cm and a depth of 20 cm (bottom sealed) were inserted vertically into the soil using a shovel. In October 2013, 30.8 g of chromium(Ⅲ ) chloride hexahydrate, 8.3 g of lead acetate trihydrate, and 16.5 g of zinc sulfate heptahydrate were added to the plexiglass column bottom of the first, second, and third areas, respectively. After this date, no further heavy metals were artificially added. In October 2013 and October 2015, 13— 15 winter wheat seeds of the same type were sown in each plexiglass column. In July 2014 and July 2016, after the wheat had matured, about 1 kg of surface soil was collected from each sampling point. The soil samples were then sealed, marked, and brought back to the laboratory.
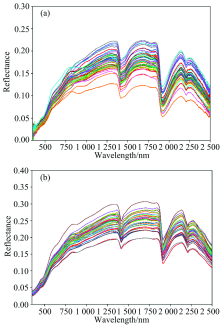
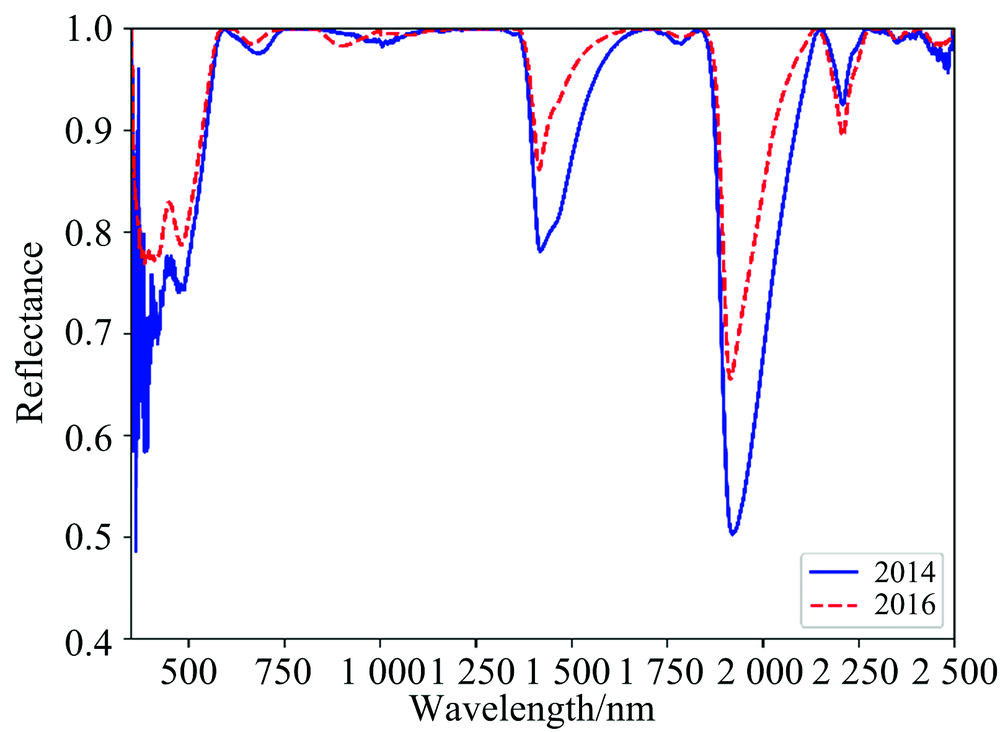
Each soil sample was divided into two parts. One part was used to measure the soil reflectance spectra, and the other part was utilized to measure the soil heavy metal concentrations. Before measuring the soil spectra, the samples needed to be dried and ground to pass through a 100-mesh aperture nylon sieve. The soil samples were scanned in the darkroom using a FieldSpec3 Hi-Res Analytical Spectral Devices (ASD) field spectrometer. The instrument covers the 350~2 500 nm range, including 2 151 bands. The soil samples were placed in petri dishes with black velvet underneath to avoid interference from other reflectors. After using a spectralon diffuse reflectance panel to calibrate the reflectance, we collected the spectral data with a contact probe. Each soil sample was scanned 10 times. After removing the abnormal spectra, the average spectrum was taken as the final reflectance spectrum of the soil sample. The spectral curves of the two-stage (i.e., July 2014 and July 2016) soil samples had the same characteristics: at 350~700 nm, where the slope of the spectral curve was steep, there was a weak absorption peak at 480 nm. The spectra rose slowly over 700~1 400 nm. There was then a weak water absorption band at 940 nm. The regions around 1 400 and 1 900 nm were also strongly related to water absorption. The curve began to decrease from 2 200 nm, and there was a distinct absorption peak around 2 200 nm. The results showed that the values of the spectra for the 2016 samples were higher than those from 2014.
 | Fig.1 Spectral curves of the two-stage soil samples |
The heavy metals (Cr, Cd, Cu, Pb, and Zn) of the soil samples were detected by inductively coupled plasma-mass spectrometry (ICP-MS). A basic statistical analysis of the heavy metal concentrations of the two-stage soil samples is provided in Table 1. The contents of the five heavy metals in 2016 were significantly higher than those in 2014. According to the experimental design, the heavy metal compounds at the bottom of the plexiglass column slowly migrated up through the soil in the plexiglass column. In 2014, the migration of the heavy metals was not significant. However, by 2016, the heavy metals had migrated upwards and transformed in the soil, which resulted in a sharp increase of the heavy metals in the topsoil (the soil samples collected were topsoil).
| Table 1 Statistical results of the soil heavy metal contents in 2014 and 2016 |
In order to effectively highlight the absorption characteristics of the spectral curves, the soil sample spectra for 2014 and 2016 were processed by continuum removal (CR). Fig.2 shows the average spectra for 2014 and 2016 after CR, where it can be seen that there are several obvious absorption bands, namely, 480, 730, 940, 1 130, 1 400, 1 780, 1 900, and 2 200 nm. Among them, 940, 1 130, 1 400, and 1 900 nm are water absorption bands. Based on the previously published papers[4, 9], the absorption bands with a higher correlation with heavy metal content are 480, 1 780, and 2 200 nm.
 | Fig.2 Average spectra for 2014 and 2016 after continuum removal |
In the visible region, the spectral absorption features are mainly due to the electronic transition of metal ions (such as Fe2+, Fe3+, Mn3+, etc.). The spectral absorption feature of iron/manganese oxides is 480 nm. In the near-infrared range, the absorption characteristics of the soil spectrum are mainly the double frequency and harmonic frequency generated by the molecular bending vibration of molecular groups (C— H, Al— OH, Mg— OH, Fe— OH, C
Based on CR, a number of spectral absorption parameters have been developed, including absorption depth (Depth), absorption width (Width), absorption area (Area), and asymmetry (Asym). In this study, we used the absorption peak depths of 480 nm (Depth480), 1 780 nm (Depth1 780), 2 200 nm (Depth2 200), and the absorption area of 2 200 nm (Area2 200) to estimate the soil heavy metal concentrations.
1.4.1 Calibration set and validation set
According to the heavy metal content, the 80 soil samples were divided into several groups, with three samples in each group. For each group, two soil samples were selected as training samples (calibration set), and the remaining one was used as the prediction sample (validation set). The sample ratio of the calibration set and validation set was thus 2:1.
1.4.2 Model establishment
Three linear regression methods were used to establish the estimation models between the spectral absorption characteristic parameters and the soil heavy metals. The linear regression methods were least squares (LS), ridge regression (RR), and support vector regression (SVR).
LS is an important parameter estimation method in the linear regression models. The solution process of LS is divided into the following steps. In the first place, the function of the residual squared sum is constructed, and then the method of finding the extremum in differential calculus is used to construct the condition in which the sum of the residuals reaches a minimum. We then obtain the partial derivative function for the parameter estimator and make it equal to zero, thus obtaining the linear equations with respect to the parameter estimator. The LS estimator is obtained by solving the linear equations. If the residual of the linear regression model is ei, the aim of LS is to make
RR is a biased estimation model for collinear data analysis. It improves the singularity of the coefficient matrix of the normal equations, which LS is unable to dispose of when estimating the regression coefficients. The matrix (X'X) determinant is relatively small when there is multiple collinearity between the independent variables, and thus the derived data lack stability. RR adds a normal data matrix Ki(0< k< 1, I is the identity matrix) in the sample data matrix to improve the stability of the result[12].
SVR is an excellent machine learning algorithm based on the Vapnik-Chervonenkis (VC) dimension theory of statistical learning and the principle of structural risk minimization. It performs well in dealing with high-dimensional and small-sample data. The common kernel functions are the linear kernel function, polynomial kernel function, and gaussian kernel function. In order to explain the relationship between the parameters and heavy metal contents, SVR with a linear kernel function was utilized in this study.
1.4.3 Model validation
The models were evaluated with the determination coefficient (R2), the root-mean-square error (RMSE), the mean absolute error (MAE), the residual prediction deviation (RPD), and the ratio of prediction performance to interquartile range (RPIQ). The higher the R2 value is, the more stable the model is. The lower the RMSE is, the higher the RPD and the RPIQ are, and the better the prediction performance of the model is.
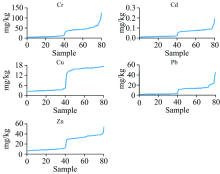
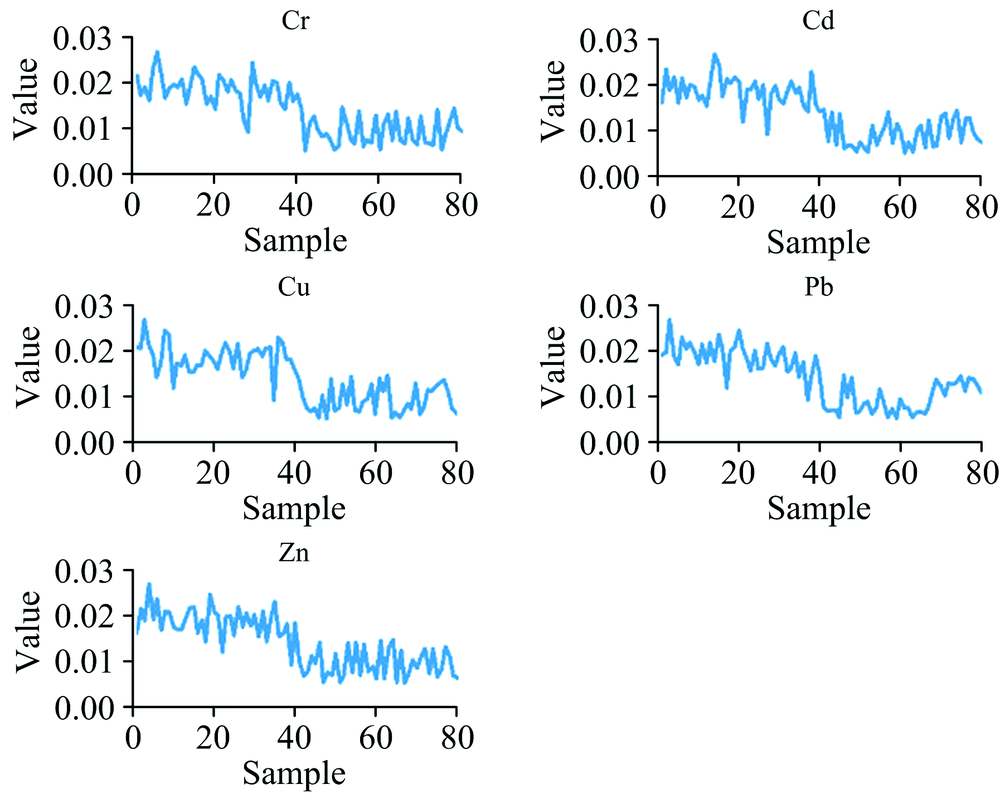
The two-stage data of the five heavy metals (Cr, Cd, Cu, Pb and Zn) were arranged according to their contents. The absorption depths of 480, 1 780, and 2 200 nm were then investigated. Fig.3 shows the contents of the five heavy metals, of which the first 40 samples and the last 40 were from 2014 and 2016, respectively.
 | Fig.3 The contents of the five heavy metals in 2014 and 2016 |
In Fig.3, it can be seen that the heavy metal contents are close in each year. However, the comparison between the two-stage data shows that the contents of the five heavy metals in 2016 are significantly higher than those in 2014, especially for Cr, Pb, and Zn, which were added artificially.
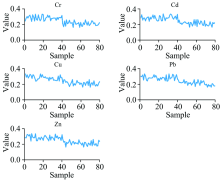
The variation trends of the three absorption peaks, along with the heavy metal contents, were analyzed. The effect of iron/manganese oxides on the five heavy metals is shown in Fig.4. The Depth480 parameter becomes smaller with the increase of the heavy metal content. This regularity is not obvious over a small range, but it is clearly visible when the difference in the heavy metal content is large, especially at the junction of the two stages.
 | Fig.4 Depth480 parameters of the five heavy metals |
It can be seen from Fig.5 that the variation trend of Depth1 780 is more pronounced than that of Depth480. When the heavy metal content significantly increases, its value decreases. For Pb, the variation trend of Depth1 780 is not as straightforward as that of the other four heavy metals. According to Goldschmidt geochemical classification of chemical elements, Pb is a siderophile element. Consequently, Pb has a higher correlation with Depth480 than with Depth1 780.
 | Fig.5 Depth1 780 parameters of the five heavy metals |
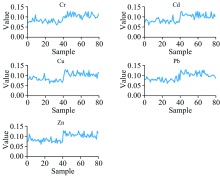
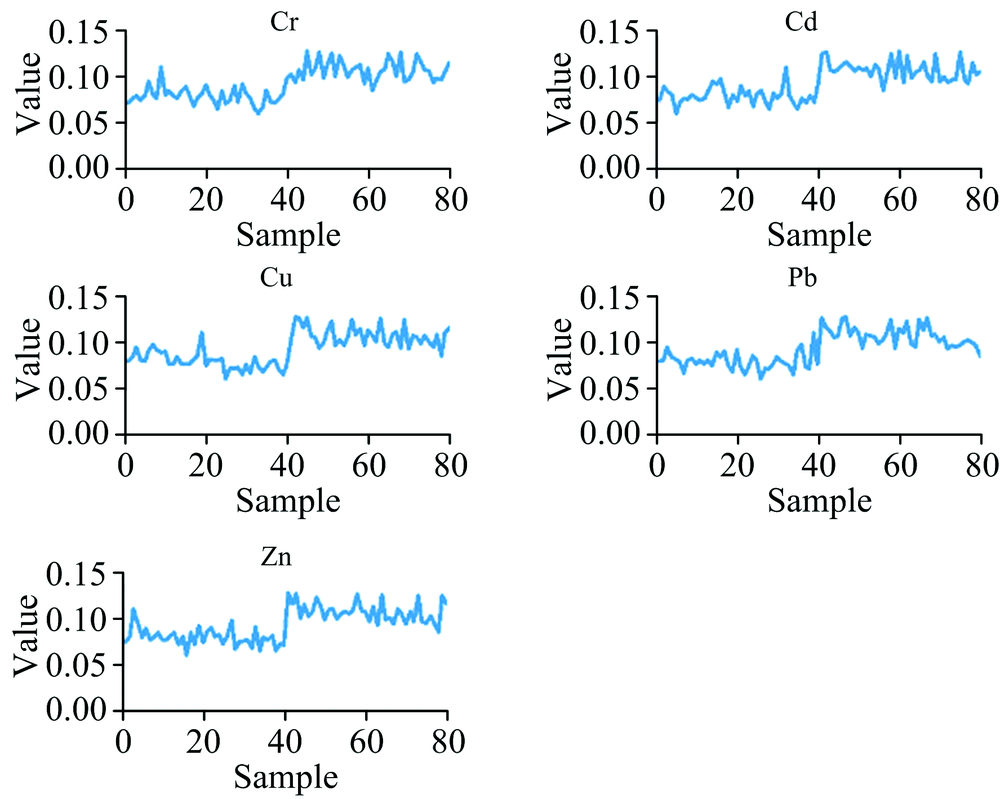 | Fig.6 Depth2 200 parameters of the five heavy metals |
Depth2 200 shows an opposite variation tendency compared with the two former parameters. With the increase of the heavy metal content, the value of Depth2 200 increases. The Depth2 200 value of Cd, Cu, and Zn increases significantly at the junction of the two stages, indicating that these three metals have a higher correlation with organic matter and clay minerals.
The correlation coefficients between the four spectral absorption characteristic parameters and Cu/Zn are higher (Table 2). The correlation coefficients of Pb and Depth480 are significantly higher than those of the other three parameters, which shows that Pb is more easily adsorbed by iron/manganese oxides.
| Table 2 Correlation coefficients between heavy metals and spectral absorption characteristic parameters |
Linear regression models were established between the soil heavy metal concentrations and the two soil spectral absorption characteristic parameters that had the highest correlation with each heavy metal. The regression coefficients were calculated using LS. The models and model evaluation are shown in Table 3. It is found that Depth480 has a higher estimation accuracy for Cr and Pb, indicating that the adsorption effect of the iron/manganese oxides for Cr and Pb is greater than that of organic matter and clay minerals. The accuracy of estimating Cd, Cu, and Zn by Area2 200 and Depth1 780 is higher. These three heavy metals belong to the sulfophilic elements, and Cu in soil mainly exists as an organic-bound state. Therefore, for Cd, Cu, and Zn, the adsorption capacity of organic matter and clay minerals is higher than that of iron/manganese oxides.
| Table 3 Results of the linear regression between soil heavy metal contents and single parameters |
In order to enhance the stability of the model and the interpretability of the variables, the four parameters of Depth480, Depth1 780, Depth2 200, and Area2 200 were applied to estimate the soil heavy metals. The regression coefficients were calculated by LS, RR and SVR. The estimated results are shown in Table 4.
| Table 4 Results of the regression between the soil heavy metal contents and the four parameters |
The accuracy of the models using the four spectral absorption characteristic parameters are much better than the results of the models using only a single parameter. The results show that stable heavy metal estimation models can be established by considering the influence of the iron/manganese oxides, organic matter, and clay minerals on soil heavy metal content. Except for Cr, the
In this study, we analyzed the absorption characteristics of the indoor spectra of cinnamon soil from the Xuzhou area of China and its relationship with heavy metals in soil. The results showed that it is feasible to estimate soil heavy metal concentrations using indoor spectral absorption characteristic parameters of the soil.
The four spectral absorption characteristic parameters of Depth480, Depth1 780, Depth2 200, and Area2 200 were strongly correlated with the contents of the five heavy metals. Within a certain range of heavy metal content, the four spectral absorption characteristic parameters fluctuated up and down. However, as the heavy metal contents increased to four to seven times the original level, the parameters showed obvious variation trends. The Depth480 and Depth1 780 parameters decreased with the increase of the heavy metal contents, while Depth2 200 was the opposite. Using a single variable to estimate the heavy metals, it was found that Depth480 had a higher estimation accuracy for Cr and Pb, for which the
| [1] |
|
| [2] |
|
| [3] |
|
| [4] |
|
| [5] |
|
| [6] |
|
| [7] |
|
| [8] |
|
| [9] |
|
| [10] |
|
| [11] |
|
| [12] |
|