引用本文
Ahmed. I. El-Shenawy, Ishaq. F. E. Ahmed, Moamen. S. Refat. Fabrication of Semiconductor Polymer Membranes Combined with a Colored Charge Transfer Complexes Used in the Manufacture of Solar Cells as a Source of Alternative Energy[J]. Spectroscopy and Spectral Analysis, 2019,39(7): 2307-2315.
Doi:10.3964/j.issn.1000-0593(2019)07-2307-09
Permissions
Doi:10.3964/j.issn.1000-0593(2019)07-2307-09
Copyright©2019, 《光谱学与光谱分析》期刊社
《光谱学与光谱分析》期刊社 所有
Fabrication of Semiconductor Polymer Membranes Combined with a Colored Charge Transfer Complexes Used in the Manufacture of Solar Cells as a Source of Alternative Energy

Abstract
The main task of this article was to prepared of new pigment model in situ solar cells accordance to charge-transfer complexes of rhodamine C (RhC) donor as dye laser gain media with iodine (σ-acceptor) and chloranilic acid, CLA (π-acceptor). The synthesis stoichiometry of these complexes were of 1:2 (donor:acceptor) with general formulas [(RhC)]I·I3 and [(RhC)(CLA)2]. The discussed data of elemental analysis, conductivity measurements, FT-IR, UV-Vis spectroscopy and photometric titration data visualized the stoichiometry, formula and complexity of the complexes. The physicochemical and spectroscopic analyses obtained suggested that the electron transfer occurred through nitrogen atom in a tertiary amine —N(C2H5)2 of RhC donor with acceptor. The synthesized solid complexes were under go to thermogravimetric analyses to investigate their thermal stability and decomposition steps. The molar conductance measurements revealed that RhC complexes have an electrolytic statement. The thermal stability of rhodamine C complexes was enhanced in comparable with RhC itself. The polymer membranes of poly-methyl methacrylate) (PMMA) combined with the RhC charge(transfer complexes in chloroform solvent have been prepared and characterized by (infrared & electronic) spectroscopy and scanning electron microscopy (SEM) morphological examination. The photo-stability properties of the RhC complexes have been investigated.
Keyword:
Charge-transfer; Rhodamine C; Photostability; Complexity; Spectroscopic; Polymer; Dye
中图分类号:O47
文献标志码:A


Introduction
Charge-transfer complexity have been important in recent years because of their efficiency in electrical conductivity, magnetic and optical properties[1, 2]. Generally, these type of complexes play an important role in biological systems as well as in the mechanism of drug receptor[3, 4]. The protonation of the donor from the acid acceptors are generally track to form ion pair compound[5, 6]. Rhodamine dyes were used in a widely scale as fluorescent probes for their high absorptivity and broad fluorescence in the visible region of the electromagnetic spectrum, high fluorescence quantum yield and photostability[7, 8]. Due to increasing world demand for energy, limited fossil fuels, and increased concern about environmental protection, the demand for the discovery and use of sustainable clean energy sources has increased in recent decades. Solar energy is most likely to provide energy that is inexhaustible because it is a kind of clean and renewable energy. One of the most promising categories of photovoltaic devices is the dye sensitive solar cells (DSSCs), which are solar cells of the third generation. Recently, intensive research has focused on the development and design of DSSCs to be highly efficient, more cost-effective, and more environmentally friendly[9, 10, 11]. Fluorescent dyes are important as potential polymer membranes for obtaining fluoropolymers[12].
The goal of this work is to synthesis, spectroscopic, thermal stability, and morphological characterizations of two new charge-transfer complexes of rhodamine C fluorescent dye interacted with iodine (σ -acceptor) and chloranilic acid, CLA (π -acceptor). The physical spectroscopic data (KCT, ε max, ECT, f, μ , RN, IP, and Δ G° ), were estimated for each charge-transfer complex in respected solvent at room temperature. Also, prepared and characterize flexible poly-methyl methacrylate) (PMMA) polymer membranes which have an electrical semiconductors behavior as an effective model used as one of the components of environmentally friendly solar cells. These polymer matrix containing RhC fluorescent dye complexes with iodine or chloranilic acid acceptors. The prepared polymer membrane are investigated using spectroscopic and physicochemical analyses such as FTIR and UV-Vis., SEM, photostability and electrical characters. The kinetic thermodynamic parameters (Δ S* , Δ H* , E* , A, and Δ G* ) of RhC charge-transfer complexes were calculated based on the Coats-Redfern methodology.
1 Experimental
1.1 Synthesis
The fluorescent dye rhodamine C [Fig.1(a)], chloranilic acid [Fig.1(b)], and poly-methyl methacrylate) (PMMA) polymer are of pure materials that received from Sigma-Aldrich Chemical Corporation, St. Louis, Mo, USA. The methanol and chloroform solvents were of analytical grade and used without further purifications.

1.2 Synthesis of rhodamine C charge-transfer complexes
At room temperature, the 1 mmol of rhodamine C was mixed in chloroform solvent with iodine acceptor (2 mmol) and were stirred for about 45 min on a magnetic stirrer. The mixture was reduced to a half volume by evaporation in static air within one day. The solid brown residual precipitate was collected then filtered off and washed with minimal amount of chloroform solvent. Finally, the isolated solid product was dried in vacuo over anhydrous calcium chloride. The chloranilic acid charge-transfer reddish brown complex was prepared by the same method but in the presence of methanol solvent. For the [(RhC)]I· I3 (1); Yield 70%, m.p. 67~70 ℃. FT-IR (KBr) cm-1: 3 400 ν (O— H), 3 145 and 2 973 ν (C— H), 1 698 ν (C=O) 1 315 ν (C— H), 1 240 ν (C— N). Analysis: C29H36N2O3I4 (968.23 g· mol-1); Calc. (%): C 35.97, H 3.75, N 2.89. Found (%): C 35.92, H 3.71, N 2.84. Molar conductance: 66 μ S· cm-1. For the [(RhC)(CLA)2] (2); Yield 74%, m.p. 225~230 ℃. FT-IR (KBr) cm-1: 3 430 ν (O— H), 3 020 and 2 975 ν (C— H), 1 710 ν (C=O), 1 304 ν (C— H), 1 186 ν (C— N). Analysis: C40H40Cl4N2O11 (866.56 g· mol-1); Calc. (%): C 55.44, H 3.23, N 4.65. Found (%): C 55.32, H 3.22, N 4.59. Molar conductance: 62 μ S· cm-1.
1.3 Preparation of polymer membrane
The colored RhC charge-transfer complexes of iodine and chloranilic acid in situ of poly (methyl methacrylate) (PMMA) were prepared by dissolved in chloroform with continuously magnetic stirring for 45 min. After that, the homogenous mixtures were poured into a glass petri dish and allowed to dry at room temperature. The carefully formed polymer membranes were taken away from the glass petri dishes and cut into rectangular shapes with roughly equivalent dimensions 3× 1 cm3.
1.4 Instrumentals
The %carbon, %hydrogen and %nitrogen percentages of RhC charge-transfer complexes were calculated using a Perkin Elmer CHN 2400 (USA). Melting points were detected using a MPS10-120 Melting point apparatus. Molar conductivities of the freshly prepared of RhC charge-transfer complexes with 1.0× 10⁻³ mol· cm-3 dimethyl sulfoxide (DMSO) solutions were measured using Jenway 4010 conductivity meter. The UV-Vis. absorption spectra were scanned within 200~800 nm using a Perkin(Elmer Lambda 25 spectrophotometer with 1.0 cm quartz cells. The infrared spectra were recorded on Bruker FTIR Spectrophotometer (4 000~400 cm-1). The thermal studies TG/DTG-50H were carried out on a Shimadzu thermo-gravimetric analyzer under nitrogen till 800 ℃. Scanning electron microscopy (SEM) images were taken in Quanta FEG 250 equipment. The fluorescence spectra have been recorded for polymer membranes using a Shimadzu RF 5031 PC spectrophotometer.
1.5 Photostability
The photodegradation of the polymer membranes that included charge-transfer complexes of RhC dye with different σ - or π -acceptor were investigated based on UV-Vis. absorption spectra with the help of solar simulator xenon arc lamp “ 250 W” . Photostability was calculated by dividing the absorbance after and before exposure to light of xenon arc lamp at different times.
2 Results and discussion
2.1 Micro-analytical and photometric titrations
The RhC charge-transfer complexes of iodine and chloranilic acid were isolated solid form in CHCl3 and CH3OH solvents respectively. These complexes were characterized using micro-analytical analysis, conductance, UV-Vis, FT-IR, TGA and SEM. The elemental analyses data referred that the stoichiometry is 1:2 (donor:acceptor). In case of micro-analytical technique of analysis, the experimental results of %C, %H and %N elements are in good agreement with the theoretical data that reveal to the correct prediction of chemical composition. The molecular formula of these complexes are [(RhC)]I· I3 and [(RhC)(CLA)2]. The spectral data assignments deduced that the complexation take place between nitrogen atoms of the tertiary amine — N(C2H5)2 of RhC dye and acceptors through n→ π * with proton transfer interactions (Fig.2). The thermal analyses outcomes give outline about the stability of prepared complexes. The surface view, grain size and crystallinity of these complexes were checked based on scanning electron microscopy.
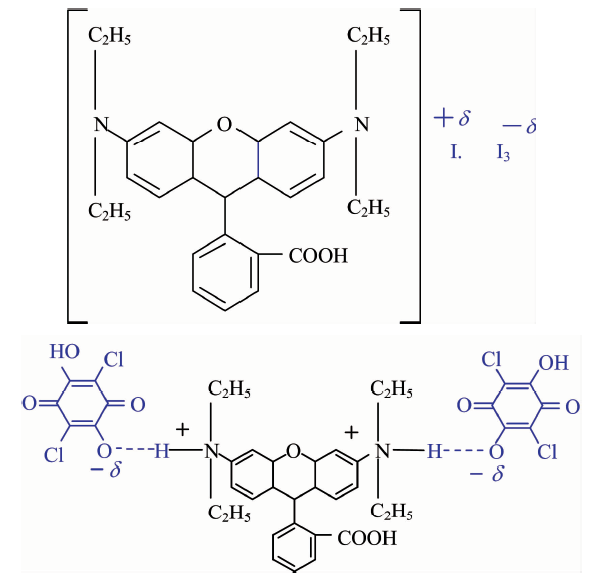 | Fig.2 Speculated structures of [(RhC)]I· I3 (a) and [(RhC)(CLA)2] (b) charge-transfer complexes |
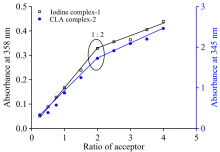
At room temperature, the spectrophotometric titrations between RhC dye (donor) and different acceptors (iodine and chloranilic acid) are operated using molar ratio method in order to identify the stoichiometry between donor and acceptor. A 1.00 mL of 5.0× 10⁻⁴ mol· L-1 RhC dye solution is mixed with various volumes (0.25, 0.5, 0.75, 1.0, 1.5, 2.0, 2.5, 3.0, 3.5, or 4.0 mL) of 5.0× 10⁻⁴ mol· L-1 iodine or CLA acceptor solutions. Then, the acceptor has concentration (Ca) range of 0.25× 10⁻⁴~4.00× 10⁻⁴ mol· L-1, whilst the concentration of the RhC dye (Cd) was kept fixed at 5.0× 10⁻⁴ mol· L-1. The photometric diagrams are designed by plotted between volume added from acceptor (x-axis) and their absorbance (y-axis).
2.2 Molar conductivities of RhC charge-transfer complexes
Molar conductivities of the [(RhC)]I· I3 and [(RhC)(CLA)2] charge-transfer complexes have an electrolytic behavior. The significant values 62 and 66 μ S· cm-1 of the CLA and iodine complexes, respectively, reveal their semi conductance statement[1, 13].
2.3 UV-Vis electronic spectra
The UV-Vis absorption spectra of the 1:2 stoichiometry in (CHCl3 or CH3OH) solvent uogether with the reactants acceptors (I2 and CLA), RhC and ([(RhC)]I· I3 and [(RhC)(CLA)2]) charge-transfer complexes are shown in (Fig.3). The spectra of 1:2 ratio!of RhC: acceptor mixtures show a real absorption bands around λ max (358 and 285 nm) and 345 nm for the [(RhC)]I· I3 and [(RhC)(CLA)2]) charge-transfer complexes, respectively. These bands are absence in the spectra of free reactants, therefore, these bands are assigned to the associated of CT-bands after complexity between RhC donor and acceptors (iodine or CLA). Photometric titration diagrams were performed based on well known method[14] by plotting the different values of absorbance at maximum charge-transfer bands (385 nm for iodine and 345 nm for CLA) against the various volumes (0.25, 0.5, 0.75, 1.0, 1.5, 2.0, 2.5, 3.0, 3.5, or 4.0 mL) of 5.0× 10⁻⁴ mol· L-1 added from acceptors (see Fig.4). In case of [(RhC)]I· I3 charge-transfer complex, the presence of absorption band at around 358 nm is well known[15, 16, 17] to be characteristic band due to the formation of triiodide ion (
 | Fig.3 UV-Vis absorption spectra of RhC donor, CLA acceptor, iodine complex-1, and chloranilic acid complex-2 |
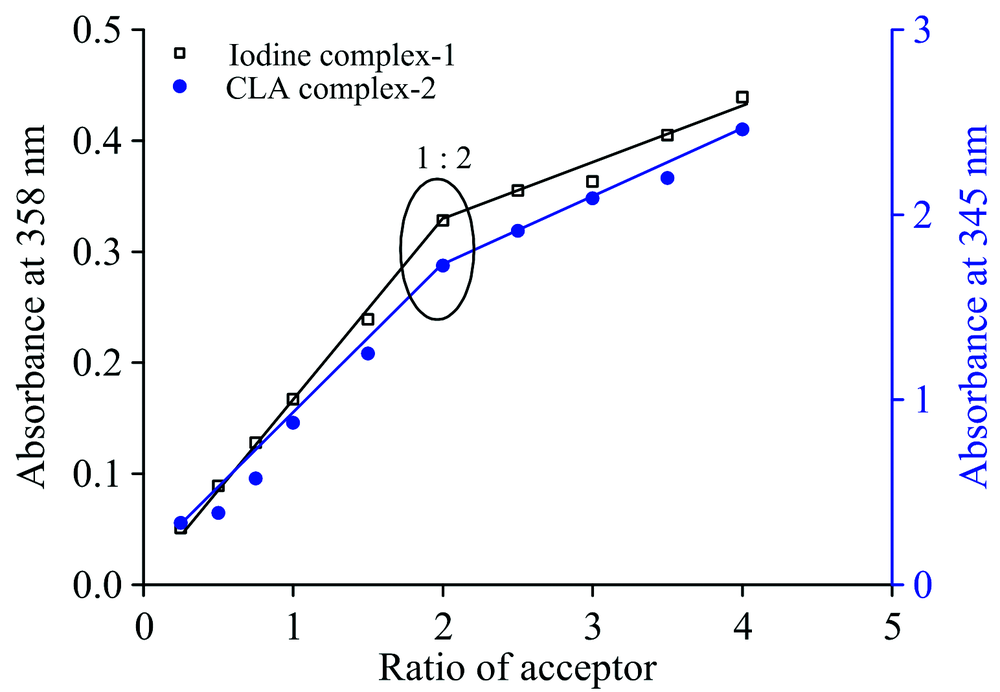 | Fig.4 Photometric titration curves of RhC charge-transfer complexes of iodine and chloranilic acid systems |
where
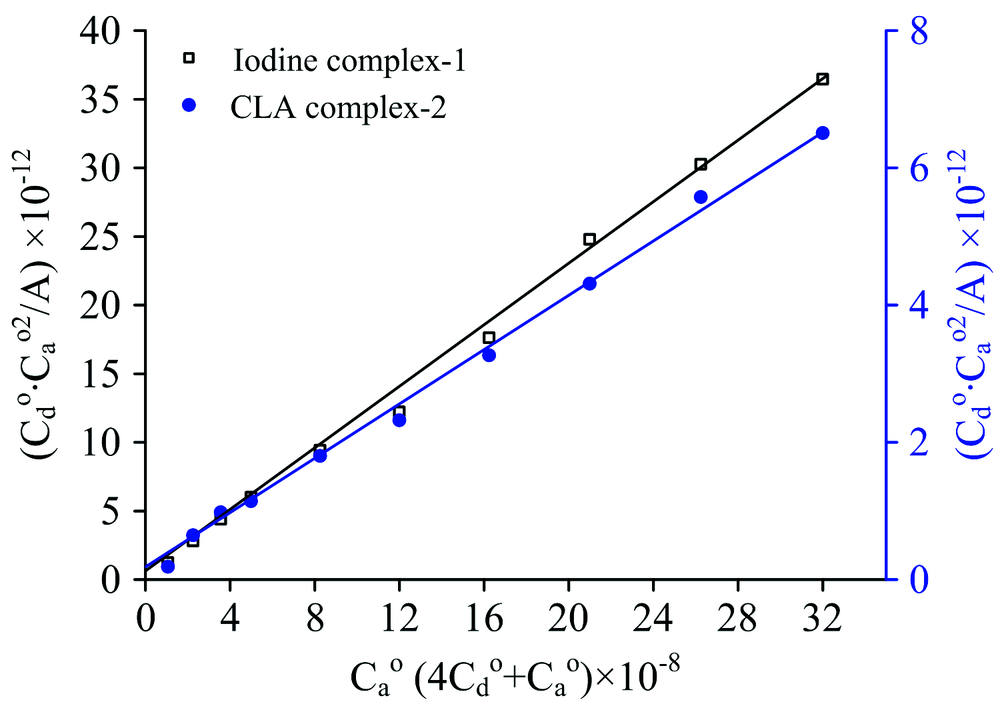 | Fig.5 Plot of ( |
The physical spectroscopic parameters for [(RhC)]I· I3 and [(RhC)(CLA)2] charge-transfer complexes were calculated based on an official equations:
Molar extinction coefficient (ε max/L· mol-1· cm-1) and formation constant (KCT/L· mol-1):
These parameters were calculated dependent on equation 1.
Energy of interaction (ECT/eV)[19]
ν CT and λ CT are wavenumber and the wavelength of the CT band.
Standard free energy (Δ G° /kJ· mol-1)[20]
T/Kelvin=absolute temperature and R=8.314 J· mol-1· K-1 gas constant.
Transition dipole moment (μ )[21]
Oscillator strength (f)[22]
ν 1/2 cm-1=full width at half the maximum.
Ionization potential (IP/eV)[23]
Resonance energy (RN)[24]
The physical spectroscopic results of RhC charge-transfer complexes are summarized in (Table 1), these data refer to:
High values of KCT within 1.16× 10⁸~1.90× 10⁸ L· mol-1 range reveal to high stability of RhC prepared complexes.
| Table 1 Physical spectroscopic parameters of the RhC charge-transfer complexes of iodine and chloranilic acid systems |
The Δ G° parameter have -ve data, so the charge-transfer interaction between RhC donor and acceptors is spontaneous and increasing the stability of associated complexes[25].
2.4 FTIR spectra
FTIR spectra of solid state of free donor RhC dye and their iodine complex-1 and chloranilic acid complex-2 are shown in (Fig.6) and the assignments of the characteristic infrared spectral bands are summarized in (Table 2).
 | Fig.6 FT-IR spectra of (a): free RhC donor, (b): iodine complex-1, and (c): chloranilic acid complex-2 |
| Table 2 FT-IR assignments of RhC donor, CLA acceptor, iodine complex-1, and chloranilic acid complex-2 |
Mid infrared spectra of [(RhC)]I· I3 and [(RhC)(CLA)2] charge-transfer complexes are display with significant shifts in both frequencies and band intensities for the — NH(C2H5)2 and the aromaticity bands but the characteristic bands ascribe to ν (O— H) and ν (C=O) of carboxylic acid group don’ t affected. These confirm that the charge-transfer complexity take place through n— π * and n— σ * . The shift to lower wavenumber from 1 240 to 1 186 cm-1 for the ν (N— H) stretching vibration band in case of [(RhC)(CLA)2] charge-transfer complex in comparison with free RhC dye, this can be assigned to the sharing of lone pair of electrons on the nitrogen atom of — NH group in the complexation process with CLA acceptor. There are some bands with weak to very weak intensities presence within 2 500~2 800 cm-1 range, these bands are due to hydrogen bonding[26] associated from the protons transfer migration between — NH group (RhC donor) and one of the — OH group of CLA acceptor.
Far infrared spectrum of [(RhC)]I· I3 charge-transfer complex was scanned within range of 50~300 cm-1 as shown in (Fig.7). This spectrum included three distinguish bands (148, 102 and 76 cm-1) which assigned to tri-iodide ion,
 | Fig.7 Far infrared spectrum of [(RhC)]I· I3 complex-1 |
The infrared spectrum of PMMA free polymer membrane has some spectral bands at 3 000~2 800, (1 720 & 1 640), (1 440 & 1 380), 1 235 and (980 & 750) cm-1 which are assigned to vibrations of ν (C— H; CH3 & CH2 groups), ν (C=O), δ def.(CH3), ν (C— O) and δ (CH) out of plane band, respectively. The infrared spectra of polymer membranes included [(RhC)]I· I3 and [(RhC)(CLA)2] charge-transfer complexes are shown in (Fig.8). There are change in the intensities and wavenumbers due to the change the physical statement after incorporated of chloranilic acid charge-transfer complexes with PMMA matrix. The results showed that charge-transfer complexity integrated in the PMMA matrix did not alter the chromophore system.
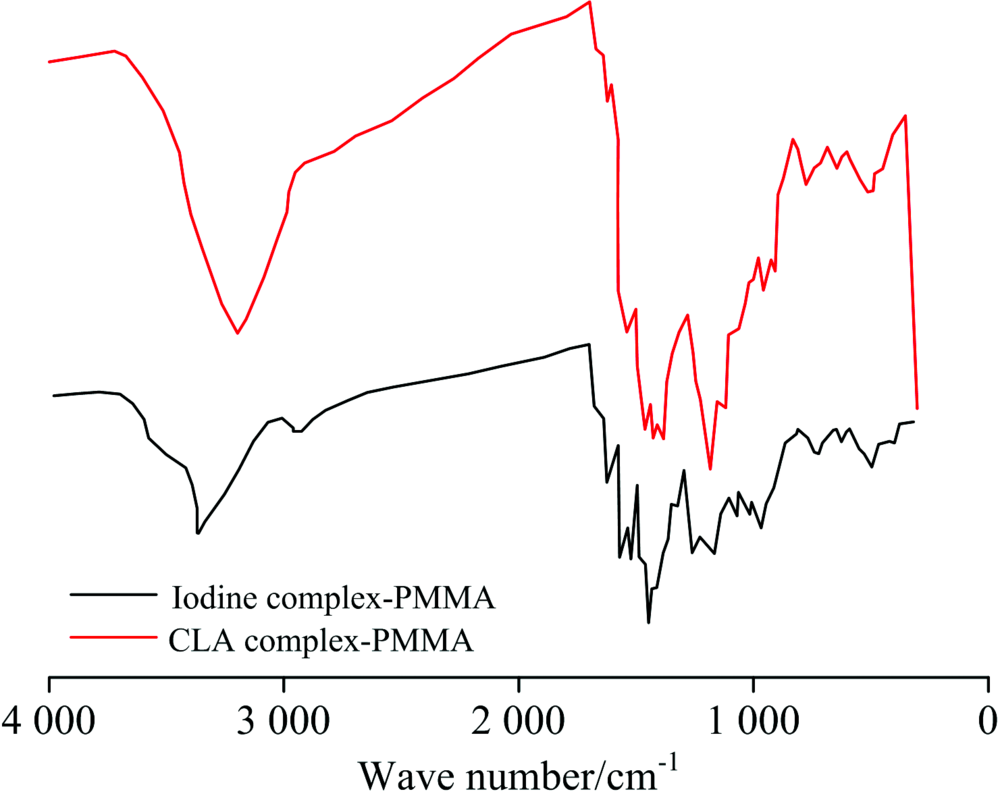 | Fig.8 FTIR spectra of iodine and chloranilic acid charge-transfer complexes doped in PMMA |
2.5 Thermal analyses and kinetic thermodynamic calculations
The thermo gravimetric curves of the free donor RhC dye and their iodine complex-1 and chloranilic acid complex-2 are shown in (Fig.9). The RhC free dye thermally decomposed through three steps at 238 ℃ with mass loss of 10.31% due to loss of COOH group. Second step at DTGmax 334 ℃ with mass loss 25.58% due to loss of four ethyl groups. The last step at 523 ℃ with mass loss of 64.11% due to decomposed organic moiety. The thermal decomposition of the iodine and chloranilic acid charge-transfer complexes pass through one to three decomposition steps. The weight losses of iodine and chloranilic acid complexes are 82% and 94% attributed to the decomposition of two molecules of acceptors and one RhC dye molecule. The polluted carbon atoms are the solid residual product at 800 ℃.
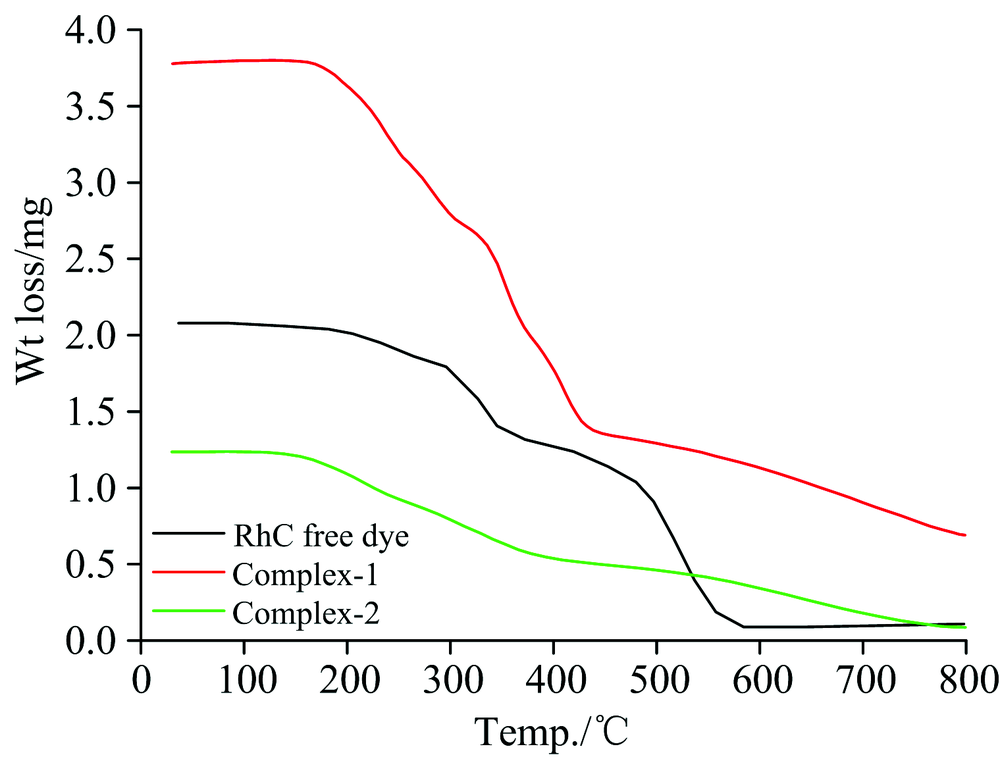 | Fig.9 TG curves of free RhC donor, iodine complex, and chloranilic acid complex |
The kinetic thermodynamic activation parameters (E* , Δ H* , Δ S* , and Δ G* ) of the free donor RhC dye and their iodine complex-1 and chloranilic acid complex-2, were calculated by employing Coats-Redfern relations[29]. The outcome data are listed in (Table 3). The activation energies of decomposition are in the range (98~229) kJ· mol-1. The high values of the activation energy due to the thermal stability of the complexes. The entropy of activation is negative indicate that the activated complexes are more ordered than reactants. The Gibbs free energy Δ G* is positive, therefore the thermal decomposition reactions are non-spontaneously, i.e., the prepared RhC charge-transfer complexes are thermal stable.
| Table 3 Kinetic thermodynamic data of the free RhC dye and their iodine and CLA charge-transfer complexes using the Coats-Redfern method |
2.6 Energy band gap calculations
Energy band gap refereed by symbol Eg, can be calculated depending on variance of electronic absorptions. The Eg parameter was estimated upon the mathematic relationship[30, 31] as follows
Item “ α ” is called absorption coefficient that equal (α =1/dlnA, where A=absorbance and d=width of quartz cell).
Item “ hν ” is photon energy.
Item “ A” is energy independent constant.
Item “ m” is values of 2 or 1/2 for indirect and direct transitions, respectively.
By plotting photon energy (hν ) x-axis against (α hν )1/2y-axis, the energy band gap (Eg) can be graphically calculated[32]. These curves of the RhC charge-transfer complexes incorporated with poly-methyl methacrylate) as a polymer membranes are displayed in (Fig.10). The values of Eg for the polymer membranes of [(RhC)]I· I3 and [(RhC)(CLA)2] complexes are 3.19 and 3.38 eV, respectively, signalize the semi-conducting behavior of the prepared polymer membranes[33].
 | Fig.10 Plots of (α hν )1/2 against hν for the polymer membranes of [(RhC)]I· I3 and [(RhC)(CLA)2] complexes |
2.7 Scanning electron microscopy investigations
Figure 11 refer to the SEM images of the surface morphology of the free RhC dye, [(RhC)]I· I3 and [(RhC)(CLA)2] charge-transfer complexes and their PMMA polymer membranes. When taking a closer look at the surface of the prepared charge-transfer complexes, the surfaces are homogeneous with some particle aggregations on the surface. By comparing the free RhC dye with its complexity, there is a difference in surface physical properties which supports the formation of new composites with different properties from the reactors. By examining polymeric membranes, we find that their surfaces are mostly smooth, with some slight aliasing. It is noticeable homogeneity between poly (methyl methacrylate) and the prepared complexes and the absence of any cracks in the polymeric membranes, which supports the elasticity of the ability to qualify them to facilitate their formation.
 | Fig.11 SEM images (a): RhC free dye; (b): [(RhC)]I· I3 complex; (c): [(RhC)(CLA)2] complex; (d): RhC-PMMA; (e): [(RhC)]I· I3-PMMA; (f): [(RhC)(CLA)2]-PMMA polymer membranes |
2.8 Fluorescence study
The excitation and emission spectra of RhC free dye donor were scanned as shown in (Fig.12). The [(RhC)]I· I3 and [(RhC)(CLA)2] charge-transfer complexes make quenching for the fluorescence intensity of RhC dye in the liquid state (Fig.13). This quenching results because of molecular charge-transfer interactions, viz. excited-state reactions, molecular rearrangement, energy-transfer and ground state complexity.
 | Fig.12 Excitation and emission spectra of RhC free dye donor |
 | Fig.13 Fluorescence spectra of free RhC dye donor and their iodine (complex-1) and CLA (complex-2) charge-transfer complexes |
2.9 Photostability assessment
The photodegradation of [(RhC)]I· I3 and [(RhC)(CLA)2] charge-transfer complexes integrated in poly-methyl methacrylate) using xenon arc lamp as an optical radiation powerful source at different irradiation time (30, 60, 90, 120 and 150 min) (Fig.14). By investigation of UV(Vis absorption spectra of polymer membranes of RhC charge-transfer complexes, it was found that chemical properties of RhC dye molecule do not surrender any wide changes. The photostability behavior is due to charge-transfer complexity of RhC dye with iodine or chloranilic acid acceptors. The rate constants of the photo degradation of the RhC dyes were calculated dependent on the following equation[34].
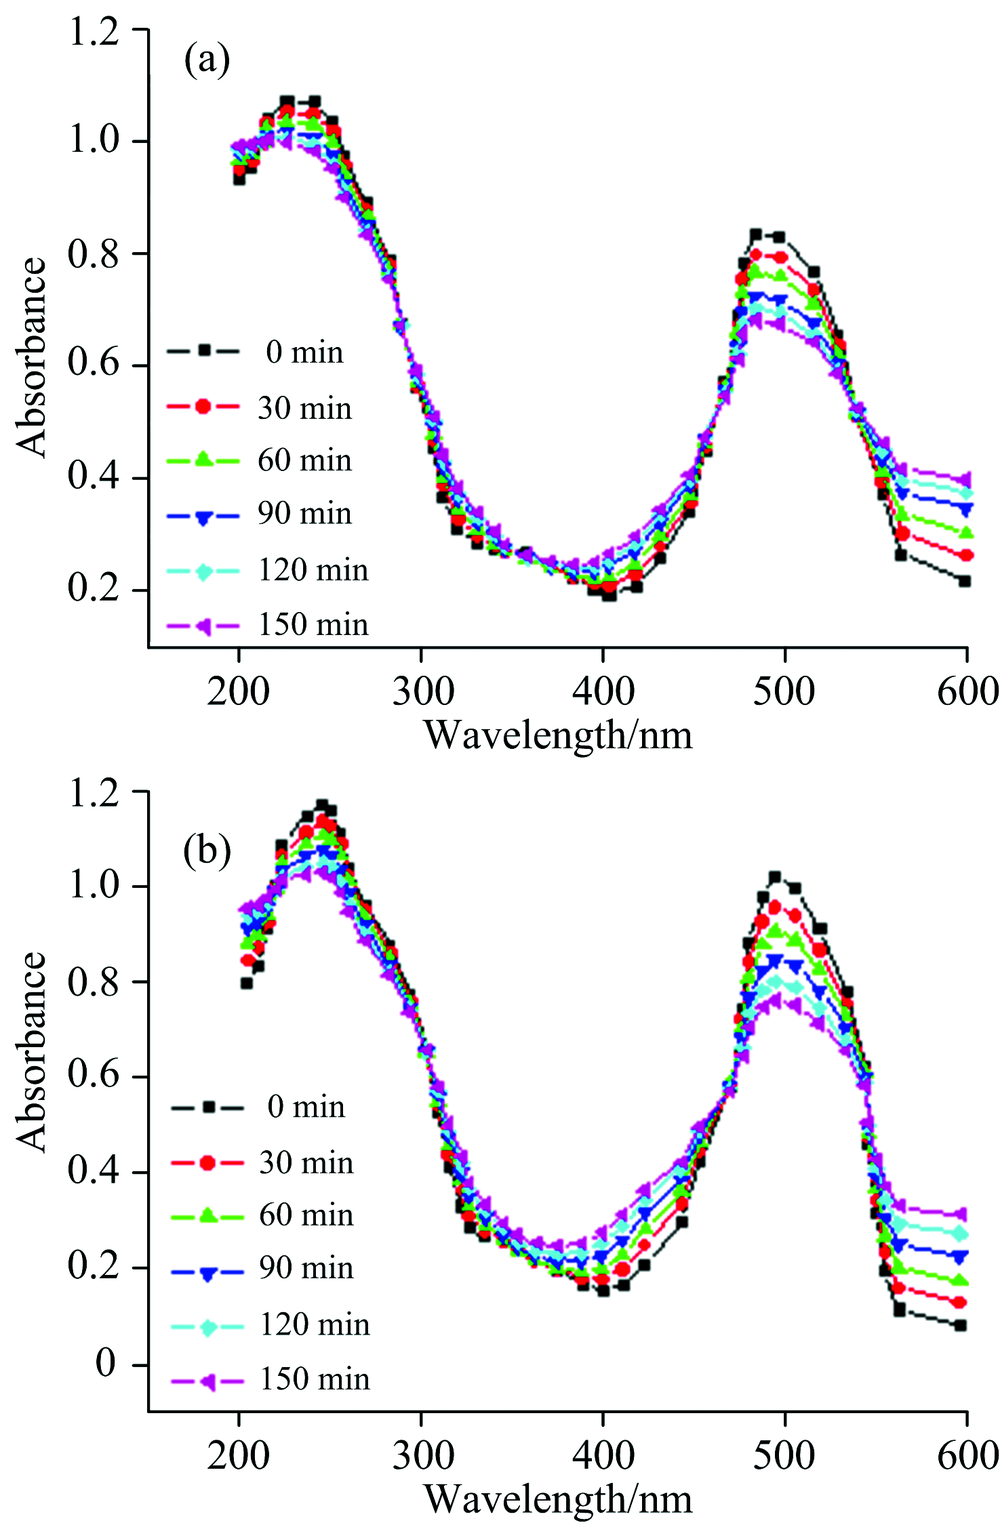 | Fig.14 Photostability of [(RhC)]I· I3 (a) and [(RhC)(CLA)2] (b) charge-transfer complexes integrated in PMMA after irradiation during various time |
where A0 & A are the absorption before and after irradiation during various time (t). The k v and half life time results are listed in (Table 4). After charge-transfer complexation, the photostability of the dye was affected[35].
| Table 4 Rate constants (k) and half-life times of [(RhC)]I· I3(PMMA and [(RhC)(CLA)2]-PMMA polymer membranes through photo degradation process |
参考文献
| [1] |
|
| [2] |
|
| [3] |
|
| [4] |
|
| [5] |
|
| [6] |
|
| [7] |
|
| [8] |
|
| [9] |
|
| [10] |
|
| [11] |
|
| [12] |
|
| [13] |
|
| [14] |
|
| [15] |
|
| [16] |
|
| [17] |
|
| [18] |
|
| [19] |
|
| [20] |
|
| [21] |
|
| [22] |
|
| [23] |
|
| [24] |
|
| [25] |
|
| [26] |
|
| [27] |
|
| [28] |
|
| [29] |
|
| [30] |
|
| [31] |
|
| [32] |
|
| [33] |
|
| [34] |
|
| [35] |
|