
S/B和DS算法校正土壤水分对土壤有机质近红外光谱预测的影响
[王世芳1, 2, 3  , 韩平
, 韩平1, 3, * , 宋海燕2, * , 梁刚1, 3 , 程旭2 ]
, 韩平, 宋海燕, 梁刚|
|


土壤水分对近红外光谱表现出强烈的吸收和对土壤有机质含量的预测造成干扰。 研究选择41个样本作为校正集和9个样本作为预测集, 所有样本做不同含水率(5%, 10%, 15%和17%)的处理。 采用S/B和DS算法分别对预测结果和全光谱进行校正, 消除土壤水分的影响。 结果得出预测结果偏差减小和模型预测性能得到改善, Rp高于0.89和RMSEP低于0.885%。 研究表明S/B和DS算法能有效消除土壤水分的影响和提高土壤有机质预测的准确性。
Biography:WANG Shi-fang,(1989—),Master,Beijing Research Center for Agriculture Standards and Testing, E-mail wangshifang1302@126.com
Soil moisture has strong absorption in near infrared spectroscopy (NIRS) and causes interference in the prediction of the soil organic matter (SOM) content. In this paper, 41 dry soil samples were used to establish the SOM calibration model by PLSR, and 9 samples were used as the prediction set. All soil samples were rewetted to four different moisture contents (5%, 10%, 15% and 17%). The slope/bias (S/B) and direct standardization (DS) algorithms were used to correct SOM prediction results and whole-spectra obtained by different moisture content, eliminating the differences caused by soil moisture. The results showed that the bias reduced and prediction performances of the model were improved, with Rp higher than 0.89 and RMSEP lower than 0.885%. The study indicated that S/B and DS algorithm corrections could effectively remove the influence of soil moisture in NIRS and improve the accuracy of SOM predictions.
Near infrared spectroscopy (NIRS) for soil samples has many research applications, mainly the analysis of soil moisture and soil organic matter (SOM) in recent studies. Both soil moisture and SOM have a significant influence on the reflectance spectra[1]. However, several parameters are known to affect SOM detection and the precision of NIRS analyses, such as soil moisture[2, 3, 4, 5], soil matrix, surface roughness, voids, temperature, sample homogeneity, and particle size, which may mask or alter the absorption features of SOM. Soil moisture is one of the most important sources of error, especially because soil moisture shows strong absorption at two characteristic bands (1 930 and 1 450 nm) in the NIRS region. The absorption bands of water and SOM overlap, so soil moisture may mask the characteristic band of SOM and hinder the detection of SOM content.
Environmental factors, such as the amount of water, ambient light, and temperature, cause differences in NIRS detection. To eliminate the influence of environmental factors and improve the accuracy of detection, model transfer has been applied to NIRS analyses.Model transfer algorithms mainly include the transfer of standard samples and non-standard samples. Model transfer algorithms of standard samples, such as external parameter orthogonalization (EPO)[5], direct standardization (DS)[2, 6, 7], piecewise direct standardization (PDS)[7, 8, 9, 10, 11, 12, 13, 14], slope/bias (S/B) correction[15, 16], and orthogonal signal correction (OSC)[15], can eliminate the influence of environmental factors. In previous studies, the effectiveness of these five approaches, i.e., EPO, DS, global moisture modelling (GMM), S/B, and selective wavelength modelling (SWM), was compared as applied to correct the effect of soil moisture to improve the prediction precision of soil organic carbon (OC) and inorganic carbon (IC)[17]. The PDS algorithm was applied to achieve calibration model transfer between the master and slave instruments, and the Rank-Kennard-Stone-PDS method was applied to predict the alkaloid and glycoside content in tobacco[18]. The DS algorithm was used to correct differences among instruments, and the genetic algorithm-DS method was used to improve the model precision and simplify NIRS model development as applied to aviation fuel density[19]. Likewise, finite impulse response (FIR), which is the model transfer algorithm of non-standard samples, can also effectively eliminate the influence of environmental factors. Target soil samples that were calibrated by FIR algorithm were predicted using partial least squares regression (PLSR), and higher prediction accuracy was obtained[20]. These algorithms were employed to standardize the prediction results and spectra obtained in different test environments.
The aims of this study were to (1) describe how the S/B and DS algorithms remove the effects of soil moisture from spectra recorded under different moisture content conditions, so that predictions and whole-spectra calibrations derived with dry soil samples might be used with spectra of different moisture contents to predict SOM content, (2) demonstrate the improvements from the S/B and DS algorithms using bias, and (3) compare SOM prediction accuracies using the S/B and DS algorithms as measured by PLSR.
In this study, 50 original loam soil samples were collected from Taigu, Guandishan, and Youyu of Jinzhong city, Shanxi Province. The soil samples were air-dried for several days and divided into two groups. One group was used for the detection of SOM content. The other group was used for preparation of soil samples with different moisture conditions. The SOM content was tested according to the potassium dichromate method (National standard method of China, GB9834— 88). The SOM contents ranged from 0.402% to 7.920%, with 25 analyses from 0.402% to 2.000%, 16 analyses from 2.000% to 3.000%, and 9 analyses from 3.000% to 7.920%, with the mean value 2.220% and the standard deviation 1.22% respectively.
The soil samples were sieved through 10 mesh and then divided into five parts of each sample. One part was taken as a control group. All soil samples were rewetted to four different moisture contents (5%, 10%, 15% and 17%) according to the following equation
where θ m is the mass moisture content (%); Qw is the quantity of purified water (g); and Qs is the quantity of oven-dry soil samples (g). Each part was weighed to 500 g and placed in a 1 000 mL beaker. Purified water (25, 50, 75 and 85 mL) was added into the beaker and stirred for several minutes to mix adequately and then sealed in plastic film. During sealing, the beaker was shaken to ensure uniform moisture diffusion. The original soil was processed to get 250 soil samples. The NIR spectra of all 250 soil samples were scanned in the same experimental environment 3 days later.
Soil samples were filled into a 12.5 cm diameter Petri dish. They were placed in the detection instrument to stabilize to a constant temperature of (20± 0.5) ℃. A FieldSpec3 spectrophotometer (ASD Company, USA) used to acquire visible (Vis) NIR spectra with a wavelength range of 2~500 nm. To avoid interference of background light, the measurements were performed in a dark space. Each reflectance spectrum was scanned 3 times, and each sample was scanned in triplicate. The spectral resolution was set at 3 nm in the range 350~1 000 nm and 10 nm in the range 1 000~2 500 nm. A breakpoint correction at 1 000 nm was applied using the ViewSpecPro Software. For each soil sample, the average of 9 spectra was analyzed as the spectrum for soil sample. The near infrared spectrum almost includes all the information of the hydrogen group in the organic matter, which contains the information of the structure and the composition state of the molecules. The information of SOM in near infrared spectrum is very rich, so the spectrum range 780~2 500 nm is selected to analyze in the research.
The S/B algorithm is a model transfer algorithm based on the correction of predicted results. For example, the SOM of soil samples with moisture content of 5% was predicted using a SOM model of dry soil samples. The SOM calibration model K with dry soil samples was established using PLSR with the NIR spectrometer results and randomly selected n soil samples with moisture content of 5% to compose the spectra matrix X1 for the standard sample set. The standard sample set X1 predicted using calibration model K and the SOM matrix C1 with moisture content of 5% were then obtained. The relation of the true value matrix C0 and C1 with moisture content of 5% is assumed as follows
where: C0 is the true value in moisture content of 5%, and C1 is the predicted value of standard sample set X1 spectra using SOM calibration model K. C0 and C1 are fitted by a linear regression equation, which is solved based on the principle of minimum sum of squares of residuals. The corresponding slope and bias are then obtained according to the Eq. (3) and Eq. (4).
The spectra matrix X2 of unknown samples with moisture content of 5% is collected and predicted using calibration model K. SOM prediction matrix C2 is then obtained. SOM correction matrix C3 is obtained by Eq. (5).
where: C3 is the correction from the slope/bias algorithm, and C2 is the predicted value of unknown samples in set X2 spectra using SOM calibration model K.
The DS algorithm is a multivariate model transfer algorithm based on the correction of the whole spectrum. It uses the entire set of wavelength data to calculate the transition matrix of a specific wavelength. The transfer process is complicated. The DS algorithm proposed by Wang et al.[21] was applied with the objective of establishing a mathematical relationship between the data obtained under different conditions, such as soil moisture and temperature, etc. For the DS algorithm, data obtained with representative samples called transfer samples (n Trans) are used to calculate a transformation matrix F, as presented below
where: Tm (n× m) is the matrix obtained with the original soil moisture content (dry soil samples), and Ts (n× m) is the matrix obtained with different soil moisture contents (5%, 10%, 15% and 17%), respectively. F is a matrix of size (m× m), where m is the number of wavelengths for the spectra. E is the residual error matrix.
In the DS method, the transformation F matrix is calculated by the least square method and is estimated as
where:
An unknown sample matrix Xs measured with different soil moisture contents can be standardized by multiplying the F matrix obtained from Eq. (7) to calculate Xm according to Xm=Xs× F+E, to match the spectra matrix measured with dry soil moisture.
In this paper, PLSR as a quantitative analysis was introduced to establish the SOM prediction model. A multivariate calibration model between SOM and spectra was developed using PLSR with n-fold cross validation. PLSR quantitative analysis was done in MATLAB R2015a (The MathWorks, Inc., Natick, MA, USA). The performance of models was evaluated by the following parameters: the correlation coefficient ofcalibration (Rc), the standard error of calibration (SEC), the root mean standard error of calibration (RMSEC), the correlation coefficient of prediction (Rp), the standard error of prediction (SEP), and the root mean standard error of prediction (RMSEP). Generally, a model with high Rc and Rp and low SEC, RMSEC, SEP, and RMSEP is considered a good model.
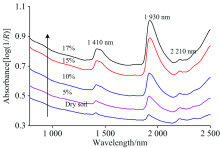
The mean absorbance spectra of 50 samples in different soil moisture content are shown in Fig.1. There are three characteristic peaks in the NIRS range: 1 930 and 1 410 nm with strong absorption, and 2 210 nm with weak absorption. The peaks near 1 930 and 1 410 nm iocreased with increasing soil moisture content. Here, 1 930 and 1 410 nm are two characteristic absorption bands for water molecules in the NIRS region. This indicates that moisture had strong absorption in the NIRS region. Therefore, soil moisture caused interference for the NIRS detection of SOM.
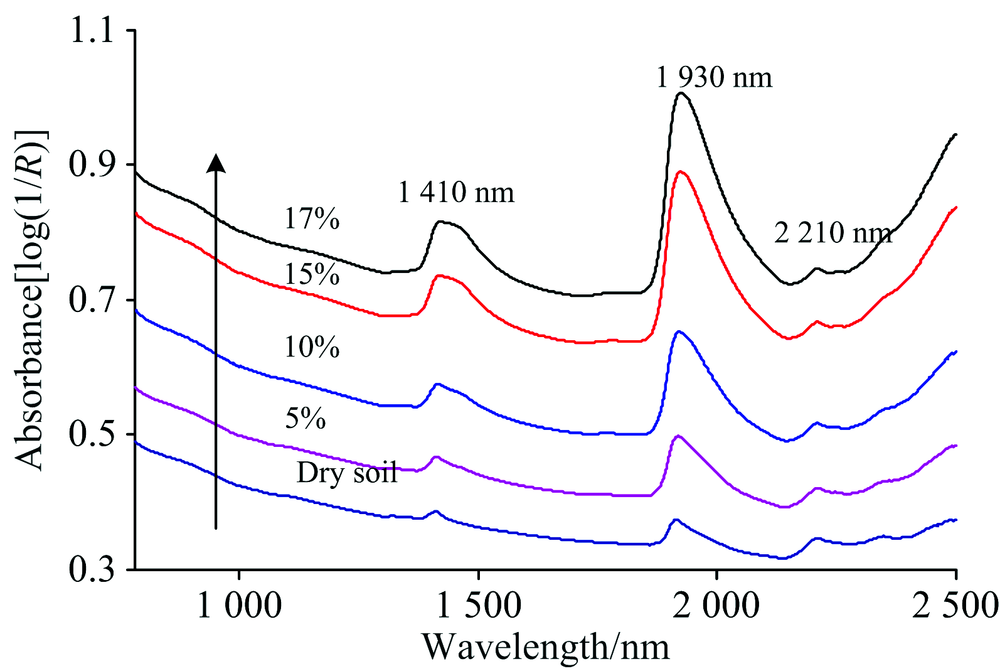 | Fig.1 The mean absorbance spectra of soil samples under different moisture contents |
In total, 41 dry soil samples (calibration data set) were used to establish the prediction model for SOM detection by PLSR in the range 780~2 500 nm, and the remaining 9 samples (SOM content: 0.825%, 1.071%, 1.428%, 1.740%, 1.941%, 1.969%, 2.320%, 3.123% and 4.239%) were used as the prediction set. The PLSR calibration model gave the best prediction performance for SOM, as measured by five principal components, Rc of 0.962, SEC of 0.358%, RMSEC of 0.383%, Rp of 0.961, SEP of 0.597%, and RMSEP of 0.600%.
41 samples with moisture content of 5%, 10%, 15% and 17% were predicted by using the established SOM calibration model. The true value matrix and predicted value matrix were fitted by linear regression, and the slope and bias were calculated. The linear relationship of the true values and predicted values is shown in Table 1.
| Table 1 The prediction results of soil organic matter content for original and correction models by slope/bias algorithm |
The spectra of the remaining 9 samples with moisture content of 5%, 10%, 15% and 17% were predicted using the SOM calibration model established. The SOM corrected values were calculated according to the linear relationship by the S/B algorithm and Eq. (5). The corrected results are shown in Table 1. The corrected values for the S/B algorithm were close to the true value. Compared with uncorrected values, bias showed an obvious decrease. The results show that the prediction accuracies of SOM content were improved using the S/B algorithm correction.
Totally, 41 soil samples were selected to establish the transformation model by the DS algorithm, and the remaining 9 samples were used to verify the adaptability of the algorithm. Transformation matrices F5%, F10%, F15% and F17% between NIR spectra with dry soil samples and soil samples with moisture content of 5%, 10%, 15% and 17% were calculated according to Eq. (7). Correction spectra for the 9 soil samples were calculated according to transformation matrix and Xm=Xs× F+E.
The original and DS correction absorbance spectra of the random 3 soil samples (SOM content: 0.825%, 2.320%, 4.239%) with varied moisture content in the NIR region are shown in Fig.2. The changes in the correction spectra by the DS algorithm are consistent with values before the correction. The corrected spectra are close to the spectra with the dry soil samples, and the height and width of the characteristic peak are also similar. The difference between the maximum and the minimum of the absorbance by DS correction was 0.05~0.10. The absorbance of correction spectra decreased, and the characteristic absorption of water molecules became weaker.
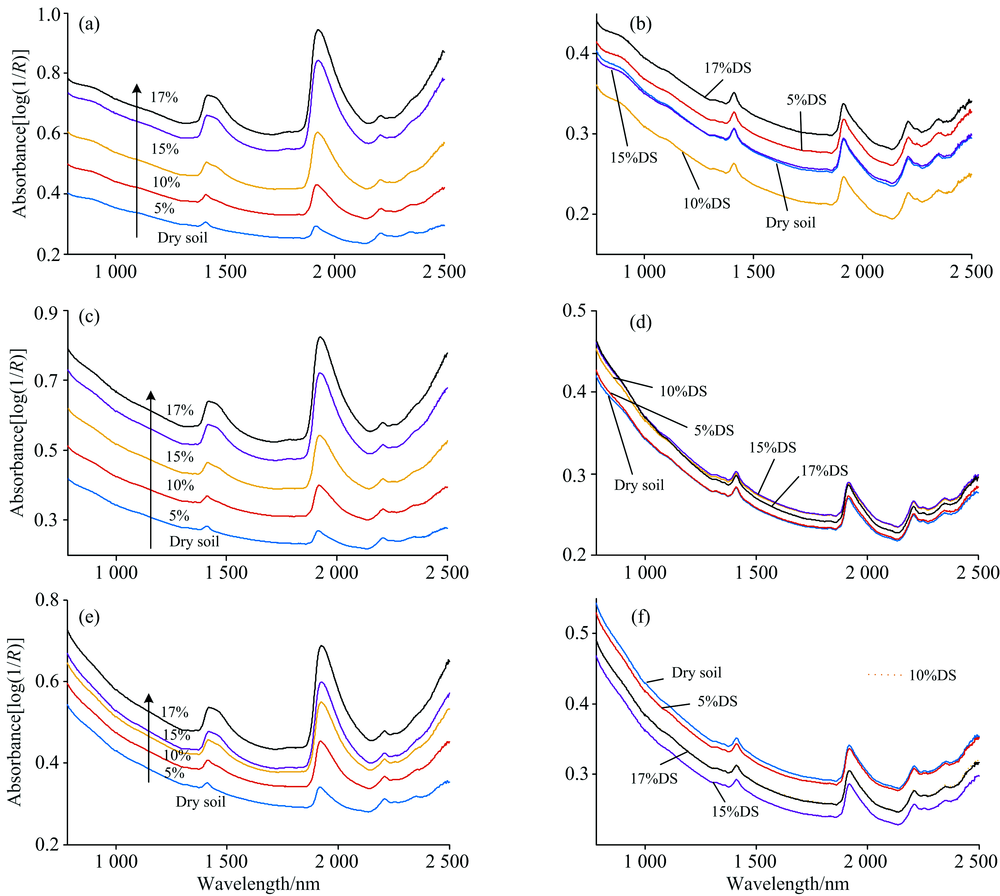 | Fig.2 Comparison of the original and direct standardization correction absorbance spectra of soil samples (organic matter content: 0.825%, 2.320%, 4.239%) with different moisture contents (a): 0.825% (original spectra); (b): 0.825% (correction spectra); (c): 2.320% (original spectra); (d): 2.320% (correction spectra); (e): 4.239% (original spectra); (f): 4.239% (correction spectra) |
The original and correction spectra of 9 soil samples with varied moisture content were predicted using the SOM calibration model established. The results are shown in Table 2. The corrected values by the DS algorithm are close to the true values. Compared with uncorrected values, the bias obviously decreased. Compared with corrected values by the S/B algorithm, the bias with moisture content 5% increased, and the bias with moisture contents 10%, 15% and 17% obviously improved. The results show that the DS algorithm can eliminate the influence of moisture content for detection of SOM in NIR spectra.
| Table 2 The prediction results of soil organic matter content for original and correction models by direct standardization algorithm |
The corrected results for S/B algorithm and the corrected spectra for DS algorithm were predicted by using the SOM calibration model. The predicted results are shown in Table 3.
| Table 3 The statistical parameters of partial least squares regression prediction model for soil organic matter content. The model prediction performances of the original and correction values by the slope/bias and direct standardization algorithms under different moisture content are compared |
Table 3 shows the statistical parameters of the nine-sample prediction set for both the original SOM values and corrected values from the S/B and DS algorithms. The S/B algorithm is a model transfer algorithm based on the correction of predicted results, while DS algorithm is a multivariate model transfer algorithm based on the correction of the whole-spectrum. Therefore, Rp values from the S/B algorithm were unchanged, and Rp values from the DS algorithm were changed, but over 0.895. For moisture content of 5%, the prediction performance of the S/B correction was better than DS correction, and the difference between SEP and RMSEP was only 0.086%. However, for moisture contents of 10%, 15% and 17%, compared with uncorrected values, the prediction performance of the S/B and DS algorithms both improved. The prediction performance of the DS correction was better than that of the S/B correction, SEP and RMSEP values were lower, and the difference between SEP and RMSEP was only 0.031%, 0.096% and 0.123%, respectively. The results indicate that the S/B and DS algorithms can effectively eliminate the effect of soil moisture and improve the accuracy of the SOM model prediction.
This implementation of the S/B and DS algorithms to account for the effects of moisture is encouraging. The results showed that the predicted values and spectroscopic predictions of SOM can be improved significantly using the S/B and DS algorithms under different moisture contents, respectively. And prediction performances of the model were improved using the S/B and DS algorithm corrections, with Rp higher than 0.89 and RMSEP lower than 0.885%. The study indicated that S/B and DS algorithm corrections could effectively remove the influence of soil moisture in NIRS analyses and improve the accuracy of SOM predictions.
We would like to thank the Beijing Research Center for Agriculture Standards and Testing, and Shanxi Agricultural University for technical support.
The authors have declared that no competing interests exist.
| [1] |
|
| [2] |
|
| [3] |
|
| [4] |
|
| [5] |
|
| [6] |
|
| [7] |
|
| [8] |
|
| [9] |
|
| [10] |
|
| [11] |
|
| [12] |
|
| [13] |
|
| [14] |
|
| [15] |
|
| [16] |
|
| [17] |
|
| [18] |
|
| [19] |
|
| [20] |
|
| [21] |
|