
Zn2+-胆红素络合物的超快激发态动力学研究
[陈琦琛 , 刘阳依, 曹潇丹, 陈壮, 曹思敏, 潘海峰, 陈缙泉
* ]
, 刘阳依, 曹潇丹, 陈壮, 曹思敏, 潘海峰, 陈缙泉]
|
|


作者简介: 陈琦琛, 1992年生, 华东师范大学精密光谱科学与技术国家重点实验室硕士研究生 e-mail: 1607801922@qq.com
胆红素(Bilirubin, BR)是脊椎动物分解代谢血红素的最终产物之一, 具有抗氧化和消炎等作用。 体内保持正常含量的胆红素对人类的健康起着非常重要的作用, 被认为有利于预防癌症、 中风、 糖尿病和心血管等疾病的发生[1-2]。 然而胆红素过量则被认为是肝功能障碍的征兆, 同时也是引起新生儿严重脑损伤的原因[3]。 因此, 对人体中胆红素含量的快速精准检测具有十分重要的应用价值。 目前为止, 用于检测血清样品中胆红素含量的方法主要有重氮法、 过氧化物酶法、 光纤传感检测法和荧光光谱法等[4]。 其中, 荧光光谱法具有检测迅速和操作简便的优势[5], 吸引了越来越多研究人员的关注。 但是, 由于胆红素自身的荧光量子产率通常低至10-4量级[6], 直接荧光测量难度很大, 因此通常采用间接方式解决胆红素含量测量的难题。 例如, Wabaidur等[7]通过胆红素猝灭Ru(bopy
Bilirubin (BR) is one of the final products of heme catabolism, which has functions of anti-oxidation and anti-inflammatory. Normal content of bilirubin in human body plays an indispensable role in human health, which has been confirmed to be protective against diseases such as cancer, stroke, diabetes and cardiovascular diseases etc.[1-2]. However, excess bilirubin has been long recognized as a sign of liver dysfunction as well as a potential toxic factor causing severe brain damage in newborns[3]. Thus, the analysis of bilirubin in body fluids is very important, speeding up the development of a cheap and accurate analytical method. Generally a lot of techniques have been used to detect bilirubin in serum samples, include diazo methods, peroxidase methods, fiber optic sensors, fluorometric methods etc.[4]. Fluorometric methods have the advantages of quick response and simple operation[5], attracting more and more researchers’ attention. However, the fluorescence quantum yield of bilirubin itself is quite low, which is on the order of 1
试剂: 胆红素(Bilirubin, 99%)购自北京百灵威科技有限公司; 无水乙酸锌(Zincacetate, 99.5%), 氢氧化钠(NaOH, ≥ 96%), 荧光素(Fluorescein)均购自国药集团化学试剂有限公司; N, N-二甲基甲酰胺(N, N-Dimethylformamide, ≥ 99.8%)购自上海阿拉丁生化科技股份有限公司。 以上所有药品与试剂均未进一步纯化。 实验所用水均为18.2 MΩ 去离子水。
实验仪器: 紫外-可见分光光度计(TU1901, 北京普析通用仪器有限责任公司), 稳态荧光光谱仪(FluoroMax-4, Horiba), 飞秒瞬态吸收系统包含1 kHz钛蓝宝石激光器(Astrella, Coherent)、 光参量放大器(OPerA Solo, Coherent)和瞬态吸收光谱仪(Helios-EOS fire, Ultrafast System)。
样品制备: 避光条件下, 将新鲜配制在DMF(二甲基甲酰胺)溶液中的100 μ mol· L-1胆红素与200 μ mol· L-1 Zn2+(乙酸锌)按照不同比例混合, 并用DMF进一步稀释到不同的特定浓度。 如无特殊说明, 稳态吸收和荧光实验中, 所有溶液中胆红素的浓度均保持为10 μ mol· L-1, Zn2+的浓度分别为0, 10, 20, 30, 50和100 μ mol· L-1。
稳态荧光: 激发波长为470 nm, 荧光光谱的强度用该样品在470 nm处的吸光度来校正(用荧光强度除以该样品在470 nm处的吸光度值以消除吸光度(浓度)不同对荧光强度的影响)。
样品荧光量子产率的测量采用相对法, 参比样品选用荧光素的碱性溶液(0.1 mol· L-1 NaOH水溶液, 相对量子产率为0.95[14])。
瞬态吸收: 样品是含有Zn2+的胆红素DMF溶液(Zn2+的浓度为200 μ mol· L-1, 胆红素的浓度为20 μ mol· L-1), 激发波长为530 nm, 探测波段为330~660 nm。
物质的荧光量子产率QY可以由相对法测量获得, 也可由式(1)计算得出
式中kRAD为物质的辐射跃迁速率, kEXC为物质的激发态衰退速率。
kEXC的值为激发态寿命τ EXC的倒数
当瞬态吸收检测到两个激发态(发射)信号时, 平均激发态寿命
式(3)中, τ i对应第i激发态(发射)的寿命, Ai为对应τ i时刻下瞬态吸收光谱信号的面积积分。
利用式(1)和式(2), 辐射跃迁速率为
非辐射跃迁速率kNR为
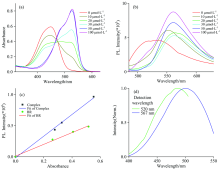
为了研究Zn2+对胆红素光谱特性的影响, 首先测量了胆红素在Zn2+浓度梯度下的稳态吸收和发射光谱。 图1(a)为胆红素溶液中加入不同浓度Zn2+后的吸收光谱。 Zn2+浓度为零时, 胆红素在溶液中的吸收特征峰位于450 nm处, 与文献报道一致[15]。 随着溶液中Zn2+浓度的增加, 胆红素的450 nm特征吸收峰强度逐渐减弱, 同时在~526 nm处出现新吸收峰并逐渐增强, 说明胆红素与Zn2+的络合物的形成。 研究发现, 当Zn2+浓度为100 μ mol· L-1及以上时, 吸收光谱不再有明显变化。 除此之外, 研究发现在高浓度Zn2+加入时, 络合物的吸收谱与胆红素和UnaG结合物的吸收谱形状相似。
 | 图1 10 μ mol· L-1胆红素在不同Zn2+浓度下, 溶液的(a)紫外-可见吸收光谱与(b)荧光光谱, (c)胆红素和络合物的荧光强度-吸光度, (d)络合物在不同探测波长下的激发谱Fig.1 (a) UV-Vis and (b) Fluorescence of 10 μ mol· L-1 BR with different concentration of zinc ions, (c) Plot of fluorescence intensity vs absorbance for BR and thecomplex, (d) Fluorescence excitation spectra of the complexat different detection wavelength |
图1(b)为胆红素溶液中加入不同浓度Zn2+后的荧光光谱。 Zn2+浓度为零时, 胆红素在溶液中的荧光发射峰位于530 nm处, 与文献报道一致[16]。 随着Zn2+浓度的增加, 荧光光谱逐渐红移, 荧光峰从530 nm逐渐位移到约567 nm后只有强度上的增加。 从图中可以直接观察到所有荧光的峰值在相同数量级, 表明Zn2+的加入对胆红素的荧光并没有明显增强。
为量化Zn2+的加入对荧光增强的效果, 测量了在不同Zn2+与胆红素浓度比例下物质的荧光量子产率, 如表1所示。 从表1中可以看出, Zn2+的加入引起了胆红素荧光增强, 但是荧光量子产率增强效果并不显著。 图1(c)为单纯胆红素溶液和Zn2+-胆红素络合物溶液(对应溶液中
| 表1 不同Zn2+与胆红素比例下, 物质的荧光量子产率 Table 1 Fluorescence Quantum Yield of different rate of BR and Zinc ions |
为了验证络合物具有两个发光基团推断的正确性以及了解络合物更多的性质, 研究使用飞秒瞬态吸收(transient absorption, TA)光谱技术进一步研究了Zn2+-胆红素络合物的光学特性。
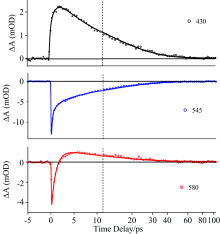
图2为络合物在DMF中紫外-可见波段的瞬态吸收光谱。 图2(a)和图2(b)分别为络合物在前5 ps和5~80 ps内随时间演变的光谱。 430 nm对应着强烈的激发态吸收(excited state absorption, ESA)信号, 545 nm对应激发态发射(stimulated emission, SE)和基态漂白(ground state bleaching, GSB)信号的叠加, 580 nm对应ESA和SE信号的叠加。 通过对430, 545和580 nm等单波长动力学曲线拟合(图3为单波长拟合结果, 表2为拟合所用参数), 得到了络合物的三个动力学时间常数, 分别是τ 1=0.3 ps, τ 2=1.1 ps, τ 3=12.0 ps, 这些时间常数与之前报道的胆红素在DMF中的飞秒频率上转换和飞秒瞬态吸收测得的结果相近[6]。 580 nm的负信号部分需要用两个指数进行拟合, 表明该动力学中有两个SE过程。 同时研究发现430 nm处信号初始时有增长并且需要相同数值的两个指数拟合。 580 nm信号由负到正的变化和430 nm最初有信号增强的现象都表明分子在激发态衰退后到达了某中间态。 考虑到580 nm附近的ESA信号在衰退过程中峰值有蓝移的现象, 并且580 nm的ESA信号(正信号)和545 nm长寿命的信号具有镜像对称关系, 研究推断该中间态为热基态。 络合物的动力学过程可以总结为: 络合物在受到光激发到达激发态后, 通过两个发射过程衰退到热基态, 最终通过驰豫振荡回到基态。 图2(b)中插图为飞秒瞬态吸收的衰减相关光谱(decay associated spectrum, DAS)。 两个较小的时间常数对应的光谱形状相似, 研究认为这两个时间常数分别对应两个发光基团的激发态。
| 表2 单波长动力学拟合参数 Table 2 Single-wavelength TA kinetics fit parameter of the complex |
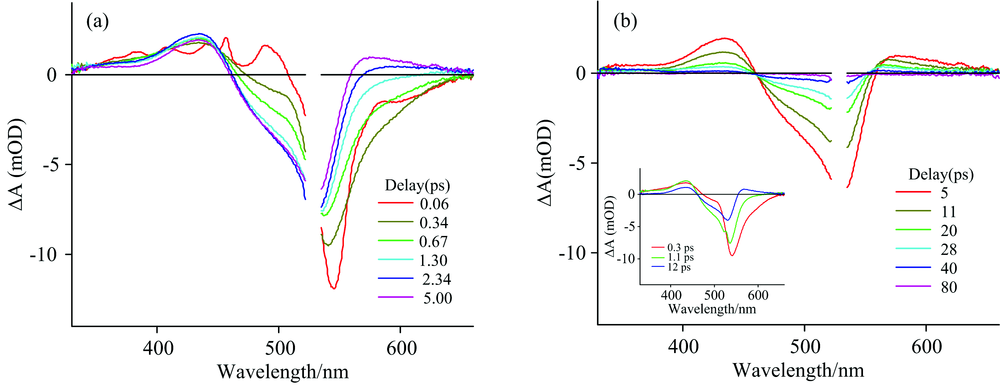 | 图2 530 nm激发, 络合物的DMF溶液在紫外-可见波段的瞬态吸收光谱 (a): 前5 ps的光谱演变; (b): 5~80 ps内的光谱演变Fig.2 TA spectra of complex in DMF in the UV-Vis spectral window after 530 nm excitation (a): Spectral evolution during the earliest 5 ps; (b): Spectral evolution in the 5~80 ps |
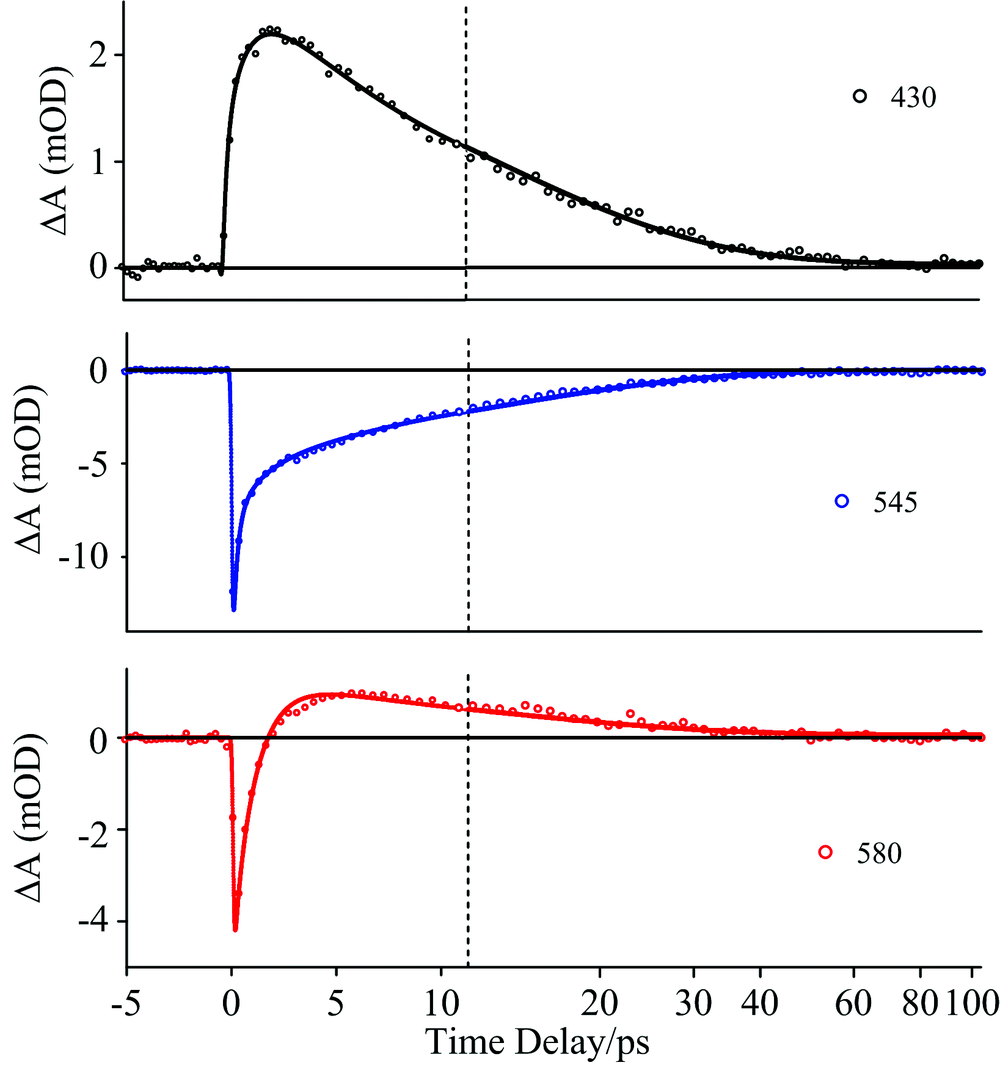 | 图3 络合物单波长动力学及拟合Fig.3 Single-wavelength TA kinetics and fit of the complex |
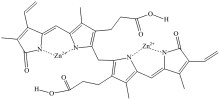
图4为John等[17]曾经提出的胆红素和Zn2+的配位方式, 两个Zn2+分别与胆红素两个双吡咯酮丙酸子基团上的N进行配位。 这种配位方式可以用于解释上文中所述的实验现象。 上文提到两个双吡咯酮丙酸子基团的光学性质并不相同, 研究认为两个子基团分别和Zn2+配位后, 其光学性质仍然不相同, 可以看成两个发光基团。 所以络合物在不同探测波长下的激发谱中的峰值位置不重合, 瞬态吸收实验中发现络合物有两个激发态, 以及DAS图中两个较小的时间常数对应的光谱形状相似的现象都有了很好的解释, 这些现象都是络合物存在两个发光基团导致的。
 | 图4 Zn2+-胆红素络合物的结构示意图Fig.4 Proposed Structure of zinc-BR complex |
根据上述的分析, 可以计算出胆红素和络合物的平均激发态寿命和激发态衰退速率。 结合表1中的量子产率, 进一步计算出了胆红素与络合物的辐射跃迁速率和非辐射跃迁速率, 如表3所示。
通过上文对图1(a)吸收光谱和图1(d)络合物激发谱的分析, 当溶液中Zn2+与胆红素的浓度为10∶ 1时, 溶液中将几乎不存在游离的胆红素分子。 通过吸收光谱计算出络合物的消光系数, 其数值约为单纯胆红素的1.6倍。 Strickler等[18]报道物质消光系数的增加有利于提高其辐射跃迁速率, 表3所示络合物的辐射跃迁速率相对胆红素增强了约4.6倍, 符合Strickler等提出的理论。
Carreria等[6, 19]曾经提出胆红素在受到光激发后存在高效的非辐射衰退途径, 并且该非辐射途径为激发态与基态的锥型交叉引起。 表3所示络合物具有更短的激发态寿命, 可以认为Zn2+与胆红素的这种配位方式进一步提高了分子以锥型交叉方式退激发态的效率, 最终引起络合物的非辐射跃迁速率相对胆红素增加。
| 表3 胆红素和络合物在DMF溶液中的辐射跃迁速率与非辐射跃迁速率 Table 3 Radiative and non-radiative decay rates of BP and the complex in DMF |
The authors have declared that no competing interests exist.
| [1] |
|
| [2] |
|
| [3] |
|
| [4] |
|
| [5] |
|
| [6] |
|
| [7] |
|
| [8] |
|
| [9] |
|
| [10] |
|
| [11] |
|
| [12] |
|
| [13] |
|
| [14] |
|
| [15] |
|
| [16] |
|
| [17] |
|
| [18] |
|
| [19] |
|