

中红外痕量乙烷传感器设计与稳定性分析
[李春光1, 2, 3, 4  , 董磊
, 董磊2, * , 郑传涛3 , 王一丁3 , 林君1, * ]
, 董磊, 郑传涛]
|
|


作者简介: 李春光, 1986年生, 吉林大学仪器科学与电气工程学院助理研究员 e-mail: lcg0213@126.com
根据乙烷气体分子在3.3 μm处的基频吸收特性, 使用中心波长为3.337 μm室温连续带间级联激光器(ICL)和有效光程为54.6 m密集光斑多通气体吸收气室(600 mL)研制了基于波长调制光谱技术(WMS)的乙烷传感器。 详细介绍了基于WMS和二次谐波(2 f)探测技术的光谱吸收法气体检测原理, 给出了目标乙烷气体吸收线的遴选细节。 此项技术的使用减小了光功率漂移对系统的影响, 使得系统最低检测下限(MDL)和稳定性能得到提升。 结合原理框图, 通过光学和电学两个模块分别详细介绍了乙烷传感系统设计方案, 描述了自主研制的软、 硬件单元和商用仪器的使用及其型号供他人参考, 并给出传感器光学配置实物图。 而且, 为匹配激光波长调制与基于压力的吸收线宽, 对气压和调制深度进行优化, 研究了调制幅度对应2 f信号峰值及调制幅度与调制深度的关系, 最终确定最优气压和调制深度分别为100 Torr和0.074 cm-1, 对应的调制信号幅度为0.026 V。 此外, 基于优化后的气压和调制深度, 使用136.8 nmol·mol-1 乙烷标准气体进行了系统灵敏度估算。 详细介绍了ICL扫描调制信号、 锁相放大及数据采集单元的参数设置, 并给出示波器记录的扫描调制信号及2 f信号波形图片。 通过对比DAQ采集的2 f信号和背景噪声信号, 估算系统最低检测下限为33 nmol·mol-1。 最后, 使用9个不同浓度乙烷标准气体(20~400 nmol·mol-1)分别进行5 min系统标定测试, 并列出了拟合曲线和拟合相关度等信息。 而且, 使用浓度为48 nmol·mol-1乙烷气体样品开展连续2 h系统稳定性测试并进行Allan-Werle 方差分析。 结果显示, 该系统工作稳定, 积分时间为4 s时, 乙烷气体检测灵敏度为0.81 nmol·mol-1。 通过增加系统积分时间至63 s, 系统灵敏度可被提高至0.36 nmol·mol-1。
According to the fundamental absorption properties of ethane (C2H6) near 3.3 μm, a mid-infrared C2H6 sensor based on a wavelength modulation spectroscopy (WMS) technique was developed using a room temperature, continuous-wave (CW) interband cascade laser (ICL) emitting at 3.34 μm and a dense multi-pass gas cell (600 mL) with a 54.6 m optical path length. The principle of gas detection using spectral absorption method based on wavelength modulation spectroscopy and two harmonic (2 f) detection technology is introduced in detail. Selection details of the target ethane absorption line are also given. The use of this technology reduces the influence of optical power drift on the system, making the minimum detection limit (MDL) and stability performance of the system get promoted. Ethane sensing system is introduced in detail through optical and electrical modules combined with the scheme. The application of self-developed software and hardware units as well as commercial instruments and their model are described for the reference to others, and physical map of the sensor optical core is also given. Moreover, the pressure and modulation depth are optimized in order to match the wavelength modulation of laser and absorption linewidth based on gas pressure. The curves of the modulation amplitude corresponding to the peak value of 2 f signals and the modulation depth corresponding to modulation depth are also drawn accordingly, and finally the appropriate pressure and modulation depth are determined to be 100 Torr and 0.074 cm-1, respectively. The corresponding modulation amplitude is 0.026 V at that point. In addition, the work of system sensitivity estimation is conducted by using 136.8 nmol·mol-1 C2H6 standard gas based on the optimized air pressure and modulation depth. The parameters setting of ICL scanning and modulation signals, phase-locked amplification as well as data acquisition are introduced in details, and pictures recorded by oscilloscope are also given. In this case, the system MDL is estimated to 33 nmol·mol-1 by comparing 2 f signal acquired by DAQ and background noise signal. Finally, the fitting curves and its correlation information are described by carrying out 5 minute system calibration tests, respectively, by using 9 different C2H6 standard gases from 20~400 nmol·mol-1. Moreover, 2 hours system stability test was conducted by using 48 nmol·mol-1 C2H6 sample. The result shows that this system works steadily and a minimum detection limit (MDL) of 0.81 nmol·mol-1 is achieved with a measurement time of 4 s. The MDL is further improved to 0.36 nmol·mol-1 with a measurement time of 63s, based on an Allan deviation analysis for the C2H6 sensor operation.
大气中的乙烷(C2H6)主要来自化石燃料并常在乙烯制造等化学工业过程中使用, 易燃易爆且影响大气化学和环境。 因此, 对其进行实时监测对于环境分析、 大气化学及气候影响而言尤为重要[1, 2, 3, 4]。 使用可调谐半导体激光吸收光谱技术(TDLAS)[5, 6, 7]进行痕量C2H6检测, 作为非接触式痕量气体检测的有效方法之一, 已被证明是环境监测[8, 9, 10]、 生物医学[11, 12, 13, 14, 15, 16, 17]、 工业过程控制[18, 19]和国防应用[10]等领域里痕量气体高灵敏度、 选择性探测的优秀工具。
许多气体分子的基频振动带位于2~4 μ m光谱区, 利用此“ 指纹区” 对痕量气体进行检测的应用日趋增多。 波兰军事科技大学Jacek Wojtas等于2015年研制了基于腔增强吸收光谱技术的重大疾病呼吸生物标志物传感器, 并实现对乙烷气体检测灵敏度为0.3 nmol· mol-1 (t< 3 s)[20]。 2012年— 2013年, 美国莱斯大学(Rice University) Karol Krzempek和Frank K. Tittel等使用分布反馈激光器(DFB)和TDLAS技术研制了两个乙烷检测系统, 分别实现对环境中痕量乙烷检测灵敏度为0.24 nmol· mol-1 (t=1 s)和0.74 nmol· mol-1 (t=1 s)[21, 22]。 国内, 中国科学院安徽光学精密机械研究所、 山西大学和哈尔滨工业大学等多家科研机构近年来已在痕量气体检测领域取得了显著成绩。
本研究使用室温连续ICL, 配合长光程多反射气体吸收气室和波长调制光谱技术在C2H6气体位于3.3 μ m附近的强吸收带对其进行高灵敏度检测是对国内超高灵敏度乙烷检测的有力补充。
使用WMS情况下, DFB ICL的电驱动信号为
其中, 周期性三角波信号utri(t)由DAQ产生, 用于变换ICL频率以扫描被选择的C2H6气体吸收线, usin(t)=Asinsin(ω sint)为调制信号, Asin和ω sin分别为幅度和角频率。 一旦发生变化, ICL的uwms(t)致使吸收系数发生变化, 表示为α wms(t)。 通过光电转换和放大, 仍然可以获得一个电信号并可以写成
2f信号可从锁相放大器的正交输出中提取, 由式(3)给出
其中
是两个正交分量, 并且Tint2是由相关低通滤波器截止频率决定的积分时间因子。 对应乙烷峰值吸收波长max[A2f(t)]的2f信号峰值幅度与C2H6浓度成正比, 表示为
F的表达式可以通过C2H6传感系统的标定试验确定。
3.3 μ m光谱区是C2H6的基频吸收带之一, 其潜在的光谱干扰主要来自水气(H2O), 对乙烷探测有很大影响。 图1(a)描绘了气压100 Torr和54.6 m有效光程条件下, 10 nmol· mol-1乙烷气体和2%水气的HITRAN吸收光谱。 位于3 336.8 nm (2 996.88 cm-1)的无干扰C2H6吸收线被选择为合适的目标吸收谱线。 图1(b)描绘了乙烷激光器出射波长和驱动电流之间的对应关系, 为准确锁定2 996.88 cm-1 C2H6吸收谱线, 工作温度和驱动电流经试验确定为10 ℃和47 mA。
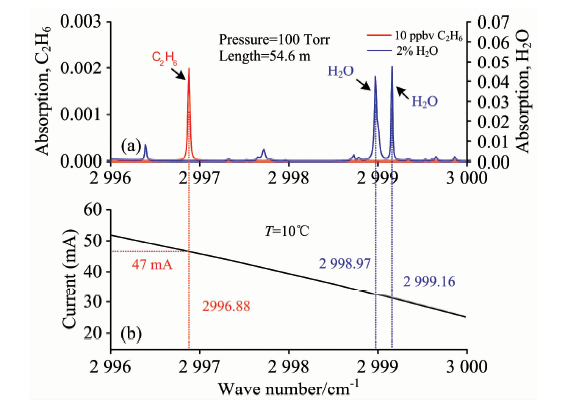 | 图1 (a) C2H6 (10 nmol· mol-1)和H2O (2%)吸收光谱; (b) 温度为10 ℃时ICL出射波长与驱动电流对应关系图Fig.1 (a) Absorption spectrum of C2H6 (10 nmol· mol-1) and H2O(2%); (b) Plot of the ICL emission wavenumber as a function of the ICL drive current at 10 ℃ |
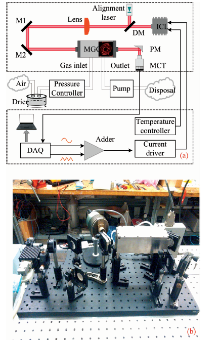
乙烷传感器原理框图如图2(a)所示, 由光学模块和电学模块两部分组成。 光学模块使用ICL作为系统光源, 其工作温度范围是5~15 ℃。 为准确完成54.6 m吸收光程, 首先通过二向色镜耦合ICL和红光, 后者作用为辅助调试。 然后, 使用汇聚透镜和平面镜完成光束准直过程。
 | 图2 (a)基于多反射气室和连续波TEC ICL光源的C2H6传感器原理框图; (b)传感器光学配置实物图 ICL: 带间级联激光器; DM: 二向分色镜; M: 平面镜; PM: 抛物面镜; MCT: 碲镉汞探测器Fig.2 (a) Schematic of the C2H6 sensor based on a continuous wave TEC ICL; (b) Photo of sensor platform ICL: Interband cascade laser; DM: Dichroic mirror; M: Plane mirror; PM: Parabolic mirror; MCT: Mercury cadmium telluride |
电学模块由数据采集卡(National Instrument, #USB-6356), 自制激光器驱动器、 温度控制器(Wavelength Electronics, #0520)和电脑组成。 ICL电流驱动器提供5V电压输出, 输出电流与输入电压比值为20 mA· V-1。 扫描和调制信号由LabVIEW结合DAQ数据采集卡产生并用于驱动ICL激光器。 传感器实物图如图2(b)所示。
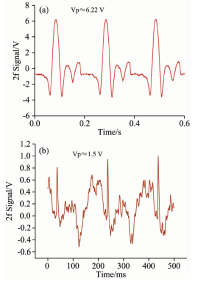
为满足对图1中目标C2H6的有效探测, 使用136.8 nmol· mol-1 C2H6∶ N2混合气体对100 Torr以内系统气压和ICL调制深度进行优化测试, 并得出 100 Torr系统气压和0.026 V条件下得到2f信号最大值, 相对应调制深度为0.074 cm-1。 经三个光谱周期扫描并通过DAQ采集到的2f信号如图3(a)所示, 背景填充气体为低成本、 与空气分子质量相近的N2。 测量得到的峰值幅度max[A2f(t)]≈ 6.22 V。 2f信号受存在的光干涉影响, 也影响C2H6检测下限(MDL), 因此, 更换被测气体为纯N2并重复上述试验, 测量得到噪声信号幅值约为1.5 V, 如图3(b)所示, 系统MDL估算为136.8 nmol· mol-1/(6.22 V/1.5 V)=33 nmol· mol-1。
 | 图3 (a) 使用136.8 nmol· mol-1 C2H6标准气体采集到的三周期2f信号; (b)使用纯N2测量得到的背景噪声信号Fig.3 (a) Acquired three cycle 2f signals for 136.8 nmol· mol-1 standard C2H6 concentration levels; (b)Background noise signal for prue N2 |
不同浓度C2H6气体样品(20~400 nmol· mol-1) 通过气体稀释系统 (Environics Inc., 型号: 4040) 配制而成, 平衡气体使用超纯N2。 不同浓度下获得的2f信号波形如图4(a)所示。 由于在峰值吸收波长处气体吸收增加, 2f信号的峰值随着气体浓度的增加而变大。
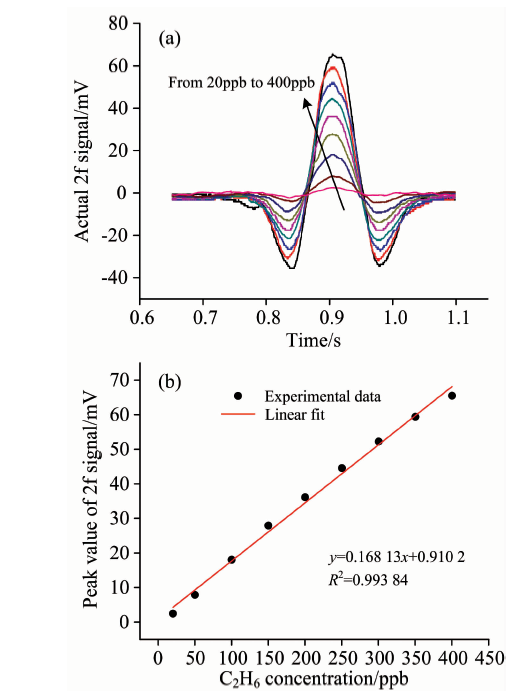 | 图4 (a) C2H6气体2f信号(20~400 nmol· mol-1), 平衡气N2; (b) C2H6标称浓度与2f信号峰值拟合Fig.4 (a) 2f signal of C2H6 (20~400 nmol· mol-1), balance gas is N2; (b) The fitting plot of C2H6 nominal concentration and peak value of 2f signal |
在MGC内填充不同浓度气体样品用于2f信号幅度测量, 可完成对传感系统的校准。 对各浓度气体样品分别测试5 min, 取平均测量得到的各浓度2f信号数据, 并绘制与各标称浓度相对应的数据点如图4(b)所示。 拟合关系如下
式(6)中, y为2f信号峰值(mV), x为气体浓度(nmol· mol-1), 拟合相关度R2=0.993 84。
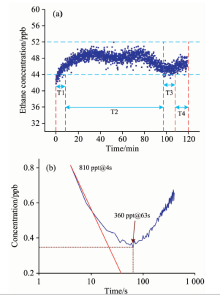
使用浓度为48 nmol· mol-1乙烷气体样品开展连续2 h的系统稳定性测试, 记录测试数据, 并使用Allan-Werle方差分析方法评估系统稳定性和精度。 图5(a)呈现了测试2 h得到浓度值与时间的关系曲线。 其中, T1内观测到的带有上升趋势的浓度信息是使用气体稀释系统进行48 nmol· mol-1乙烷气体配比的起始阶段, T2和T4为配比稳定后测得的波动± 4 nmol· mol-1内的C2H6浓度信息, T3内有个别C2H6浓度值低于44 nmol· mol-1, 对传感器性能会产生微小影响, 但在可接受范围之内。
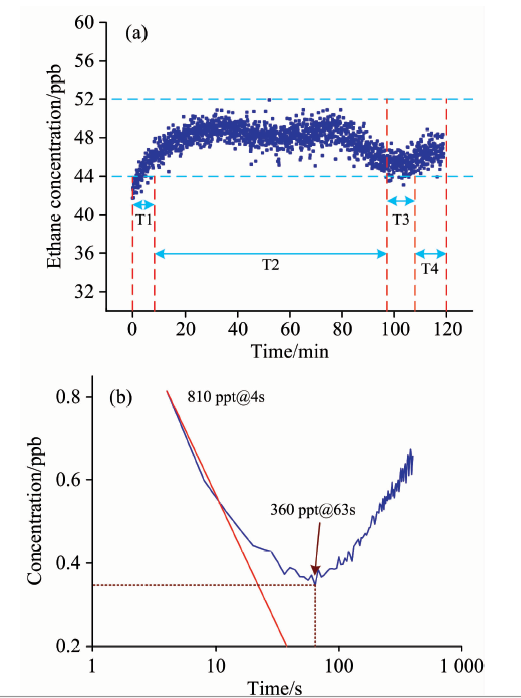 | 图5 (a) MGC内填充48 nmol· mol-1乙烷2 h稳定性测试; (b) Allan-Werle 方差与积分时间的函数关系图Fig.5 (a) 2 h Stability test for 48 nmol· mol-1 C2H6 filled in MGC; (b) Allan-Werle deviation plot as a function of time |
图5(b)呈现了Allan-Werle方差与积分时间t的函数关系。 积分时间为4 s时Allan方差为0.81 nmol· mol-1, 当积分时间增加到63 s时, 系统测量的稳定性可以达到0.36 nmol· mol-1。 下降的红色实线表明理论上期望的系统运转状态, 在积分时间t内与白噪声所主导的传感系统的sqrt(1/t)成正比。
本文介绍了基于密集光斑怀特气室和连续模式、 TEC带间级联激光器的中红外C2H6传感器的结构设计和性能分析。 系统实现乙烷气体检测下限为0.81 nmol· mol-1 (积分时间4 s)。 而且, 通过增加积分时间至63s, 系统灵敏度可提高至0.36 nmol· mol-1。 此外, 通过重新设计新型MGC, 对其几何结构和有效光程进行合理优化, 可进一步减小由温度变化引起的系统漂移。 后续工作中对基于以上两点考量的C2H6传感系统进行补充改进, 其稳定性能可得到进一步提升。
The authors have declared that no competing interests exist.
| [1] |
|
| [2] |
|
| [3] |
|
| [4] |
|
| [5] |
|
| [6] |
|
| [7] |
|
| [8] |
|
| [9] |
|
| [10] |
|
| [11] |
|
| [12] |
|
| [13] |
|
| [14] |
|
| [15] |
|
| [16] |
|
| [17] |
|
| [18] |
|
| [19] |
|
| [20] |
|
| [21] |
|
| [22] |
|