基于二维相关荧光谱土壤中PAHs检测方法研究
[杨仁杰1  , 王斌
, 王斌2 , 董桂梅1 , 杨延荣1 , 吴楠1 , 孙国红1 , 张伟玉1, * , 刘海学3, * ]
, 王斌, 刘海学]
|
|


作者简介: 杨仁杰, 1978年生, 天津农学院工程技术学院教授 e-mail: rjyang1978@163.com
传统荧光光谱技术已被用于土壤中多环芳烃(PAHs)的检测, 但由于土壤体系的复杂性、 PAHs污染物的多样化和微量化, 传统的荧光光谱技术无法有效提取土壤中PAHs的特征信息。 为了解决上述问题, 提出并建立一种基于二维相关荧光谱土壤中多环芳烃的检测方法。 以土壤中典型的多环芳烃蒽和菲为研究对象, 配置38个蒽菲混合标准土壤样品(蒽和菲的浓度范围均为0.000 5~0.01 g·g-1), 在激发波长265~340 nm, 发射波长350~500 nm范围内采集了所有样品的三维荧光谱。 以激发波长为外扰, 对外扰变化的动态一维荧光谱进行相关计算, 得到每一样品的同步二维相关荧光谱。 研究了浓度均为0.005 g·g-1蒽菲混合土壤样品的三维荧光谱和同步二维相关荧光谱特性, 在同步谱主对角线398, 419, 444和484 nm处存在自相关峰, 其中, 398和484 nm荧光峰来自土壤中的菲, 419和444 nm荧光峰来自土壤中的蒽; 在主对角线外侧, 蒽和菲两组荧光峰之间存在负的交叉峰, 进一步验证了其来源不同; 同时, 在(408, 434) nm和(434, 467) nm处出现交叉峰, 其中408和434 nm荧光峰来自土壤中的菲, 467 nm荧光峰来自土壤中的蒽。 指出与三维荧光谱表征的信息相比, 二维相关荧光谱不仅能提取更多的特征信息(408和467 nm的特征峰在三维荧光谱中未被表征), 而且还能提供荧光峰之间的相互关系, 对其来源进行有效解析。 在上述研究二维相关荧光谱特性的基础上, 基于同步相关谱矩阵(38×151×151)建立了定量分析土壤中蒽和菲污染物浓度的多维偏最小二乘(N-PLS)模型, 对蒽的校正和预测相关系数分别为0.986和0.985, 校正均方根误差(RMSEC)和预测均方根误差(RMSEP)分别为4.33×10⁻⁴和5.55×10⁻⁴ g·g-1; 对菲的校正和预测相关系数分别为0.981和0.984, RMSEC和RMSEP分别为5.20×10⁻⁴和4.80×10⁻⁴ g·g-1。 为了比较, 基于三维荧光光谱矩阵(38×16×151)建立了定量了分析土壤中蒽和菲的N-PLS模型, 对蒽的校正和预测相关系数分别为0.981和0.972, RMSEC和RMSEP分别为5.09×10⁻⁴和6.74×10⁻⁴ g·g-1; 对菲的校正和预测相关系数分别为0.957和0.956, RMSEC和RMSEP分别为7.36×10⁻⁴和7.77×10⁻⁴ g·g-1。 指出, 对于土壤中的蒽和菲检测, 基于二维相关荧光谱的N-PLS模型的相关系数 r, RMSEC和RMSEP都要优于基于三维荧光谱的N-PLS模型。 研究结果表明: 所提出和建立的方法—二维相关荧光谱直接检测土壤中PAHs污染物不仅可行, 而且能提供更好的分析结果。 该研究为激光诱导荧光结合相关谱技术现场直接检测土壤中多环芳烃污染物提供了理论和实验基础, 具有较好的应用前景。
, WANG Bin, LIU Hai-xue
The traditional fluorescence spectroscopy has been used for the detection of polycyclic aromatic hydrocarbons (PAHs) in soil. However, due to the complexity of soil system and the diversification and trace of PAHs pollutants, the traditional fluorescence spectroscopy cannot effectively extract the characteristic information of PAHs in soil. In order to solve the above problem, a new detection method of PAHs in soil was proposed and established based on two-dimensional (2D) correlation fluorescence spectroscopy. The typical PAHs pollutants of anthracene and phenanthrene in soil were used as research targets, and 38 mixture samples (the concentration of anthracene and phenanthrene in soil were between 0.000 5 and 0.01 g·g-1) were prepared. Three-dimensional (3D) fluorescence spectra of all samples were collected in the excitation wavelength range of 265~340 nm within an interval of 5 nm and in the emission wavelength range of 350~500 nm within an interval of 1 nm. And synchronous 2D correlation fluorescence spectra of all samples were calculated based on one-dimensional (1D) fluorescence spectra under the excitation perturbation. The characteristics of 3D fluorescence spectrum and synchronous 2D correlation fluorescence spectrum of the mixture of anthracene and phenanthrene were studied in soil (anthracene: 0.005 g·g-1, phenanthrene: 0.005 g·g-1). In the synchronous 2D correlation fluorescence spectrum, four auto-peaks were observed at 398, 419, 444 and 484 nm along the main diagonal. Among them, the fluorescence peaks of 398 and 484 nm came from the phenanthrene in the soil, and the fluorescence peaks of 419 and 444 nm came from the anthracene in the soil. At the outside of the main diagonal line, there were negative cross peaks between anthracene and phenanthrene fluorescence peaks, which further verified that the sources were different. At the same time, there were two cross peaks at (408, 434) nm and (434, 467) nm, and the peaks at 408 and 434 nm were assigned to phenanthrene and 467 nm was assigned to anthracene in soil. It was pointed out that, compared with traditional 3D fluorescence spectroscopy, 2D correlation fluorescence spectroscopy could not only extract more characteristic information (the characteristic peaks of 408 and 467 nm are not represented in the 3D fluorescence spectrum), but also provide the relationship between fluorescence peaks, and effectively analyse their sources. On the basis of the characteristics of the 2D correlation fluorescence spectra, the N-way partial least squares (N-PLS) models for detecting the contaminants of anthracene and phenanthrene in soil were developed based on synchronous 2D correlation fluorescence spectral matrices (38×151×151). For anthracene in soil, the correlation coefficients r were 0.986 and 0.985 in calibration and prediction set; the mean square root error of calibration (RMSEC) and the root mean square error of the prediction (RMSEP) were 4.33×10⁻⁴ and 5.55×10⁻⁴ g·g-1, respectively. For phenanthrene in soil, the correlation coefficients r were 0.981 and 0.984 in calibration and prediction set; the RMSEC and the RMSEP were 5.20×10⁻⁴ and 4.80×10⁻⁴ g·g-1, respectively. In order to compare, the N-PLS models for quantitative analysis of anthracene and phenanthrene in soil were established based on a 3D fluorescence spectral matrices(38×16×151). For anthracene in soil, the correlation coefficients r were 0.981 and 0.972 in calibration and prediction set; the RMSEC and the RMSEP were 5.09×10⁻⁴ and 6.74×10⁻⁴ g·g-1, respectively. For phenanthrene in soil, the correlation coefficients r were 0.957 and 0.956 in calibration and prediction set; the RMSEC and the RMSEP were 7.36×10⁻⁴ and 7.77×10⁻⁴ g·g-1, respectively. It was pointed out that, for the detection of anthracene and phenanthrene in soil, the correlation coefficients r, RMSEC and RMSEP of N-PLS models were better based on 2D correlation fluorescence spectra than 3D fluorescence spectra. The results showed that the direct detection of PAHs contaminants in soil based on 2D correlation fluorescence spectroscopy is not only feasible, but also can provide better analysis results. This study provides a theoretical and experimental basis for direct detection of PAHs in soil by laser induced fluorescence combined with 2D correlation technology, having a good application prospect.
多环芳烃(PAHs)是最早发现和研究的致癌物质, 它进入土壤后经长时间累积, 不仅会引起农作物减产和农产品的质量安全问题, 而且也制约了土壤的可持续发展。 因此, 在2016年, 国务院发布了《土壤污染防治行动计划》, 明确指出: 各部委要对土壤中的多环芳烃、 石油烃等有机污染物进行重点监管。 目前已有的检测方法需要复杂的预前处理, 操作繁琐[1, 2, 3], 不能满足全面普查、 动态监测土壤污染状况的需求。
基于荧光光谱的方法具有便捷、 简单和可实现现场检测等优势, 已被应用于土壤中多环芳烃的检测中[4, 5, 6]。 Alarie等[6]采用同步荧光光谱建立了土壤PAHs污染物定量分析的标准曲线。 Lee[7]等基于激光诱导荧光光谱技术实现了土壤中PAHs污染物的检测分析。 何俊等[8]采用激光诱导荧光实现土壤中蒽的直接定量分析。 杨仁杰等[9, 10]研究了土壤粒径和湿度含量对PAHs荧光特性的影响, 指出土壤理化参数对PAHs荧光强度存在显著影响。 但由于土壤体系的复杂性和土壤理化参数等因素对荧光的影响, 传统的荧光光谱技术无法有效提取复杂土壤体系中相互重叠的多环芳烃的特征信息。 相对于传统的荧光光谱技术, 二维相关荧光谱技术不仅可以提供复杂研究体系中待分析组分被覆盖的、 微弱的特征荧光信息[11, 12], 而且还可以提供这些荧光峰之间的相互作用[13, 14, 15]。 本文提出并建立一种新的土壤中PAHs定量分析的检测方法— 二维相关荧光谱结合多维偏最小二乘法(N-PLS), 并与三维荧光的分析结果进行对比分析。
所有土壤样品的三维荧光光谱数据用LS-55荧光分光光度计获得。 测量时将配置好的土壤样品装入仪器自带的固体附件中。 仪器扫描参数: 激发波长范围为265~340 nm, 扫描间隔为5 nm, 发射波长范围为350~500 nm, 扫描间隔为1 nm, 激发和发射单色仪狭缝宽度分别为5和3 nm, 扫描速度为1 000 nm· min-1。
所用土壤为中国标准物质网所提供的标准土壤GBW(E)070046。 菲和蒽均为分析纯, 其纯度为99%。 使用电子天枰分别称取0.5 g蒽与菲分析纯粉末, 再分别称取50 g标准土壤, 倒入研钵中充分研磨, 配制浓度为0.01 g· g-1的蒽与菲单组份土壤样品, 然后分别取不同量的蒽与菲单组份土壤样品与标准土壤混合, 并充分研磨, 得到38个含不同浓度蒽和菲的土壤样品(蒽和菲的浓度范围均为0.000 5~0.01 g· g-1)。
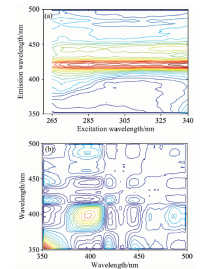
文献[10]指出, 在大于250 nm光激发下, 本底标准土壤不产生荧光。 因此, 本研究在激发波长265~340 nm, 发射波长350~500 nm范围内采集了所有样品的三维荧光谱。 图1是蒽和菲浓度均为0.005 g· g-1土壤样品的三维荧光谱和同步二维相关荧光谱。 从图1(a)可以看到蒽在419和444 nm出现荧光峰, 菲在434和484 nm出现荧光峰。 从图1(b)可以看到在主对角线398, 419, 444和484 nm处存在自相关峰, 其中398和484 nm峰来自土壤中的菲, 419和444 nm峰来自土壤中的蒽。 同时, 这4个峰之间在主对角线外侧存在交叉峰, 根据交叉峰正负进一步确认前两个峰来自菲, 后两个峰来自蒽。 值得一提的是, 在(408, 434)nm处出现正交叉峰, 在(434, 467)nm处出现负交叉峰, 结合参考文献[10], 可知408和434 nm峰也来自土壤中的菲, 而467 nm峰来自土壤中的蒽。 可以看出, 未在三维荧光谱中出现的408和467 nm荧光峰, 在二维相关谱中得以提取。
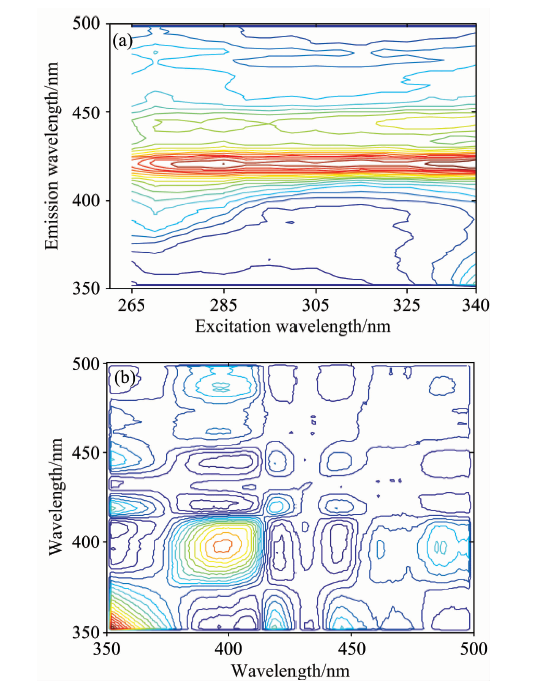 | 图1 蒽和菲土壤的三维荧光谱(a)和二维相关荧光谱(b)2.2 二维相关荧光谱的N-PLS模型Fig.1 3D fluorescence (a) and 2D correlation fluorescence spectrum (b) of anthracene and phenanthrene in soil |
在上述研究蒽和菲土壤相关荧光谱特性的基础上, 基于同步二维相关荧光谱矩阵(38× 151× 151)和N-PLS建立定量分析土壤中蒽和菲浓度的数学模型。 根据K-S法, 从38个蒽和菲不同质量分数的土壤样品中选取25个作为校正集, 余下13个样品作为预测集。 分别计算不同主成分数下的交叉验证均方根误差(RMSECV), 选择N-PLS模型的最佳主成分数。
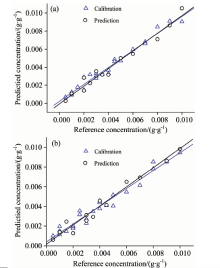
图2(a)为所建模型对校正集和预测集土壤样品中蒽浓度的预测结果。 对于校正集, 相关系数r为0.986, 校正均方根误差(RMSEC)为4.33× 10⁻⁴ g· g-1; 预测集, 相关系数r为0.985, 预测均方根误差(RMSEP)为5.55× 10⁻⁴ g· g-1。 图2(b)是所建模型对校正集和预测集土壤样品中菲浓度的预测结果。 对于校正集, 相关系数r为0.981, RMSEC为5.20× 10⁻⁴ g· g-1; 预测集, 相关系数r为0.984, RMSEP为4.8× 10⁻⁴ g· g-1。 从建模结果可以看出, 将同步二维相关荧光谱与N-PLS结合定量分析土壤中的PAHs污染物是可行的。
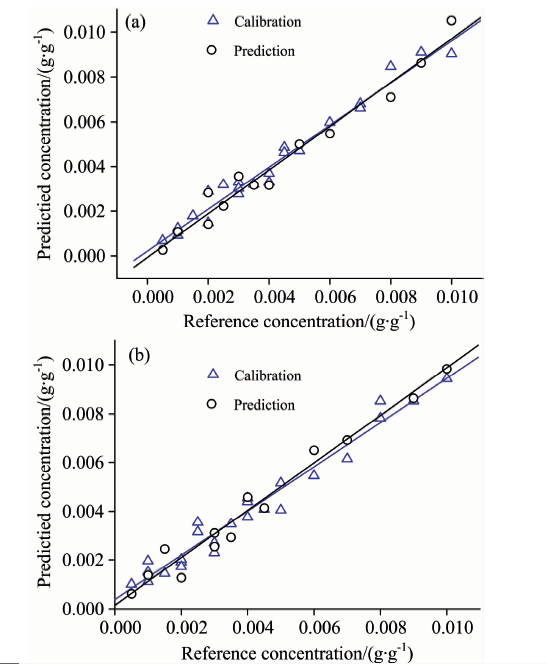 | 图2 基于同步二维相关荧光谱土壤中蒽(a)和菲(b)的预测结果2.3 三维荧光谱的N-PLS模型Fig.2 The predicted results of anthracene (a) and phenanthrene (b) in soil using 2D correlation fluorescence spectra |
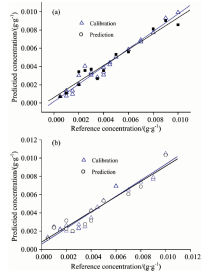
为比较, 基于三维荧光谱矩阵(38× 16× 151)建立了定量分析土壤中蒽和菲浓度的N-PLS模型。 图3(a)为所建模型对校正集和预测集土壤样品中蒽浓度的预测结果。 对于校正集, 相关系数r为0.981, RMSEC为5.09× 10⁻⁴ g· g-1; 预测集, 相关系数r为0.972, RMSEP为6.74× 10⁻⁴ g· g-1。 图3(b)是所建模型对校正集和预测集土壤样品中菲浓度的预测结果。 对于校正集, 相关系数r为0.957, RMSEC为7.36× 10⁻⁴ g· g-1; 预测集, 相关系数r为0.956, RMSEP为7.77× 10⁻⁴ g· g-1。
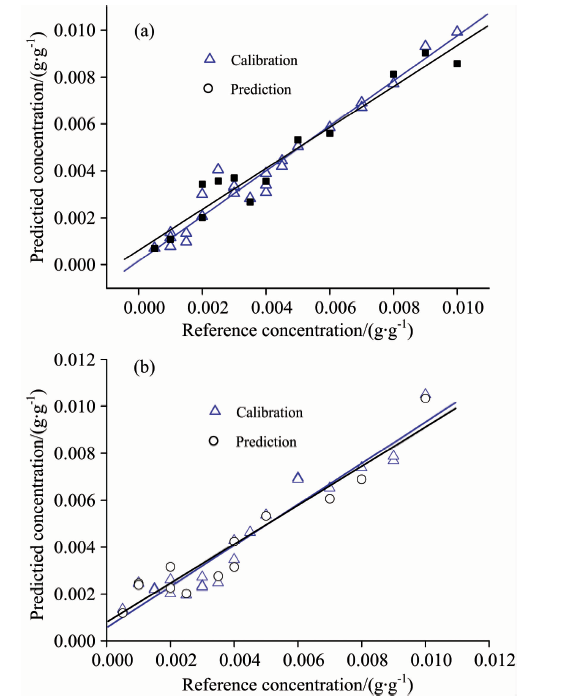 | 图3 基于三维荧光谱土壤中蒽(a)和菲(b)的预测结果Fig.3 The predicted results of anthracene (a) and phenanthrene (b) in soil using 3D fluorescence spectra |
表1给出了同步二维相关荧光谱与三维荧光光谱的N-PLS模型对土壤中蒽和菲浓度的预测结果。 从相关系数r, RMSEC和RMSEP性能指标来看, 相对于三维荧光的N-PLS模型, 基于同步二维相关荧光谱的N-PLS模型能提供更好的预测结果, 其原因可能是二维相关荧光谱能提取复杂土壤体系中更多的PAHs特征光谱信息。
| 表1 二维相关荧光谱与三维荧光N-PLS模型的预测结果 Table 1 The results predicted by N-PLS models using 2D correlation fluorescence spectra and 3D fluorescence spectra, respectively |
提出并建立一种基于二维相关荧光谱直接定量分析土壤中PAHs污染物的检测方法, 并与传统的三维荧光谱的分析结果进行了对比。 研究结果表明: 所建立的二维相关荧光谱的N-PLS模型能提供更好的预测结果。 下一步将开展激光诱导荧光光谱技术和相关谱技术相结合的土壤PAHs检测方法研究, 以实现土壤中微量甚至痕量PAHs污染物的检测需求。
The authors have declared that no competing interests exist.
| [1] |
|
| [2] |
|
| [3] |
|
| [4] |
|
| [5] |
|
| [6] |
|
| [7] |
|
| [8] |
|
| [9] |
|
| [10] |
|
| [11] |
|
| [12] |
|
| [13] |
|
| [14] |
|
| [15] |
|