


积雪-荒漠植被及其组合反射光谱特征观测实验及分析
[刘艳1  , 杨耘
, 杨耘2 , 聂磊3 , 李帅1 ]
, 杨耘|
|


作者简介: 刘 艳, 女, 1978年生, 中国气象局乌鲁木齐沙漠气象研究所副研究员 E-mail: Liuyan@idm.cn
光谱混合机制研究对混合像元解算具有一定指导意义。 利用全波段光谱仪累积期和消融期对规则和非规则分布模式下积雪-荒漠植被混合像元及纯净积雪和荒漠植被像元控制式采集反射光谱。 K-均值法计算采集影像积雪和荒漠植被面积比并分析其对应混合像元光谱变化特征以获取更加精细的光谱特征信息, 准同步Tetracam ADC3(Agricultural Digital Camera 3)采集图像并计算典型指数, 从微观尺度上证实了混合像元主要出现在地类边界处。 结果发现, 1 456~1 697 nm粗粒径冻结雪反射光谱高于新雪反射光谱, 新雪反射光谱明显高于陈雪; 因冻结覆冰, 荒漠植被光谱为积雪、 冰晶和植被枝干混合光谱信息, 新降积雪覆盖植被光谱特征为积雪和植被枝干的混合光谱信息, 不存在常规绿色植被“红边”效应; 采集角度为5°和10°时光谱低于垂直角度采集光谱, 角度大于10°随角度增加荒漠植被光谱逐渐增大。 像元内各个组成物质的面积比及所处像元的位置、 采集角度和方向都会影响混合像元的光谱组合信息。
The study on spectral mixing mechanism has a certain instructive significance to unmixing. With a full-wavelength spectrometer, the research made a controlled acquisition of the spectral reflectivity of pure snow pixels, pure desert-vegetation pixels and snow-desert vegetation mixed pixels in the mode of rule and irregular distribution during the accumulation period and ablation period. The ratio of snow area to desert vegetation area of images was calculated by K-means clustering algorithm and spectral variation characteristics of mixed pixels were analyzed; to obtain more precise spectral characteristic information, the absorption characteristic parameters to the response bands were calculated; the images were collected by quasi-synchronous Tetracam ADC3 and the typical indices were calculated. It’s verified at the micro-scale that the mixed pixels are mainly located at the boundary between one category to another. The results are seen as follows: the spectral reflectivity of coarse-grained frozen snow is obviously higher than that of new snow which is obviously higher than that of aged snow in the ranges of 1 456~1 697 nm. Because of the ice cover, the collected desert vegetation spectra is actually a mixture of spectral information of snow, ice crystals and vegetation branches; the spectral properties of vegetation covered with new snow are actually the mixed spectral information of snow and vegetation branches; there is no “red edge” effect like conventional green vegetation. When the acquisition angles are 5° and 10°, the spectral reflectivity is lower than that at a vertical angle. When the acquisition angle is bigger than 10°, the spectral reflectivity increases if the angle becomes bigger.
卫星传感器空间分辨率限制和被探测目标的多样性造成遥感影像中存在大量混合像元[1], 亦指一个像元内存在不同类型的地物[2]。 混合像元分析是遥感影像处理的一个重要方向, 各类别地物在混合像元内所占比的分析技术称为“ 光谱解混” [3]。 Adams, Roberts等将线性混合模型引入遥感开启了遥感影像的亚像元处理模式[4, 5], Boardman将凸面几何学和单形体概念引入遥感和Craig, Berman等将优化思想引入混合像元分析开启了端元选择和生成的新方向[6, 7]。 根据混合像元光谱产生机理建立了许多分解模型, 主要包括线性、 非线性分解、 模糊监督和神经网络等模型。 其中线性分解模型物理含义明确, 建模简单, 得到了较为广泛的应用[8, 9, 10]。 这些模型是基于遥感影像这类宏观尺度数据建立的, 遥感影像波段范围相对固定。 随着地基光谱采集仪研发技术发展, 目前拥有成像光谱仪和非成像光谱仪两种采集仪, 更能从微小的光谱差异中提取更多、 更精确的地物特征信息[11]。 本文基于控制实验, 构建不同面积比的积雪-荒漠植被混合像元, 包括规则分布和非规则分布两种模式, 使用美国分析光谱仪器公司ASD(
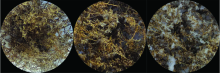
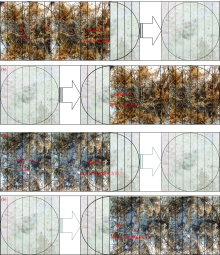
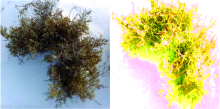
观测对象为荒漠植被, 植被高度15 cm左右, 类型为荒漠梭梭(如图1所示), 枝干比较紧凑。 积雪类型为干雪, 密度0.15 g· cm-3, 粒径大小均匀。 实验场地为水泥地面。 采用纵向、 横向和圆内不规则三种模式进行像元混合。 试验在每日晴朗无云的正午时段进行, 利用ASD FiledSpec光谱仪(
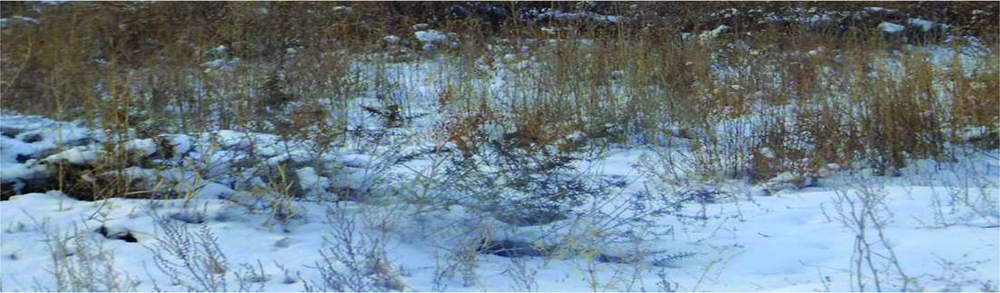 | 图1 积雪-荒漠植被分布图Fig.1 Snow-desert vegetation regional distribution map for the control experiment |
包络线为逐点直线连接随波长变化的吸收或反射凸出的“ 峰” 值点并使折线在“ 峰” 值点上的外角大于180° [12]。 包络线处理即利用包络线将原始地物光谱曲线归一化, 使得光谱曲线归一到一致的光谱背景上, 有效突出光谱曲线吸收和反射特征[12, 13]。
首先, 采用K-均值法对拍摄混合像元图像进行聚类[14]。 然后, 采用中值滤波消除聚类后带来的噪声。 最后, 将图像进行二值化, 分别统计积雪和荒漠植被的像元个数, 根据像元个数比以及图像覆盖总面积, 求出规则和不规则积雪-荒漠植被覆盖面积。
式(1)中, Areasnow为积雪像元面积, Numsnow为积雪像元个数, Numveg为荒漠植被像元个数, Areaimage为影像总面积。
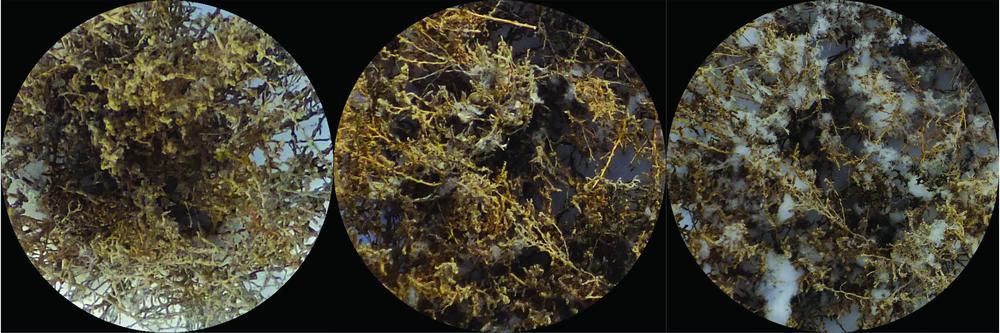
根据观测周期内(2015-01-04至2015-01-10日)积雪时间和粒径大小将观测积雪分为陈雪、 新雪和冻结雪三种类型。 其中, 陈雪定义为观测起始日2015-01-04日前的积雪, 新雪定义为2015-01-07日晚间观测地出现降雪天气后所形成的积雪, 冻结雪定义为观测周期内因午后12:00气温升高陈雪融化次日冻结形成的带有冰粒、 表面粗燥的积雪(图2)。
 | 图2 三种类型积雪表面[陈雪(a)、 新雪(b)和冻结雪(c)]Fig.2 Three types of snow surface [aged snow (a), new snow (b), frozen snow (c)] |
不同类型积雪反射光谱和去除包络线后积雪反射光谱特征如下:
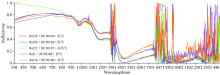
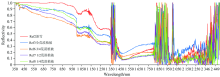
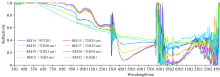
(1) 由图3可见, 可见光波谱范围内(350~760 nm)积雪具有0.6以上的反射率, 1 600 nm附近积雪吸收太阳辐射形成强近红外吸收, 表现在反射光谱曲线上反射率降低到0.2以下, 形成积雪独特的光谱特征, 在1 800~2 500 nm波谱范围内由于噪声、 大气水汽等原因的影响使得这部分积雪反射光谱数据误差较大。
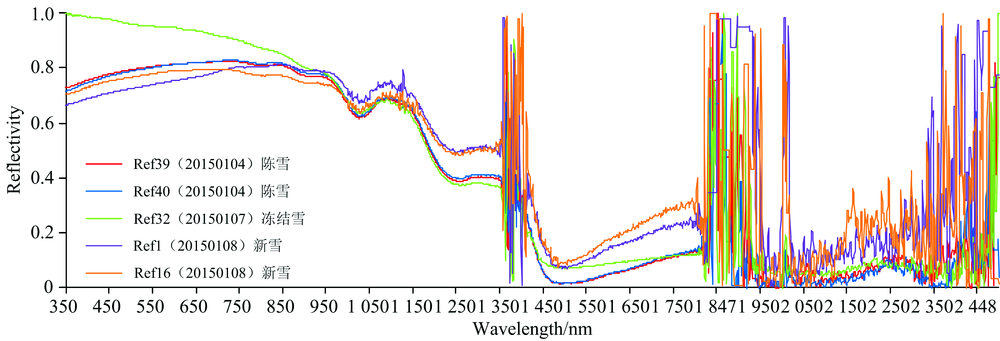 | 图3 350~2 500 nm范围内陈雪、 新雪、 冻结雪原始光谱特征Fig.3 The spectral reflectance properties of aged snow, new snow, frozen snow in the range of 350 to 2 500 nm |
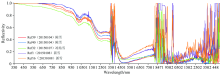
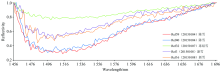
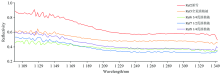
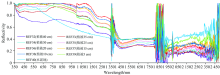
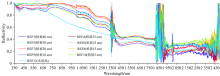
(2) 由图4和5可见, 反射光谱包络线去除后, 1 456~1 697 nm范围内粗粒径冻结雪反射光谱高于新雪反射光谱, 新雪反射光谱明显高于陈雪反射光谱(图4和图5)。
 | 图4 350~2 500 nm范围内陈雪、 新雪、 冻结雪光谱数据去包络线后光谱特征Fig.4 The spectral reflectance properties of aged snow, new snow, frozen snow after removing envelop line in the range of 350 to 2 500 nm |
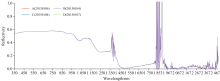
 | 图5 1 456~1 698 nm范围内陈雪、 新雪、 冻结雪光谱数据去包络线后光谱特征Fig.5 The spectral reflectance properties of aged snow, new snow and frozen snow after removing envelop line within the range of 1 456 to 1 698 nm |
(
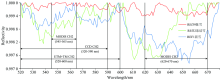
 | 图6 520~680 nm范围内去除包络线光谱特征Fig.6 The spectral reflectivity properties after envelope removal in the range of 520 to 680 nm |
 | 图7 ADC3绿光波段520~600 nm(a)和红光波段630~690 nm(b)积雪Fig.7 The snow image taken with ADC3 in the green band (520~600 nm) (a) and the red band (630~690 nm) (b) |
植被与辐射的相互作用主要体现在叶片光谱特征。 本实验观测对象为矮梭梭, 其枝条较密, 冬季枝条被积雪覆盖, 气温上升, 积雪消融后冻结, 使得枝条部分被冰覆盖, 形成冰状枝条。 观测周期内因出现降雪天气和午后12点气温升高有融雪发生。 观测荒漠植被有纯植被和新雪覆盖植被以及冰粒覆盖植被三种类型(图9), 光谱特征与常规植被光谱差异显著:
(1) 观测区内无积雪覆盖荒漠植被光谱特征已经不存在常规绿色植被的“ 红边” 效应, 即红光波段(620~760 nm)强吸收, 近红外(700~1 300 nm)高反射。 冻结覆冰覆盖荒漠植被采集光谱为积雪、 冰晶和植被枝干混合的光谱信息。 新降积雪覆盖植被类型及光谱特征积雪和植被枝干混合的光谱信息(图8和图9)。
 | 图8 观测荒漠植被类型 (a): 纯植被; (b): 新雪覆盖; (c): 冰粒覆盖Fig.8 The types of observed desert vegetation (a): Pure vegetation; (b): Vegetation covered with new snow; (c): Vegetation covered with ice particles |
 | 图9 2015-01-04至08日观测荒漠植被光谱特征(无雪覆盖; 冻结覆冰覆盖; 新雪覆盖)Fig.9 The spectral property of desert vegetation from January 4 to January 8 in 2015(no snow cover, icing cover, new snow) |
(2) 坡度对于荒漠植被反射光谱影响表现为: 角度为5° 和10° 时, 采集光谱会低于垂直角度采集的荒漠植被光谱, 角度大于10 ° 时, 随着角度增加采集荒漠植被的光谱逐渐增大(图10)。
 | 图10 去包络线后坡度对荒漠植被光谱的干扰(2015-01-10日观测)Fig.10 The effect of the slope on the spectral reflectivity of desert vegetation after continuum removal (Observed on October 10, 2015) |
(3) 规则面积比积雪-植被混合观测光谱特征, 当积雪面积占像元比例为3: 1时, 积雪组分对混合像元的贡献占主要比重, 采集光谱主要表现为积雪的光谱特征, 当积雪组分和荒漠植被组分比例相当时, 采集光谱为植被和积雪的混合特征, 纯净荒漠植被因冻结覆冰和新降积雪, 其采集光谱为积雪、 植被和冰混合的光谱特征(图11, 图12和图13)。
 | 图11 规则面积比植被-积雪照片( |
 | 图12 去包络线后350~2 500 nm范围内规则面积比积雪-植被混合观测光谱特征Fig.12 The observation of the mixed spectral reflectivity of snow-vegetation with regular area ratios in the range of 350nm to 2500 nm after envelop removal |
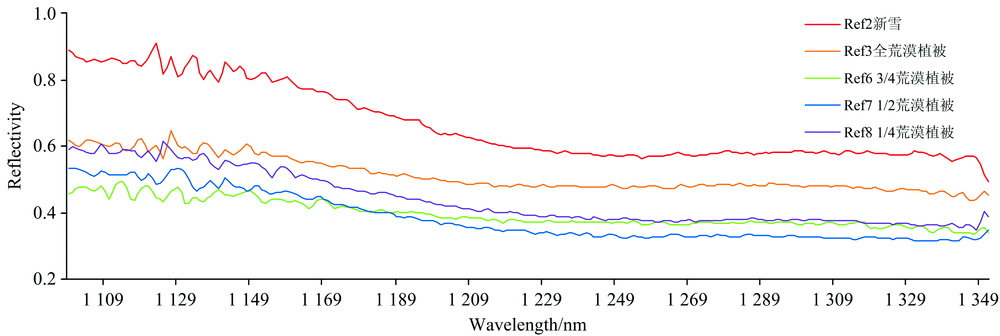 | 图13 去包络线后1 098~1 351 nm范围内规则面积比积雪-植被混合观测光谱特征Fig.13 The observation of the mixed spectral reflectivity of snow-vegetation with regular area ratios in the range of 1 098 to 1 351 nm after envelop removal |
(4) 不规则面积比积雪-植被混合观测光谱特征, 积雪植被面积比=0.78: 0.22, 虽然积雪所占比例较大, 但是因为植被位于影像中心, 荒漠植被贡献的光谱信息大于积雪(如图14和图15)。 因此, 其反射光谱值较低, 基本表现为荒漠植被的光谱信息。 当植被和积雪混合时, 各个组分的面积和组分在混合像元内的位置, 严格决定了混合像元的光谱特征。
 | 图14 不规则面积比积雪-植被混合观测类型图 积雪面积比依次为(a): 0.78: 0.22; (b): 0.48: 0.52; (c): 0.22: 0.78; (d): 0.58: 0.42Fig.14 The observation of the mixed pixels with different area ratios of snow to vegetation (a): 0.78: 0.22; (b): 0.48: 0.52; (c): 0.22: 0.78; (d): 0.58: 0.42 |
 | 图15 不规则面积比积雪-植被混合观测光谱类型Fig.15 The spectral properties of snow-vegetation with irregular area ratios |
(5) 观测方向对反射光谱的干扰。 以5 cm步长, 左右两个方向进行光谱观测, 分别获取规则面积比植被-水泥地, 植被-积雪混合像元光谱。 其中, 左推出定义为雪面完全覆盖水泥地面后, 以5 cm步长逐渐使得水泥地面裸露[图19(a)], 右推进定义为雪面以5 cm步长逐渐覆盖水泥地面[图19(
 | 图16 观测地物类型及下垫面类型(积雪面; 下垫面为水泥地) (a): 左推出, 雪面完全覆盖后; 从左边以5 cm步长逐渐推出水泥地面; (b): 右推进, 雪面从右边以5 cm步长逐渐推进覆盖水泥地面Fig.16 Types of observed objects and their underlying surface (the types of underlying surface of snow surface is concrete floor) (a): The mode of forward on the left which makes cemented ground gradually get out of snow surface, taking a 5 cm interval; (b): The mode of forward on the right which makes cemented ground gradually covered by snow surface |
 | 图17 不同积雪-水泥面比例观测光谱特征(2015-01-09日观测)(右推式)Fig.17 The observed spectral reflectivity in the case of different ratios of snow-concrete floor (observed on January 9, 2015) (forward on the right) |
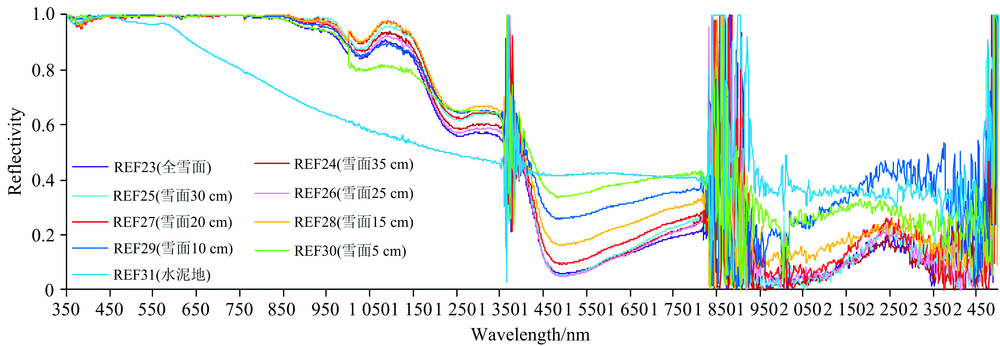 | 图18 不同积雪-水泥面比例观测光谱特征(2015-01-09日观测)(左推式)Fig.18 The observed spectral reflectivity in the case of different ratios of snow-concrete floor (observed on January 9, 2015) (forward on the left) |
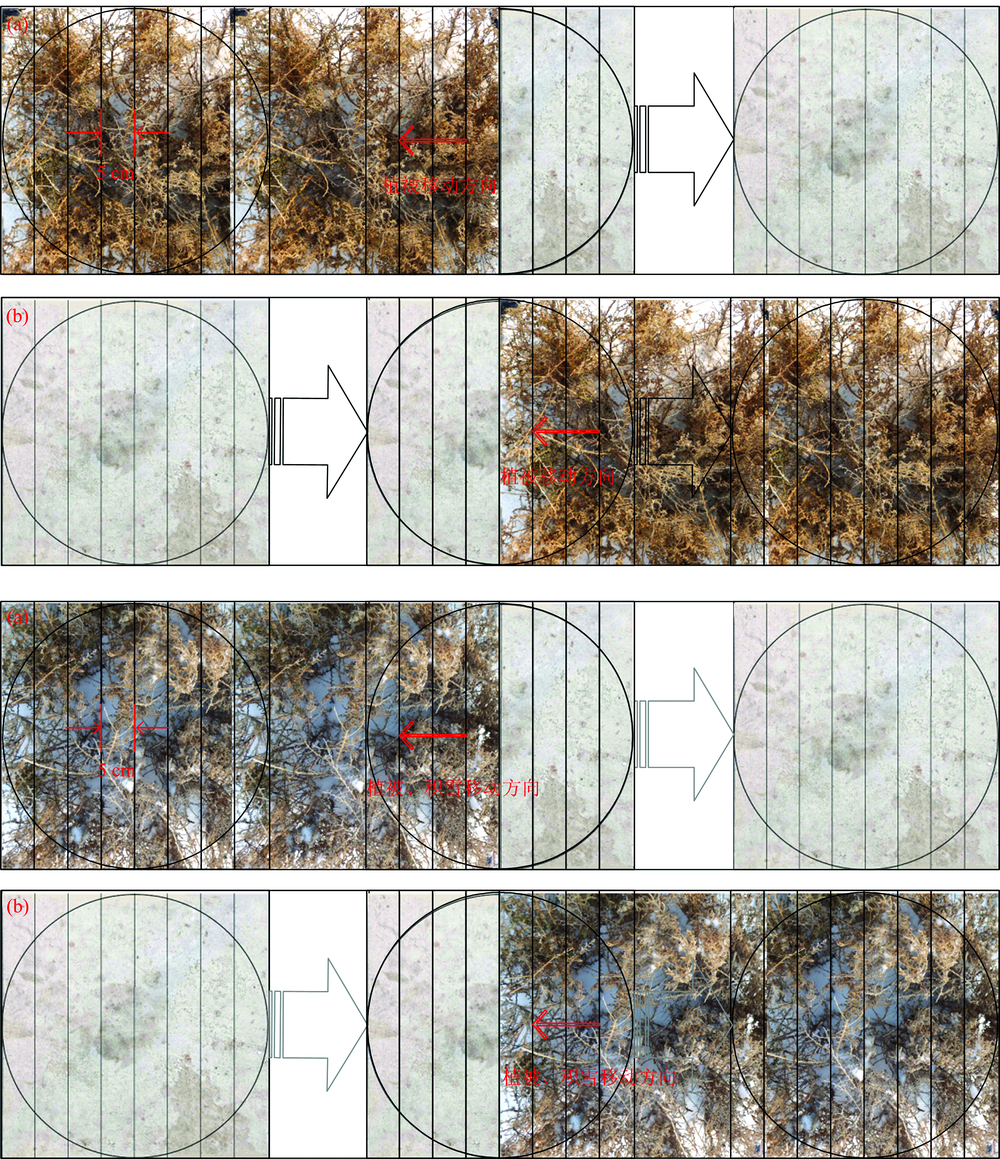 | 图19 观测地物类型及下垫面类型( (a): 左推出 (a): The mode of forward on the left which makes vegetation (snow surface) gradually get out of the cemented ground |
 | 图20 不同全植被+积雪-水泥面比观测光谱特征(2015-01-09日观测)(左推式)Fig.20 The observed spectral reflectivity in the case of different ratios of pure vegetation to snow-vegetation (observed on January 9, 2015) (forward on the left) |
与积雪表面不同, 右推式植被-混合像元观测光谱出现明显的“ 陡峭” 反应, 即光谱仪1探头(350~1 000 nm之间光谱采样间隔为1.4 nm, 光谱分辨率3 nm)处出现明显的陡坡效应。 采集像元为纯净植被时, 其反射光谱小于推进过程中水泥地-植被的混合光谱, 如图21。
 | 图21 不同全植被+积雪-水泥面比观测光谱特征(2015-01-09日观测)(右推式)Fig.21 The observed spectral reflectivity in the case of different ratios of pure vegetation to snow-vegetation (observed on January 9, 2015) (forward on the right) |
(6) 利用ADC多光谱照相机拍摄照片和NDVI, GNDVI和NIR/G植被指数, 发现在积雪和植被混合区, NDVI判识效果最差, GNDVI和NIR/G能够较好对积雪植被混合区域边界以及植被阴影进行识别(见图22和图23)。
 | 图22 数码相机采集图片(a)和ADC光谱相机采集图片(TTC00064)(b)Fig.22 The photos taken with digital camera (a) and with ADC multispectral camera (b) |
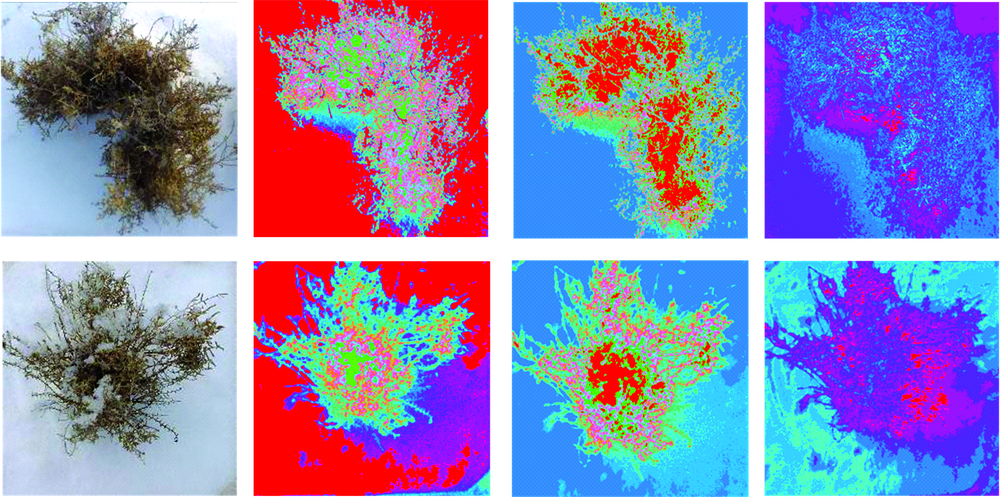 | 图23 植被面积相对集中的ADC植被指数计算结果图(数码照片\Green Ndvi\NirG\NDVI)Fig.23 Digital images ( the 1st column)and the ADC vegetation indices with the relatively concentrated vegetation area (the 2nd column: Green Ndvi, the 3rd column: NirG, the 4th column: NDVI) |
控制实验有助于定量获取积雪、 荒漠植被及其组合(规则、 不规则分布等)的多类型反射光谱数据。 规则分布和非规则分布模式下积雪-荒漠植被混合像元及积雪和荒漠植被像元反射光谱数据分析结果可以很好地从像元内不同地类所占面积比重和所处位置两个方面研究各纯净像元(端元)对混合像元的贡献度和影响。 关于采集光谱方向性的实验, 对于野外光谱数据采集具有一定的指示意义, 采样时应该统一光谱仪探头距离及其采集的方向性, 以避免方向和采集距离造成的系统误差。 ADC3准同步采集混合像元图像信息计算所得典型指数从微观尺度和空间上更好地证实了混合像元主要出现在地类边界处, 这对于利用宏观遥感数据及典型植被指数进行地物分类也具有一定的启示性。
The authors have declared that no competing interests exist.
| [1] |
|
| [2] |
|
| [3] |
|
| [4] |
|
| [5] |
|
| [6] |
|
| [7] |
|
| [8] |
|
| [9] |
|
| [10] |
|
| [11] |
|
| [12] |
|
| [13] |
|
| [14] |
|
| [15] |
|
| [16] |
|
| [17] |
|
| [18] |
|
| [19] |
|
| [20] |
|