基于超限学习机算法的空间目标材质多色测光识别研究
李鹏1, 李智2, 徐灿2, 方宇强2, 张峰1
1. 航天工程大学研究生院, 北京 101416
2. 航天工程大学, 北京 101416

作者简介: 李 鹏, 1990年生, 航天工程大学研究生院博士研究生 E-mail: 693078757@qq.com

摘要

随着各国航天活动的增多, 空间目标的数量和种类不断增加, 对空间目标进行编目识别是各国空间目标监视领域的重要研究内容。 对空间目标进行识别, 主要是为了获得其表面材质、 姿态、 形状、 关键载荷等信息, 而表面材质信息的获取是开展目标光学特性及状态认知研究的基础。 搭建空间目标表面材质多色测光测量系统, 整套系统部署在光学暗室内, 以减少杂散光对测量结果的影响。 光源采用太阳模拟器, 光谱等级A级; 探测器采用美国ASD公司生产的FieldSpec4地物光谱仪, 波长范围350~2 500 nm, 光谱分辨率1 nm, 光纤置于电控转台上, 能对待测样片实现不同观测几何下的测量。 利用Johnson-Cousins UBVRI五色分光系统对8种常用表面材质(砷化镓、 氧化铝、 氧化聚酰亚胺薄膜、 黑漆、 环氧漆、 镀铝聚酰亚胺薄膜、 钛青蓝漆、 白漆)在不同观测几何条件下的10种色指数数据进行实验测量,每种色指数分别测得30组实验数据。 采用传统的1-sigma不确定框方法(即对于给定材质的若干组实验数据,计算其每种色指数的平均值和标准差,以平均值为中心, 以标准差的两倍为边长画出色指数不确定框), 在最理想的识别情况下, 通过R-I和B-R色指数不确定框能对砷化镓、 氧化铝、 氧化聚酰亚胺薄膜、 钛青蓝漆四种材质进行识别; 利用B-V和B-R色指数不确定框可以将环氧漆、 白漆识别出来, 剩余两种材质黑漆和镀铝聚酰亚胺薄膜无法通过以上色指数进行识别。 但是1-sigma不确定框方法存在两个主要问题: 一是需要知道待测材质对特定波段敏感的先验信息, 来确定所用的色指数类型; 二是识别率容易受测试样本数量的影响, 可靠性差。 超限学习机算法是一种利用随机化隐层节点和和最小二乘求解方式进行训练的机器学习算法, 具备学习效率快, 泛化性能好, 不容易陷入局部最优解等优势, 被广泛应用于对数据的分类和回归分析中。 因此引入超限学习机算法, 将色指数数据按照2:1的比例随机分为训练样本和测试样本, 共进行三次随机试验。 在训练样本中, 对每种材质按照1:8的顺序进行编号, 即编号1:8的测试样本分别有20个, 分别包含10种色指数数据; 在测试样本中同样对其按照已知归属材质对应编号。 采用决定系数和计算时间作为判断ELM算法准确性和实时性的判断指标。 结果表明: 无论是对单一材质进行识别, 还是对所有测试材质样本, 训练样本决定系数在0.98以上, 测试样本决定系数在0.96以上, 每次试验中最多有3组色指数数据无法识别; 所需总时间最长在0.07 s内完成, 甚至可以达到0.002 s, 识别效率和可靠性远高于传统的1-sigma不确定框法, 表明ELM算法能对空间目标常用材质进行准确快速识别。 相关研究可为空间非合作目标的外形、 姿态等状态信息反演提供技术支持。

关键词: 空间目标; 材质识别; 多色测光; 色指数; 超限学习机
中图分类号:O433.1 文献标志码:A
Research on Space Object’s Materials Multi-Color Photometry Identification Based on the Extreme Learning Machine Algorithm
LI Peng1, LI Zhi2, XU Can3, FANG Yu-qiang2, ZHANG Feng1
1. Graduate School, Space Engineering University, Beijing 101416, China
2. Space Engineering University, Beijing 101416, China
Abstract

With the increase of space activities in various countries, the number and variety of space objects also gradually increased. How to identify and catalog the space object is a critical research issue in the field of space object surveillance for different countries. The research on non-cooperative space object mainly aims to get the information like surface materials, attitude, shape and critical payload information. And the acquisition of surface materials information is the basis for researching space object optical characteristics as well as state recognition. A multi-color photometric measurement system for space object’s surface materials is set up. To reduce the influence of stray light on the measurement results, the entire system is deployed in an optical darkroom. The light source adopts a solar simulator with spectral grade level A. The detector uses a FieldSpec4 spectrometer manufactured by the ASD company in America. The wavelength range is 350~2 500 nm, and the spectral resolution is 1 nm. The spectrometer’s optical fiber is located on the electrically controlled turntable, which can be able to simulate different observation geometry to obtain various data for the same sample. By using Johnson-Cousins UBVRI five-color spectroscopy system, ten kinds of color-index data of eight common surface materials (e.g.,GaAs,anodic Al,anodic Kapton, black paint, epoxy paint, aluminized Kapton, titanium blue paint, white paint) under different observation geometry conditions are measured. And every color-index data includes 30 groups of experimental data. Through the traditional 1-sigma uncertainty box method (namely,for a given material with several groups of experimental data,calculating the mean value and standard deviation for each kind of color-index. Then drawing color-index uncertainty box,based on the mean value as rectangle center and twice of standard deviation as the side length), in the ideal identification situation, four kinds of materials (GaAs,anodic Al,anodic Kapton,titanium blue paint) can be identified through the R-I and B-R color index uncertainty box. Two kinds of materials(epoxy paint,white paint) can be determined through the B-V and B-R color index uncertainty box. That above color-index cannot identify the remaining two materials (black paint and aluminized Kapton); however,there are two main problems in using 1-sigma uncertainty box method. The first one is that it is necessary to know the prior information about which band that the test materials are sensitive to,so as to determine which kind of color-index to be used. The other problem is that the identification rate is easily affected by the number of test samples and has poor reliability. The extreme learning machine (ELM) is a kind of machine learning algorithm that uses randomized hidden layer nodes and least-squares method to train data. The algorithm has the advantages of learning efficiency, good generalization performance and not easily falling into optimal local solution. It is widely used in the data classification and regression analysis. Therefore, the ELM algorithm is introduced to solve the problem. Color-index data are randomly divided into a training dataset and testing dataset according to the proportion of 2:1. A total of three random experiments are carried out. Each kind of material is numbered in the order of 1:8 in the training dataset, namely, each number from 1 to 8 has 20 groups color-index data respectively, and each group includes ten kinds of color-index data. As for the training dataset, the same number is assigned to the material according to the known attribution materials type. Regard determination coefficient and calculating time as the judgment indicators to judge the accuracy and real-time capability of ELM algorithm. The results show that: whether identify the single kind of material or all testing dataset, the determination coefficient of training dataset is all above 0.98 and determination coefficient of the testing dataset is above 0.96, meaning that at most three groups color-index data cannot be identified in each experiment. In the aspect of calculating time, the total time can be completed within 0.07 s, even up to 0.002 s. The identification efficiency and reliability are much higher than the traditional 1-sigma uncertainty box method, which shows that the ELM algorithm can accurately and quickly identify space object’s surface materials. Relevant research can provide technical support for state information inversions such as shape, attitude and critical payloads of space objects.

Keyword: Space object; Material identification; Multi-color photometry; Color-index; Extreme learning machine
引 言

空间目标表面材质信息是反演形状、 姿态和关键载荷的重要输入参量[1, 2], 因此对其表面材质进行识别研究具有重要意义。

对空间目标进行观测识别, 主要采用基于时间序列的测光观测, 基于同时性的多色测光观测和基于低色散的光谱观测三种非成像技术[3]。 其中基于时间序列的测光观测由于每次观测的太阳-目标-测站的方位不同, 得到的光度曲线具有独立性, 增加了从光度曲线中提取更多有效材质信息的难度; 基于低色散的光谱观测能较精确地根据每种材质的特有吸收峰去匹配光谱数据库, 但是对空间目标光谱观测时定标难度大, 测量每种材质建立数据库需要时间较长, 数据存在冗余问题, 这也一定程度限制了光谱观测的应用[4]。 基于同时性的多色测光对空间目标进行识别时, 并不依赖于目标的位置和姿态信息, 而是主要依靠目标的表面材质组成, 相比光谱观测可以有效降低数据量, 减少计算的复杂程度, 选用合适的滤光片, 确定目标的色指数分布范围, 可以在一定程度上作为光谱观测的替代方法。 Hejduk等采用1-sigma不确定框法利用色指数数据对16种常用空间目标表面材质进行识别, 但是该方法对其中四种材质(多层隔热材料和太阳能电池片, 电路板和铝片)无法进行识别。 NASA光学测量中心CCD相机采用标准的Johnson/Bessell BVRI滤光片, Cowardin等选用V波段对涂抹灰色和白/橙色喷漆的两个火箭箭体在三种不同旋转状态下的光度特性进行分析。 Payne[8]提出利用色指数修正被错误识别的相邻地球同步轨道(geosynchronous earth orbit, GEO)卫星。 国家天文台赵晓芬[5]等利用兴隆观测站0.6/0.9 m施密特望远镜对4颗GEO卫星的亮度和色指数进行对比研究, 发现不同外形和材质的GEO卫星亮度和色指数差距较大。 当望远镜滤光片数量从10个减少到5个时, GEO卫星的识别率降低。

近两年出现将机器学习和空间目标识别两个领域的交叉融合。 2015年, Howard团队对不同目标的光度特性进行仿真, 利用不同机器学习算法实现空间目标分类[6, 7]。 2016年, 美国数值分析公司开发Athena数据驱动系统, 搜集目标历史光度数据, 利用机器学习新的光度数据, 自动辨识目标的异常行为[7, 8]。 鉴于机器学习在空间目标识别中广泛应用前景, 本研究选用超限学习机(extreme learning machine, ELM)算法对空间目标材质进行识别, 利用搭建的色指数测量系统, 对空间目标表面常用的8种材质(砷化镓、 氧化铝、 氧化聚酰亚胺薄膜、 黑漆、 环氧漆、 镀铝聚酰亚胺薄膜、 钛青蓝漆、 白漆)色指数进行测量计算, 建立基于色指数数据的ELM分类模型, 进行材质识别。

1 空间目标表面材质色指数实验测量计算

在光学暗室内搭建了一套多色测光测量系统, 如图1所示, 主要包括光源、 光谱探测器、 电控转台、 数据处理系统和材质样片。 光源采用太阳模拟器, 光谱等级A级, 目标处辐照度为0.1个太阳常数; 光谱探测器采用美国ASD地物光谱仪, 波长范围350~2 500 nm, 分辨率1 nm; 转台选用北光世纪公司的电控旋转台, 角分辨率0.1° 。 样片固定在转台支架上, 采用10° 视场角镜头, 既保证视场内充满样片, 又保证进入视场内的杂散光最少。

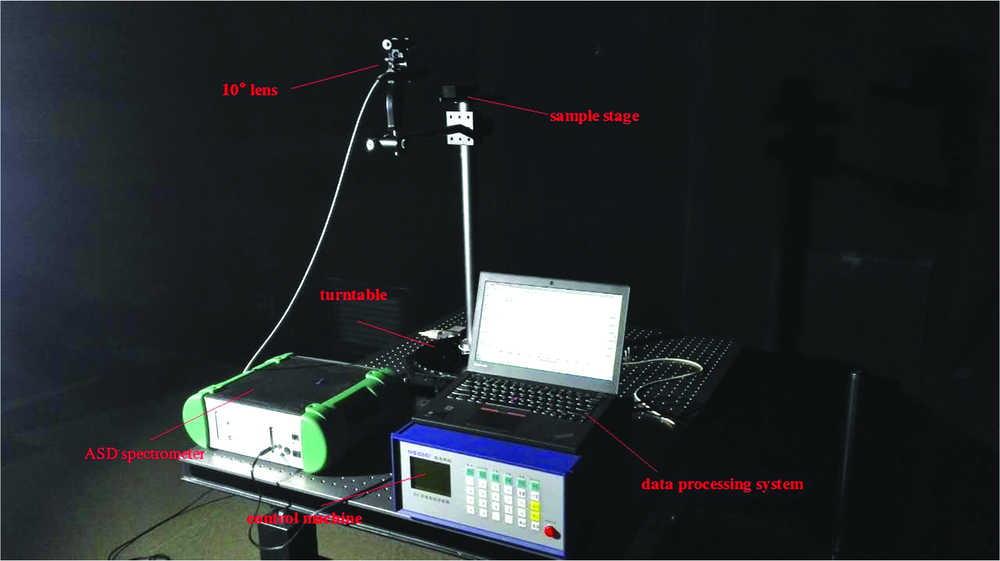
图1 空间目标表面材质多色测光测量系统Fig.1 The multi-color photometric measurement system of space object’ s surface materials

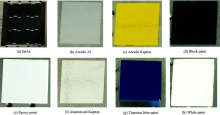
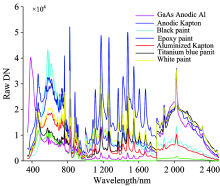
在对材质光谱反射率进行测量时, 样片垂直于光学平台摆放, 保证入射光线、 样片法线、 反射光线在同一水平面上。 入射角固定45° , 考虑到不同材质的镜反射和漫反射特性, 对砷化镓、 氧化铝、 氧化聚酰亚胺薄膜、 镀铝聚酰亚胺薄膜反射角测量范围38° ~52.5° , 间隔0.5° ; 其余四种材质反射角范围31° ~60° , 间隔1° , 每个材质样片进行30组测量。 实验测量样片和结果如图2和图3所示。

图2 测量样片实拍图Fig.2 Pictures of test materials

图3 测量样片光谱曲线Fig.3 Spectral curve of test materials

按照Johnson-Cousins UBVRI分光系统滤光片透过率对全波段数据进行滤光处理, 设原始的RawDN数据为Raw_DN, 蓝色和红色滤光片透过率分别为TblueTred, 则经过滤光片滤光后的蓝光BDN和红光RDN如式(1)所示[9]

BDN=Raw_DNTblueRDN=Raw_DNTred(1)

根据ASD光谱仪技术使用手册, 由DN数据得到辐照度公式为

E=ElampRcalDNinputTinputDNcalTcal(2)

式(2)中, Elamp是ASD定标灯的辐照度, Rcal是标准板聚四氟

乙烯(F4)的光谱反射率, DNcal是10° 镜头的定标像元亮度数据, Tcal是10° 镜头定标时的积分时间或增益(在350~1 000 nm为积分时间, 1 001~2 500 nm为增益), DNinput是10° 镜头接收到的待测材质像元亮度数据, Tinput是积分时间或增益。 对于同一台ASD光谱仪, Elamp, Rcal, DNcal, Tcal均由ASD公司在350~2 500 nm波段进行出厂标定, 是随波长变化的量, 不随测量角度和材质发生变化, 因此由式(1)和式(2)可得蓝光和红光波段辐照度EBER比值为

EBER=ElampRcalBDNTB_inputDNcalTcalElampRcalRDNTR_inputDNcalTcal=BDNTB_inputRDNTR_input(3)

式(3)中, TB_inputTR_input分别是蓝光和红光波段的积分时间。

根据普森公式

mB-mR=-2.5logEBER(4)

式(4)中, mb表示蓝光波段的星等, mr表示红光波段的星等, mb-mr即为B-R色指数。

同理可以得到U-B, U-V, U-R, U-I, B-V, B-I, V-R, V-I和R-I等共10个色指数。

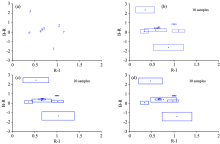
图4给出的是8种测试材质的R-I和B-R, B-I和U-R色指数分布图。

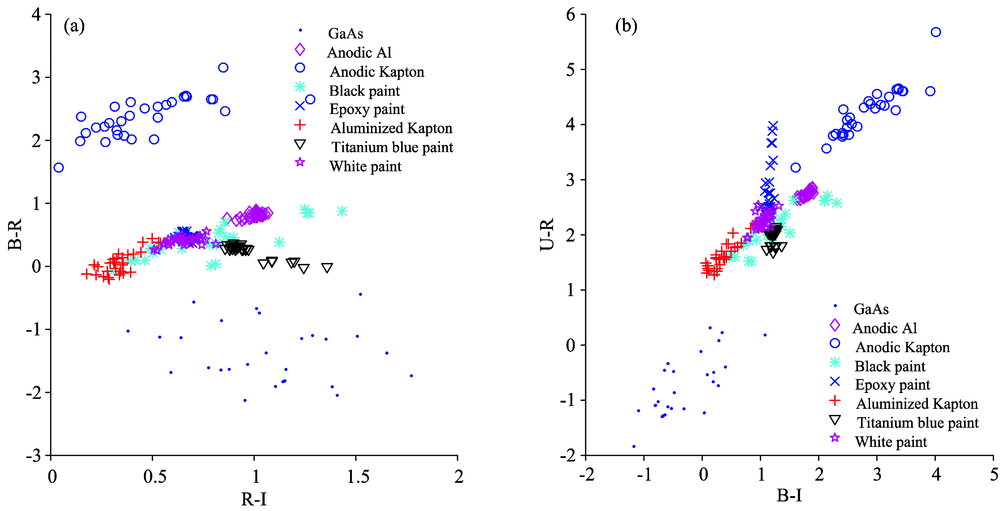
图4 测试材质色指数分布图
(a): B-I, B-R色指数分布图; (b): B-I, U-R色指数分布图
Fig.4 Test materials color-index scattergram
(a): B-I, B-R color-index scattergram; (b): B-I, U-R color-index scattergram

从图4可以看出, 阳极化聚酰亚胺膜和GaAs与其他材质色指数分布没有重叠区域, 容易区分; 其余六种材质特别是黑漆、 环氧漆和白漆色指数分布集中, 无法通过人工识别。

2 1-sigma不确定框方法

有研究提出利用1-sigma不确定框方法对材质进行分类识别, 采用R-I, B-R, B-V三种色指数。 以R-I, B-R色指数不确定框为例: 给定一组材质色指数测试样本, 计算每种材质R-I, B-R色指数的平均值mR-I, mB-R和标准差σ R-I, σ B-R, 以平均值(mR-I, mB-R)为中心, 2σ R-I为长, 2σ B-R为宽画出R-I, B-R色指数的1-sigma不确定框。

将待测材质样本进行编号, 如表1所示。

表1 实验测试材质编号 Table 1 Test materials unmber in the laboratory

1-sigma不确定框方法结果如图5和图6所示。
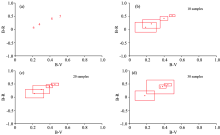
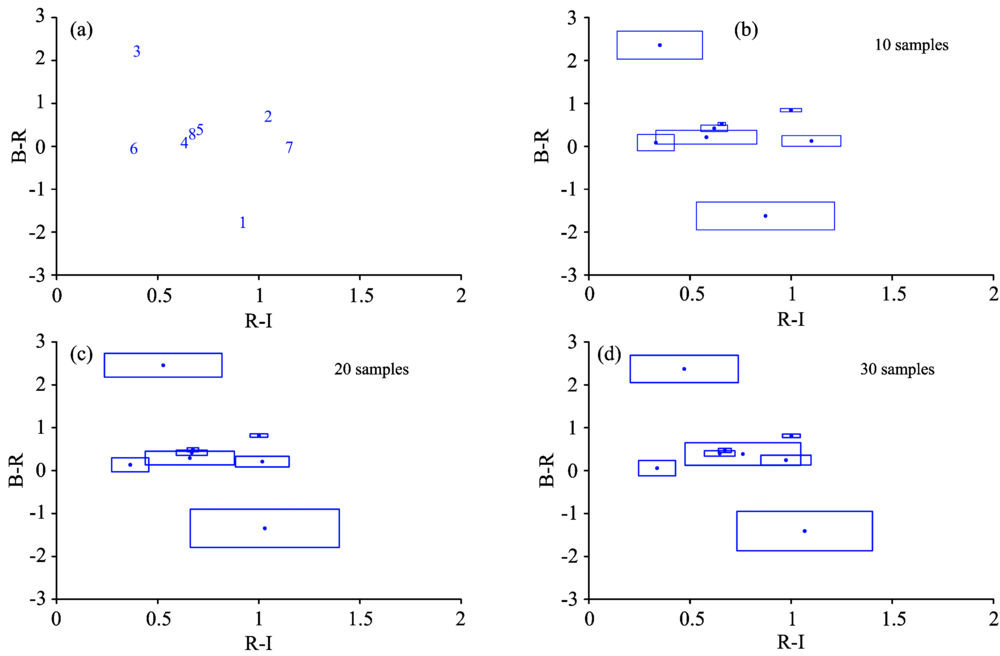
图5 不同测试样本R-I, B-R不确定框
(a): B-I, B-R色指数不确定框中心; (b): 10个测试样本时B-I, B-R色指数不确定框; (c): 20个测试样本时B-I, B-R色指数不确定框; (d): 30个测试样本时R-I, B-R色指数不确定框
Fig.5 Change in B-I, B-R color-index uncertainty volumes with numbers of samples for test materials
(a): The centres of R-I, B-R color-index uncertainty volumes; (b): B-I, B-R color-index uncertainty volume with 10 samples; (c): B-I, B-R color-index uncertainty volume with 20 samples; (d): B-I, B-R color-index uncertainty volume with 30 samples

图6 剩余四种材质B-V, B-R不确定框
(a): B-V, B-R色指数不确定框中心; (b): 10个测试样本时B-V, B-R色指数不确定框; (c): 20个测试样本时B-V, B-R色指数不确定框; (d): 30个测试样本时R-V, B-R色指数不确定框
Fig.6 Change in B-V, B-R color-index uncertainty volumes with numbers of samples for remain 4 kinds of test materials
(a): The centres of B-V, B-R color-index uncertainty volumes; (b): B-V, B-R color-index uncertainty volume with 10 samples; (c): B-V, B-R color-index uncertainty volume with 20 samples; (d): B-V, B-R color-index uncertainty volume with 30 samples

从图5和图6可以看出, 当采用1-sigma不确定框方法时, 在最理想的识别情况下(测试样本数量为10时), 能够利用R-I, B-R色指数对砷化镓、 氧化铝、 氧化聚酰亚胺薄膜、 钛青蓝漆进行识别, 利用B-V, B-R色指数可以将环氧漆、 白漆识别出来, 剩余两种黑漆和镀铝聚酰亚胺薄膜无法通过以上色指数进行识别, 解决方法可以通过继续寻找其他色指数进行试验分析, 或者通过文献[6]中基于太阳辐射光压估计材质面质比的方法进行识别。 可以得出结论: 利用1-sigma不确定框方法能依据部分材质对某些特定波段敏感的特点, 选用相关色指数进行识别, 但是识别效率会受样本采样数量的影响, 可靠性差。

3 超限学习机算法
3.1 ELM算法

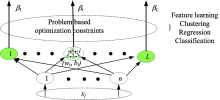
超限学习机算法是Huang[9]提出的一类新兴的机器学习方法。 不同于传统神经网络采用反向传播算法求解, ELM利用随机化隐层节点和和最小二乘求解方式进行训练, 避免网络权值反复迭代调整, 具备学习效率快, 泛化性能好, 不易陷入局部最优解等优势, 被广泛应用在目标分类识别领域[10]

ELM算法流程为:

给定训练样本 N={(xi, ti)|xiRn, tiRm, i=1, 2, , N}, 隐层激活函数hi(x), 正则项系数C;

(1): 根据任意连续概率分布函数随机生成输入权重wi和隐层偏置bi(i=1, 2, …, L);

(2): 计算隐层输出矩阵H;

(3): 计算输出权重矩阵β

ELM网络结构如图7所示。

图7 超限学习机网络结构示意图Fig.7 Schematic diagram of ELM network structure

3.2 模型验证与精度分析

为验证ELM算法在空间目标材质色指数识别中的实时性和准确性, 采取以下指标作为模型检验的依据: 训练时间TTest、 训练样本决定系数 RTest2、 测试时间Ttrain、 测试样本决定系数 RTrain2。 其中TTestTtrain是计算速度指标, R2用于模型预测精度的评价估计, 其值介于0~1之间, R2越接近于1说明模型拟合精度越高。

每种材质测试样本为30, 按照2: 1的比例随机划分为训练样本和测试样本, 共进行三次随机试验, 每个样本中均包含10种色指数数据信息。 在训练样本中, 对每种材质进行编号, 顺序为1: 8; 在测试样本中, 同样对其按照已知归属材质对应编号。 设定激活函数为高斯函数, 正则项系数C=1, 8种材质的模型预测结果见表2

表2 ELM模型验证精度统计 Table 2 Verification accuracy statistics of ELM algorithm

表2可以看出: 对单一材质分类, 白漆测试样本决定系数为0.8或者0.9, 表明存在2组或1组色指数数据不能被正确识别; 黑漆和环氧漆测试样本决定系数为0.9, 有1组没有被正确识别; 所需总时间最长在0.07 s内完成, 甚至可以达到0.002 s, 计算速度快; 训练样本决定系数 RTest2在0.98以上, 测试样本决定系数 RTrain2在0.96以上, 最多有3组色指数不能识别, 表明ELM算法对材质识别分类精度高。

4 结 论

空间目标材质识别是目标状态信息反演的基础。 国外已经对16种空间目标常用材质基于色指数数据进行分类识别, 并将研究成果进一步应用到空间目标识别中。 本研究以空间目标常用的八种表面材质为对象, 利用多色测光技术, 将ELM算法应用到材质识别中来。 结果表明: 利用色指数信息, 相比传统的1-sigma不确定框法, ELM算法能够实现对空间目标表面材质的准确快速识别。 下一步研究工作中, 应将机器学习进一步应用到对复杂空间目标的信息反演中来, 基于数据驱动的思想解决复杂目标外形、 姿态反演中存在的速度慢、 时效性差、 精度低等问题。

The authors have declared that no competing interests exist.

参考文献
[1] Fulcoly D O, Kalamaroff K I, Chun F K. Journal of Spacecraft and Rockets, 2012, 49(1): 76. [本文引用:1]
[2] Linares R, Leve F A, Jan M K, et al. Adv. Astronaut Sci. , 2012, 144: 41. [本文引用:1]
[3] XU Can, ZHANG Ya-sheng, ZHAO Yang-sheng, et al(徐灿, 张雅声, 赵阳生, ). Spectroscopy Spectral Analysis(光谱学与光谱分析), 2017, 37(3), 672. [本文引用:1]
[4] Jin Xiaolong, Tang Yijun, Sui Chenghua. Optics and Electronics, 2013, 40(12): 44. [本文引用:1]
[5] Zhao X F, Zhang H Y, Yu Y, et al. Advances in Space Research, 2016, 58(11): 2269. [本文引用:1]
[6] Howard M, Klem B, Gorman J. Advanced Maui Optical and Space Surveillance Technologies Conference. Kihei: Maui Economic Devepment, 2015. [本文引用:2]
[7] WANG Yang, DU Xiao-ping, FAN Chun-lin(王阳, 杜小平, 范椿林). Chin. Sci. Bull. (科学通报). 2017, 62: 1578. [本文引用:2]
[8] Singh N, Horwood J T, Aristoff J M, et al. In: Proceedings of the 26th AAS/AIAA Space Flight Mechanics Meeting, Napa: AIAA, 2016. [本文引用:2]
[9] Huang G B, Zhou H, Ding X, et al. IEEE Transactions on Systems, Man, and Cybernetics, Part B (Cybernetics), 2012, 42(2): 513. [本文引用:2]
[10] ZHANG Dong-hai, LI Gui-rong, LI Ruo-cheng, et al(张东海, 李贵荣, 李若诚, ). Laser and Optoelectronics Progress(激光与光电子学进展), 2013, 50(4): 183. [本文引用:1]