不同含水量黑土土壤光谱反射率半经验模型构建
[袁静1, 2  , 王鑫
, 王鑫1, 2 , 颜昌翔1, * ]
, 王鑫]
|
|


作者简介: 袁 静, 1993年生, 中国科学院长春光学精密机械与物理研究所博士研究生 e-mail: 15543665143@163.com
土壤含水量的变化情况与时空分布对热量平衡、 农业墒情等具有显著的影响。 利用反射率光谱信息反演土壤含水量的研究, 可为实现土壤含水量速测、 揭示土壤含水量时空变异规律提供科学依据。 构建不同含水量黑土土壤反射率光谱半经验模型, 深入探究土壤重量含水量与反射率光谱的关系。 制备了12种不同湿度的土壤样品。 采用ASD Field Spec Pro 3地物波谱仪对制备的不同湿度梯度的黑土土壤进行反射率光谱测量。 利用菲涅耳反射率建立土壤表面反射模型; 在以往的研究中, Kubelka-Munk (KM)模型中的漫反射率 R∞通常被视为对于给定材料和照明波长的常数或需要反演的参数。 通过研究发现, 漫反射率 R∞不仅与材料和波长有关, 还与土壤含水量相关。 利用与土壤含水量相关的吸收系数及散射系数描述了土壤含水量与漫反射率 R∞的关系, 并基于KM理论对体散射分量进行建模; 进而构建不同含水量黑土土壤反射率光谱半经验模型。 根据实际测量数据选用最小二乘算法对模型参数进行反演, 并通过分析反演参数简化模型。 最后, 将未参与建模的不同含水量梯度的数据代入模型中, 验证模型的有效性。 结果表明: 对比不同含水量土壤反射率光谱的模拟值与实测值在400~2 400 nm波段范围内的模拟精度发现, 含水量为200 g·kg-1的土壤反射率光谱的均方根误差最大, 为0.008, 含水量为40 g·kg-1的土壤反射率光谱的均方根误差最小, 为0.000 6, 不同含水量下土壤样品反射率光谱的均方根误差的均值是0.005 1。 在400~2 400 nm波段范围内, 不同波长下黑土土壤反射率光谱的预测均方根误差基本低于0.008, 1 920 nm波长处的预测均方根误差最小, 为0.002 062。 采集长春地区的土壤检验模型的可靠性, 配制15个不同含水量样品并对其进行反射率光谱测量。 选取9个样品数据用于建模, 6个样品数据用于验证。 结果表明: 在400~2 400 nm波段范围内, 不同波长下的长春土壤反射率光谱的预测均方根误差基本低于0.015, 525 nm波长处的预测均方根误差最小, 为0.000 922 5。 综上所述, 所建立的模型具有很高的预测精度, 可很好地适用于不同含水量黑土土壤反射率光谱的模拟。
The variation and the spatial-temporal distribution of soil moisture content have significant effects on heat balance, agricultural moisture, etc. Research on the inversion of soil moisture content using reflectance spectral information can provide a theoretical basis for realizing rapid test of soil moisture content and revealing the spatial-temporal variation of the soil moisture content. In this paper, a semi-empirical model of reflectance spectral of black soil with different moisture content was built to thoroughly explore the relationship between the soil moisture content and the reflectance spectral. First, 12 soil samples with different moisture contents were prepared. Secondly, reflectance spectral of the black soil with different moisture content gradients was measured by ASD Field Spec Pro 3 spectrometer. Then, the soil surface reflection model was built by using the Fresnel reflectivity; In previous studies, the diffuse reflectance in the Kubelka-Munk (KM) model was often considered as a constant for a given material and illumination wavelength or a parameter that needed to be inverted. It has been found through research that diffuse reflectance is related not only to material and wavelength, but also to soil water content. By using the absorption and scattering coefficients which related to the soil moisture content, this model described the relationship between the soil moisture content and the diffuse reflectance. Besides, a model of volume scattering component was built based on KM theory; Furthermore, a semi-empiricalmodel of reflectance spectral of black soil with different moisture content was built. Next, according to the measurement data, the least squares algorithm was used to invert the model parameters, and the model was simplified by analyzing the inversion parameters. Finally, the data of different moisture content gradients that were not used for modeling were substituted into the model to verify the validity of the model. The results showed that compared with the spectral simulation accuracy in the range of 400~2 400 nm under different moisture contents, the root mean square error (RMSE) of reflectance spectra of soil with moisture content of 200 g·kg-1 is 0.008 which is the largest, and the RMSE of reflectance spectra of soil with moisture content of 40 g·kg-1 is 0.000 6 which is the smallest, the mean value of the RMSE of reflectance spectraof soil under different moisture contents is 0.005 1. In the range of 400~2 400 nm, the root mean square error of prediction (RMSEP) of black soil reflectance spectra at different wavelengths is generally less than 0.008. The RMSEP at 1 920 nm band is 0.002 068 which is the smallest. The soil in Changchun was collected to test the reliability of the model, and reflectance spectra of 15 soil samples with different moisture content were measured. Six samples were selected for model validation, and the remaining samples were selected as a calibration dataset for model calibration. The results showed that in 400~2 400 nm band, the RMSEP of reflectance spectra at different wavelengths is generally less than 0.015. The RMSEP at 525 nm band is 0.000 922 5 which is the smallest. In conclusion, the established model has a high prediction accuracy and can be well applied to simulate the reflectance spectra of black soil with different moisture contents.
我国是一个旱灾频发的国家, 土壤含水量严重影响着土壤的理化性质及植被的生长, 监测土壤含水量对农作物估产、 旱情监测和蒸散量起到决定性作用[1]。 相对于传统的定点监测方法, 利用遥感技术可以实现对土壤含水量大面积实时动态监测。 目前, 土壤水分遥感监测主要采用四类研究方法, 即热惯量法、 微波遥感法、 植被指数法、 高光谱遥感法。 热惯量法是基于物理原理开发的, 具有较好的重复性、 准确性和同一性, 但是土壤湿度和表面温度之间的关系高度依赖于气象条件, 例如风速, 气温及湿度[2]; 微波遥感利用后向散射反演公式或极化信息得到土壤含水量, 监测精度较高, 不受光照条件限制, 但空间分辨率不高, 反演结果的空间分布精度及数值精度不高; 植被指数法在一定的误差范围内能较好的反演土壤含水量, 但是只适用于植被覆盖下的土壤水分监测。 高光谱遥感具有几十至上百个波段, 能探测到宽波段无法监测的物质。 因此, 高光谱遥感在反演土壤含水量的应用引起了研究者们的重视[3, 4, 5, 6]。
利用与土壤含水量相关的吸收系数及散射系数建立了土壤含水量与漫反射率R∞ 的关系, 并基于KM理论对体散射分量进行建模, 提出了一个半经验模型, 并结合实测数据验证了模型的有效性和可靠性。 该模型可直接描述土壤含水量与反射率光谱的关系。
重量含水量是指土壤中水分重量与干土重量的比值, 本文中的土壤含水量皆指重量含水量。 土壤样品均来自同一采样点为黑龙江省典型黑土区(东经126.539, 北纬47.619)的黑土土壤。 土壤有机质: 34.65 g· kg-1, 粘粒: 23.96%。 将研磨过200目筛的黑土土壤烘干, 取100 g干土装入样品盒中, 在对每个土壤样品喷洒蒸馏水时, 边喷水边搅拌。 将喷水后的土壤样品放在密封性好的密封袋中, 静置24 h, 使黑土土壤充分均匀吸收水分。 共制备了12种不同湿度的土壤样品。
在暗室内采用ASD Field Spec Pro 3地物波谱仪对不同湿度黑土土壤进行光谱测量。 测试前把土壤样本表面刮、 压平整, 使土壤表面粗糙度尽量一致。 光源为30 W的卤钨灯, 入射天顶角为30° , 以减小土壤粗糙度造成的阴影影响。 1° 视场角的传感器探头在土壤上方15 cm处。 测试之前先去除暗电流的影响, 利用白色参考板进行反射率校正。 每个土样采集10条光谱曲线, 算术平均后得到该土壤样品的实际反射光谱数据。
Le Hors等定义表面反射率为
式中Ri为菲涅耳反射率, θ i为入射天顶角, θ r为探测天顶角, θ 0是表面粗糙度和波长的函数。
在空气-土壤界面处, 菲涅耳反射率与土壤含水量呈正比, 菲涅耳反射率为[7]
式中nwater为水的折射率, 约为1.33; nair为空气的折射率, 约为1。 所以土壤表面反射率为
土壤漫反射率可以由式(4)表示[8]
式中k为吸收系数, s为散射系数。 通过公式变换, r=
在以往的研究中, 漫反射率R∞ 通常被视为对于给定材料和照明波长的常数或需要反演的参数。 而式(5)表明变量R∞ 与r可互相表示, k和s是土壤颗粒特征和土壤含水量的函数。 因此, 认为变量R∞ 和r是估测土壤含水量的敏感变量。
一个常用且有效的假设: 混合介质的吸收系数、 散射系数可看作按其成分比例加权的吸收和散射系数的简单和函数。 基于这个假设, 可以将土壤表面的k和s描述为
其中, θ 为土壤含水量, ksolid为土壤颗粒的吸收系数, kwater为土壤水分的吸收系数, ssolid为土壤颗粒的散射系数, swater为土壤水分的散射系数。 当式(6)和式(7)中土壤含水量θ =θ 1时, 此含水量下土壤的k及s可表示为
结合式(5)— 式(9), 可得
结合式(5)将等式(10)右侧的分子及分母同时除以s1, 得
其中: a1=
Le Hors在KM[8]理论的基础上, 引入Rd来描述体散射分量的大小[9]
式中Ri为入射光从空气中照射到物体表面的菲涅耳反射率, k2为物体表面与空气之间散射光的菲涅耳反射率, 通常情况下k2=Ri, 漫反射率
综上所述, 含水土壤的总反射率为
其中
所建模型有三个未知参数, 选用最小二乘算法进行参数反演。 随机选取8个样品数据用于建模, 所选取的R1为含水量θ 1=40 g· kg-1土壤的反射率。 在400~2 400 nm波段下对应的参数反演结果如图1所示, 图1(a)为土壤水分吸收与含水量为40 g· kg-1土壤散射的相对强度示意图, 其光谱趋势与William Philpot[8]得到的土壤水分吸收光谱趋势一致。
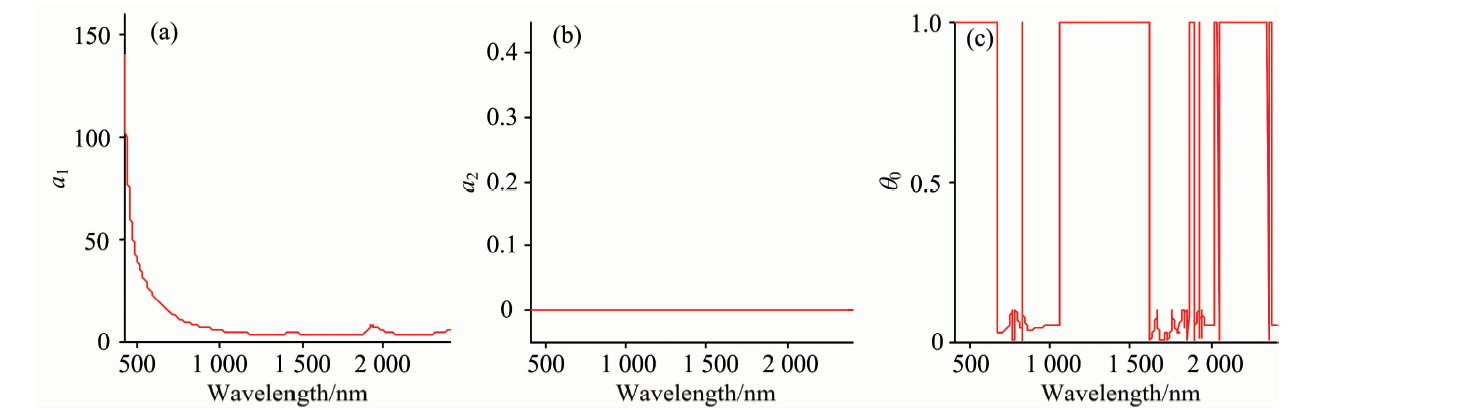 | 图1 不同波长下的反演参数 (a): a1; (b): a2; (c): θ 0Fig.1 Inversion parameters at different wavelengths (a): a1; (b): a2; (c): θ 0 |
如图1(b)所示, 在400~2 400 nm波段下, a2=0, 这主要是因为土壤水分的吸收很强, 以至于土壤水分的散射很微弱, 当其与含水土壤散射对比时可忽略。 因此, 该模型只含有两个未知参数, 式(14)和式(15)可简化为
其中
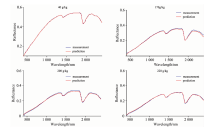
为了验证模型的有效性, 将未参与建模的数据代入模型中。 土壤反射率光谱模拟结果如图2所示, 模型模拟值与实测值拟合程度较高。 因此, 所建模型可以作为黑土土壤含水量反演研究的理论参考依据。
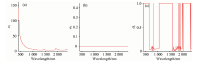
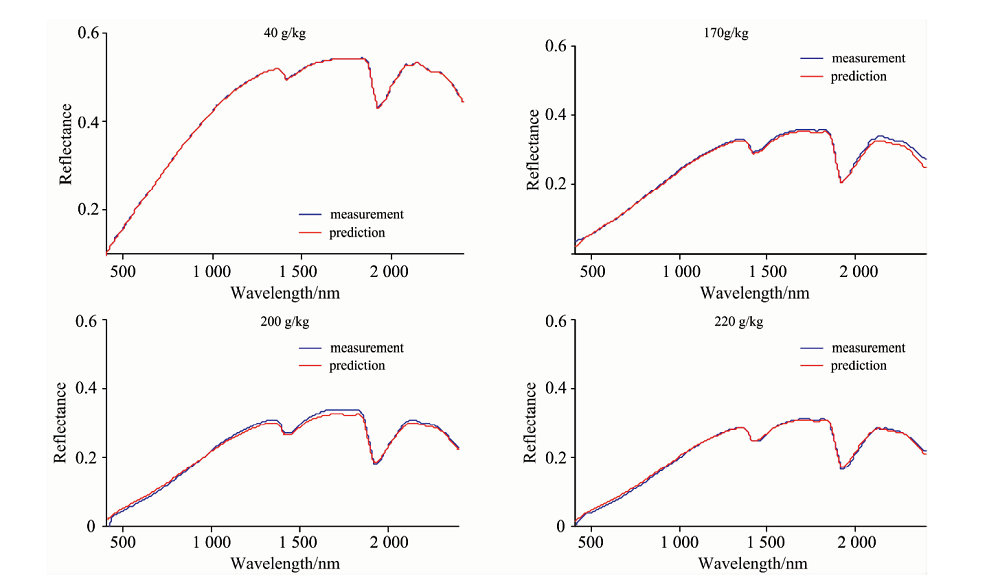 | 图2 不同含水量土壤反射率光谱模拟结果Fig.2 Simulation results of reflectance spectra of soil with different moisture contents |
表1为不同含水量黑土土壤验证样品反射率光谱的实测值与模拟值在400~2 400 nm波段内的均方根误差(RMSE)。 对比不同含水量情况下的光谱模拟精度可以发现, 含水量为200 g· kg-1的RMSE最大, 为0.008, 含水量为40 g· kg-1的RMSE最小, 为0.000 6, 4个不同含水量下的平均RMSE是0.005 1, 说明该模型适合对不同含水量的土壤进行反射率光谱模拟。
| 表1 不同含水量黑土土壤反射率光谱的RMSE Table 1 RMSE of reflectance of black soil with different moisture contents |
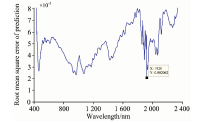
图3为在400~2 400 nm波段, 不同波长黑土土壤光谱反射率的RMSEP示意图, 从图中可以看出, RMSEP基本低于0.008, 1 920 nm波长处的RMSEP最小, 为0.002 062。 由此可见, 模型具有很高的预测精度。
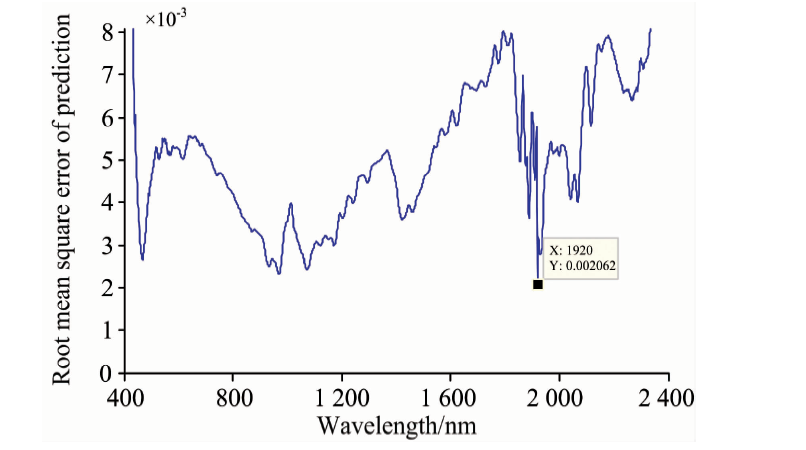 | 图3 不同波长下黑土土壤反射率光谱的预测均方根误差(RMSEP)Fig.3 RMSEP of black soil spectral reflectance at different wavelengths |
为了进一步验证模型的可靠性, 采集长春地区的土壤配制15个不同含水量梯度并对其进行反射率光谱测量。 选取9个样品数据用于建模, 6个样品数据用于验证。 经计算得知: 6个不同含水量下的平均RMSE是0.008 55。 400~2 400 nm波段内的RMSEP基本低于0.015, 525 nm波长处的RMSEP最小, 为0.000 922 5。
利用与土壤含水量相关的k及s描述了土壤含水量与漫反射率R∞ 的关系, 并基于KM理论对体散射分量进行建模, 构建了不同含水量黑土土壤反射率光谱半经验模型, 深入探究土壤重量含水量与反射率光谱的关系。 分别用黑龙江省典型黑土区的黑土土壤与来自长春的土壤验证模型的有效性及可靠性。 结果表明, 该模型能很好地模拟不同含水量的土壤反射率光谱(400~2 400 nm)。 在以后的研究中, 可以利用野外原地反射率光谱数据检验模型的有效性, 也可以利用其他地区的土壤数据对模型进行验证。
| [1] |
|
| [2] |
|
| [3] |
|
| [4] |
|
| [5] |
|
| [6] |
|
| [7] |
|
| [8] |
|
| [9] |
|