基于离轴腔增强吸收光谱双组分CH4/H2O高灵敏度探测研究
[田兴1, 2, 3  , 曹渊
, 曹渊1, 3 , 王静静1, 3 , 陈家金1 , 刘锟1 , 谈图1 , 王贵师1 , 高晓明1, * ]
, 曹渊]
|
|


作者简介: 田 兴, 1990年生, 中国科学技术大学科学岛分院博士研究生 e-mail: txtian@mail.ustc.edu.cn
H2O和CH4在气候变化过程中起着关键作用, 实时在线测量H2O和CH4浓度一直都是国内外学者研究的热点问题之一。 利用1.653 μm可调谐半导体激光器作光源, 结合反射率为99.997 6%的两片高反射镜组成离轴腔增强吸收光谱装置, 开展了H2O和CH4的高灵敏度测量研究。 离轴腔增强系统的有效吸收光程通过吸收面积-浓度关系法来标定, 吸收面积-浓度关系法的可行性首先通过已知光程的光学吸收池进行验证, 确定有效后用于标定离轴腔增强系统的有效光程。 结果表明, 基长为21 cm的离轴腔增强系统的有效吸收光程达到了8 626.3 m。 当谐振腔内压力为5.06 kPa时, 利用7组不同浓度的CH4标准气体(0.2~1.4 μmol·mol-1)对系统进行了线性响应标定测试, 得到了CH4吸收的积分面积与浓度拟合关系曲线。 系统的稳定性、 可实现的最小探测灵敏度等信息通过Allan方差进行分析, 结果表明系统对探测CH4的最佳平均时间为100 s, 最小可探测浓度极限为7.5 nmol·mol-1; 系统对探测H2O的最佳平均时间为200 s, 最小可探测浓度极限为55 μmol·mol-1。 对提高系统测量精度的数据处理方法也进行了分析研究, 结果表明相比于多次平均方法, Kalman滤波能显著的提高测量精度, 而且缩短了系统的响应时间。 最后, 利用搭建的离轴腔增强实验系统结合Kalman滤波数据处理方法对实际大气中CH4和H2O浓度进行了连续两天的测量, CH4每天平均的浓度分别为2.1和2.08 μmol·mol-1, H2O每天平均的浓度分别为11 515.6和11 628.6 μmol·mol-1, 由此可知建立的离轴腔增强吸收光谱装置能够用于大气CH4和H2O的测量, 另外建立的系统也可用于相关工业领域的高灵敏度CH4和H2O监测。
, CAO Yuan
H2O and CH4 play key roles in the process of climate change, then real-time online measurement of H2O and CH4 concentrationshas always been one of the hot issues of domestic and foreign scholars. In this paper, an off-axis cavity enhanced absorption spectroscopy device was establishedwith two high reflectivity mirrors of 99.997 6% combining a tunable semiconductor laser operating around 1.653 μm as the light source, andthe high sensitivity measurement of H2O and CH4 was carried out. The effective absorption optical path of the system was calibrated by the absorption area-concentration relationship. The feasibility of the absorption area-concentration relationship was first verified by an optical absorption cell with a known optical path, and it was used to calibrate effective optical path of the cavity enhancement system. The results showed that the effective absorption path of the cavity enhancement system with the base length of 21 cm reached 8 626.3 m. The linear response calibration test was carried out with 7 groups of CH4 standard gases of different concentrations (0.2~1.4 μmol·mol-1) when the pressure was 5.06 kPa, and the fitting relationship curve between the integrated area of CH4 absorption and the concentration was obtained. The stability of the system and the minimum detectable sensitivity were analyzed by Allan variance. The results showed that the optimal average time for detecting CH4 was 100 s, and the minimum detectable concentration limit was 7.5 nmol·mol-1. The optimal average time for detecting H2O was 200 s, and the minimum detectable concentration limit was 55 μmol·mol-1. The data processing method for improving the measurement precision of the system was also analyzed. The results showed that Kalman filtering could greatly improve the measurement precisionand reduce the response time of the systemcompared to the multiple averaging method. Finally, the experimental system of off-axis cavity enhanced absorption spectroscopy device combining with Kalman filtering technology was used to measure the CH4 and H2O concentration in real atmosphere for two days. The average daily concentration of CH4 was 2.1 and 2.08 μmol·mol-1, respectively. The average daily concentration of H2O was 11 515.6 and 11 628.6 μmol·mol-1, respectively. It can be seen that the experimental device of off-axis integration cavity can be used for atmospheric CH4 and H2O detection, andthe established system can also be used for high-sensitivity CH4 and H2O monitoring in relevant industrial fields.
H2O在大气物理、 大气化学和气候变化等过程中起着非常重要的作用, 监测大气中H2O变化对气象预报、 环境监测等领域都具有重要意义[1]。 CH4是造成温室效应的一个关键因素之一, 虽然其浓度远低于CO2, 但是其潜在的温室效应是CO2的25倍, 大气中CH4浓度的增加可能会导致气候的加速变化[2]。 此外, CH4是一种广泛使用的易燃易爆燃料, 在天然气储存、 运输、 煤炭开采和液化CH4处理在内的多个行业中都需要监测, 以避免安全事故[3, 4]。 因此, 在环境科学、 气候变化研究和工业监测等领域对H2O以及CH4的探测研究都非常重要。
针对当前我国高精度温室气体分析仪缺乏和相关仪器依赖进口的问题, 本文以研究高灵敏度温室气体探测技术、 实现自主的高精度温室气体分析设备为目标, 开展基于离轴腔增强吸收光谱技术的高灵敏度CH4/H2O双组分探测技术研究。
对于反射率为R, 几何长度为d的稳定光学谐振腔, 有效吸收光程Leff为
式中, d为已知参数, 通过求取有效光程Leff, 即可推出反射率R。
由Beer-Lambert定律可知, 当一束频率为ν 的光通过吸收样品时[5],
式中: Iout(ν )和Iin(ν )分别为频率ν 处的透射和入射光强; L为吸收路径长度(cm); S为谱线吸收线强[cm-1· (molecule· cm-2)-1]; χ (ν -ν 0)为归一化线性函数
对式(2)两边进行积分
化简得到
式中:
实验中温度和压力相等, 对式(4)进行处理得到有效吸收光程Leff为
式中: A和Aref分别是谐振腔内浓度为c以及参考池内浓度为cref时对应的气体吸收积分面积; Lref为已知参考池的有效光程; k=A/c和kref=Aref/cref分别为不同浓度下谐振腔和参考池中积分面积与浓度的斜率。 利用斜率比值即可求出谐振腔的有效吸收光程, 然后代入式(1)可反推出高反镜片的反射率。
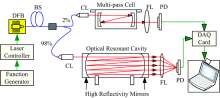
实验测量系统装置如图1所示, 采用中心波长为1.653 μ m的可调谐激光器作光源, 其温度和电流由Model LDC501激光控制器控制, 中心温度和电流分别为22 ℃和86.5 mA, 函数发生器(RIGOL DG4162)产生的三角波振幅为2 V, 扫描频率为40 Hz, 激光二极管电流扫描范围为36.5~136.5 mA (50 mA· V-1)。 利用光纤分束器(XHP-FBT1× 2 DWC, 插入损耗≤ 0.25 dB)把激光分成两束, 其中2%的光经准直透镜后进入参考池(有效光程29.37 m)[4], 另外98%的光经准直透镜后离轴入射到基长为21 cm的光学谐振腔内, 腔镜直径为25.4 cm, 曲率半径为1 m(Advanced Thin Films), 透过吸收池和离轴谐振腔的出射光分别经过焦距为5 cm的聚焦透镜由探测器接收, 两个探测器收集到的信号由采集卡(NI USB-6210)进行采集, 最后由LabVIEW程序进行数据分析处理。
 | 图1 测量系统装置示意图BS: 98: 2光纤分束器; CL: 准直透镜; FL: 聚焦透镜; PD: 探测器Fig.1 Schematic diagram of experimental device of measurement systemBS: 98: 2 beam splitter; CL: collimator; FL: focusing lens; PD: detector |
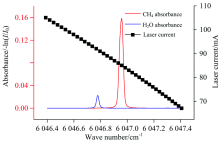
表1给出了HITRAN[6, 7, 8]数据库中6 046.4~6 047.4 cm-1范围内CH4和H2O的谱线信息。 图2模拟了常温、 低压5.06 kPa、 光程为8 000 m条件下2 μ mol· mol-1的CH4以及18 000 μ mol· mol-1 的H2O的吸收系数谱, 图中还给出了电流与波数的对应关系, 激光器的波长扫描范围能够完全覆盖所选择的CH4和H2O吸收谱线。
| 表1 HITRAN 数据库中CH4和H2O在6 046.4~6 047.4 cm-1范围内的吸收谱线参数 Table 1 The absorption line parameters of CH4 and H2O in the range of 6 046.4~6 047.4 cm-1 in HITRAN database |
 | 图2 模拟的CH4以及H2O吸收系数谱和激光器调节电流与波数的对应关系Fig.2 The simulated CH4and H2O absorption coefficient spectrum and the relationship between the laser injection current and the wavenumber |
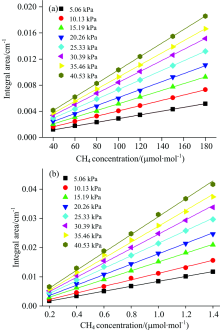
传统计算透镜反射率的方法是通过测量已知浓度的标准气体的吸收谱, 然后由式(1)计算有效光程。 此种方法主要利用吸收的积分面积与压力的线性关系推导反射镜的反射率, 文献[9]提到压力会对反射率造成影响。 本试验对压力标定反射率方法进行了改善, 利用已知程长的光学吸收池作为参考池, 通过测量吸收面积与浓度的关系, 由式(5)得到有效光程。 改善后的方法在计算过程中消除了压力造成的影响。 为了进一步验证试验方案的可行性, 实验测量了8组不同压力下多通池中CH4从40~180 μ mol· mol-1以及离轴谐振腔中CH4从0.2~1.4 μ mol· mol-1浓度下的光谱信号。 Voigt线型进行多峰拟合得到不同浓度下的积分面积, 随后利用线性函数y=ax对浓度和积分面积进行拟合, 如图3所示。
 | 图3 不同压力下CH4积分面积与浓度的关系曲线(a): 多通池; (b): 谐振腔Fig.3 The integral area curve of methane at different concentrations under different pressures(a): Multi-pass cell; (b): Optical resonant cavity |
表2给出了计算结果, 平均有效光程为8 626.3 m, 有效反射率为99.997 6%。
| 表2 不同压力下离轴积分腔的有效光程 Table 2 The effective optical path of OA-CEAS under different pressures |
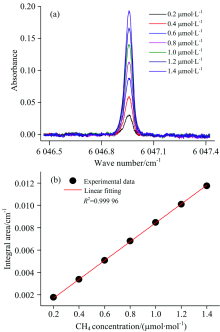
图4(a)测量了5.06 kPa条件下不同浓度的CH4吸收谱, 图4(b)是CH4积分面积与浓度的线性拟合关系曲线, 拟合相关度为99.996%, 因此可以通过积分面积去反演气体浓度。
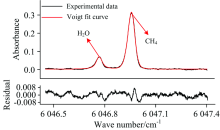
图5是此时测量的大气中CH4/H2O浓度, 利用图4(b)关系曲线得到CH4浓度为2.1 μ mol· mol-1, 由式(4)可以反演出H2O的浓度
式中
 | 图4 (a)不同浓度下的CH4吸收系数谱; (b)CH4积分面积与浓度的关系曲线Fig.4 (a) The absorption coefficient spectra of methane at different concentrations; (b) The integral area curve of methane at different concentrations |
 | 图5 实际大气中CH4和H2O吸收Voigt拟合结果Fig.5 The results of Voigt fitting for CH4 and H2O absorption in the actual atmosphere |
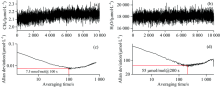
环境温度为24.4 ℃时, 保持压力为5.06 kPa对CH4和H2O进行了接近3 h的连续测量, 采样时间为2 s。 Allan方差分析结果如图6所示, 平均100 s时, CH4最小可探测浓度为7.5 nmol· mol-1; 当采集时间为200 s时, H2O最小可探测浓度为55 μ mol· mol-1。
 | 图6 CH4(a)和H2O(b)长时间测量; CH4(c)和H2O(d)浓度Allan偏差Fig.6 Time series measurements of CH4 (a) and H2O(b); Allan deviation plots for the CH4(c) and H2O (d) |
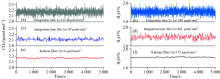
图7对比了采样周期为2 s时CH5/H2O的原始浓度的精度、 平均20 s时的测量精度以及对原始数据进行Kalman滤波[10](滤波参数400)后的测量精度。 不平均时CH4和H2O的测量精度分别为40 nmol· mol-1和548 μ mol· mol-1, 平均20 s后CH4和H2O的测量精度分别提高到20 nmol· mol-1和426 μ mol· mol-1, 但是效果并不显著。 通过Kalman滤波法, CH4和H2O的测量精度分别提高到了6 nmol· mol-1和175 μ mol· mol-1, 效果明显优于平均方法, 而且显著缩短了系统的响应时间。
 | 图7 CH4和H2O的浓度值及精度(a), (b): 采样周期2 s; (c), (d): 平均20 s; (e), (f): Kalman滤波Fig.7 The concentration and precision of CH4 (a) and H2O (b) at the sampling periodof 2 s; (c) and (d) in 20 s; (e) and (f) Kalman filtering |
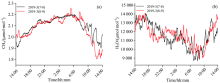
图8是对实际大气中CH4/H2O浓度进行连续两天测量并经过Kalman滤波处理后的结果。 连续两天的测量中, CH4每天平均的浓度分别为2.1和2.08 μ mol· mol-1。 H2O每天平均的浓度分别为11 515.6和11 628.6 μ mol· mol-1。 搭建的离轴积分腔实验装置能够较好的反映实际大气中CH4/H2O的浓度变化。
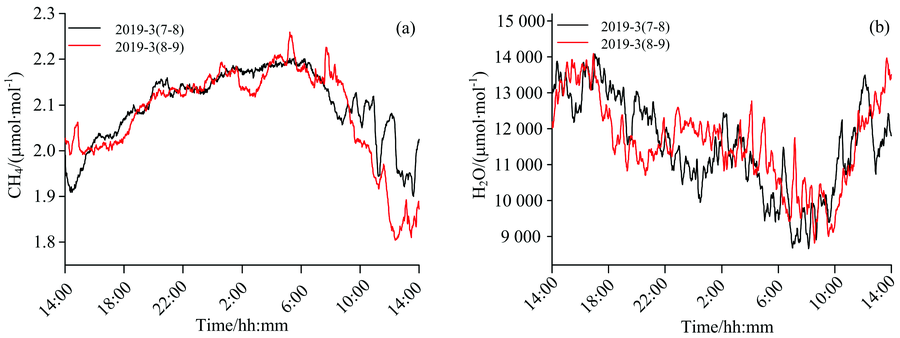 | 图8 两天测量中(a)CH4和(b)H2O浓度变化Fig.8 Ambient CH4and H2O concentrations variation during 2 days measurements |
建立了一套离轴腔增强吸收光谱的CH4/H2O双组分测量系统, 通过两片反射率为99.997 6%、 间距为21 cm的高反镜组成的光腔实现了8 626.3 m的有效光程。 Allan方差分析结果表明, 当平均时间为100 s时, CH4最小探测灵敏度达到7.5 nmol· mol-1; 平均时间为200 s时, H2O最小探测灵敏度达到55 μ mol· mol-1。 与数据平均方法相比, Kalman滤波可以显著提高系统的测量精度并且缩短系统的响应时间。 连续两天对实际大气中CH4/H2O浓度测量结果证明了系统的可行性。 下一步将考虑对整个试验系统集成, 开展外场观测试验研究。
| [1] |
|
| [2] |
|
| [3] |
|
| [4] |
|
| [5] |
|
| [6] |
|
| [7] |
|
| [8] |
|
| [9] |
|
| [10] |
|