41个茶花品种基因组DNA傅里叶变换红外光谱
[邱璐1, 2  , 谢美华
, 谢美华1, 2 , 赵国义1 ]
, 谢美华|
|


研究的目的是通过全基因组DNA的傅里叶变换红外光谱(FTIR)对41种茶花品种进行聚类分析和品种鉴定。 研究发现, 41个茶花品种基因组DNA的FTIR光谱不同, 方差分析显示, 各茶花品种FTIR数据之间的差异显著, 因而, 红外光谱可以作指纹光谱鉴定茶花。 通过系统聚类结合主成分分析, 建立了41种茶花品种的标准聚类和识别模型。 41种茶花品种基因组DNA样本的平均光谱的聚类正确率为92.68%, 品种鉴定准确率为100%。 聚类结果表明, 在1.0聚类距离, 41个山茶品种可分为9个类别, 在15.0聚类距离下可分为3个大类。 亲缘关系分析表明, 滇山茶中的楚雄居群来自楚雄、 腾冲和大理。 结果表明: 基因组DNA的FTIR光谱数据的系统聚类结合主成分分析可用于茶花快速分类和鉴定。
Biography: QIU Lu, (1965—), female, professor at College of Chemistry and Life Science, Chuxiong Normal University email: qiulu@cxtc.edu.cn
The purpose of this research is to cluster and identify forty-one Camellia varieties by Fourier Transform Infrared (FTIR) spectroscopy of genomic DNA. We discovered FTIR spectra of genomic DNA are different among forty-one varieties tested. FTIR spectra can therefore act as a fingerprint for Camellia. Anova confirmed that the differences among FTIR data are significant. We set up the standard clustering and identifying model of forty-one Camellia varieties by hierarchical cluster combined with principal component analysis. The accuracy rate of clustering by using average spectra from one hundred and twenty-three genomic DNA samples is 92.68%. The identification accuracy rate is 100%. Clustering results showed that the forty-one Camellia varieties fall into nine categories based on a 1.0 cluster distance limit, and into three bigger categories at a 15.0 cluster distance limit. The genetic relationship analysis illustrates that the current Chuxiong population of C. reticulata Lindl. comes from Chuxiong, Tengchong, and Dali. We concluded that hierarchical clustering combined with principal component analysis based on FTIR spectra of genomic DNA can be used to quickly cluster and identify Camellia.
Camellia is a genus of plants belonging to the family Theaceae. It is a world famous flower, and has very high ornamental and economic value. China is one of the primary distribution centers of wild Camellia in the world; Yunnan province is the leading distributor of the popular species C. reticulata Lindl. in China; and Chuxiong is one of the important distribution centers of C. reticulata Lindl. in Yunnan. Camellia is the national flower of China, as well as the provincial flower of Yunnan[1, 2].
Fourier Transform Infrared (FTIR) spectroscopy has the advantages of high sensitivity, speediness, non-destructive measurement, and small amounts of sample. It therefore has widespread application in qualitative and quantitative analytical chemistry, biology, and medicine[3, 4, 5].
FTIR spectroscopy has a higher resolution than older forms of IR spectroscopy. It has been successfully used to detect differences between the structures and constituents of DNA samples; it can be used to monitor subtle variations in DNA structure and conformation[6]. DNA is biologic heredity material. It controls the whole life activity of biology, including inherit and variation, growth and development, modality and configuration, physiology and biochemistry characteristics, etc. DNA is different on the structure and constitute for different biology. Methods based on DNA FTIR spectroscopy have recently seen widespread use for identifying and categorizing biological variety and diagnosing diseases[7]. Examples of innovative FTIR spectroscopy use in the literature include analysis of the relationships among Ulmus elongata populations from different regions[8], hierarchical clustering of lactic acid bacteria[9], cluster analysis of heterogeneity among oat and pea roots[10], discrimination between genetically modified (GM) and non-GM maize genotypes[11], and the development of a new method for diagnosing adenocarcinoma[12]. Different oligonucleotides were differentiated using PCA-LDA multivariate analysis with Mid-Infrared Spectroscopy[13]. Cell cycle in MCF-7 cells was distributed by using hierarchical cluster analysis (HCA) to Near-Field photothermal microspectroscopy[14]. Finally, J. B. Shen et al. (2008) studied FTIR spectra of leaf samples from Camellia spp., and clustered and identified different taxa[15].
In this research, we build upon the work of Shen et al. (2008). We extracted genomic DNA from one hundred and sixty-four samples from forty-one Camellia varieties. Average DNA FTIR spectra were obtained and analyzed. The forty-one Camellia varieties were classified and identified at the molecular level by PCA and hierarchical clustering analysis based on DNA FTIR. The genetic relationships between the varieties and their origins were discussed.
Samples were acquired from the Zixi mountain nature preservation area, Baize Horticulture Co., Ltd., and Xinlu Horticulture Co., Ltd. in Chuxiong City, Yunnan, China. They include thirty-nine varieties of C. reticulata Lindl., one variety of C. japonica L., one variety of C. oleifera Abel, and one variety of C. sasanqua Thunb., as shown in Table 2. Among them, twenty varieties belong to the Chuxiong population of C. reticulata Lindl., and two varieties belong to the Dali population of C. reticulata Lindl., and six varieties belong to the Tengchong population of C. reticulata Lindl., and four are traditional species that grow in Yunnan Province.
DNA was extracted using the improved SDS-CTAB method. Fresh leaves (0.15 g) were taken and fully ground. The leaves were mixed with 750 μ L DNA extraction buffer (200 mmol· L-1 Tris-HCl, 100 mmol· L-1 EDTA, 12.6 mmol· L-1 NaCl, and 10% CTAB 2% solution [100 mmol· L-1 Tris-HCl, 20 mmol· L-1 EDTA, 1.4 mol· L-1 NaCl]), 300 μ L 10% SDS, and 100 μ L ethanol. The mixture was incubated for 30 minutes in a 65 ℃ water bath. The supernatant was removed, then an equivalent volume of phenol-saturated water was added and the mixture was shaken for 5 minutes. The supernatant was removed again, and replaced with an equivalent volume of chloroform-isoamyl alcohol (24: 1 V/V chloroform: isoamyl alcohol). The phenol and chloroform steps were repeated three times to denature and remove all proteins. Isopropyl alcohol was mixed with the extract and stored at 4 ℃ overnight to precipitate DNA. To remove RNA, 3 μ L RNase A enzyme (10 mg· mL-1) was added. Finally, the precipitate was washed twice with 75% ethanol to obtain a clean DNA sample.
The quality and purity of the DNA precipitate were confirmed by determination of the 260/280 nm absorption ratio using a DMS 200 spectrophotometer (Varian Techtron Pty. Ltd., Australia). The 260/280 ratio of DNA sample was 1.83, which confirmed that the precipitate is composed of genomic DNA. Genomic DNA solutions with a concentration of 20~50 ng· L-1 were chosen and lyophilized using a rotary SpeedVac (ALPHA1-2LD, Christ Co., Germany) for 3 h.
One hundred and sixty-four genomic DNA samples from forty-one varieties were acquired and scanned by FTIR spectrometer.
FTIR spectra from all the one hundred and sixty-four genomic DNA samples were obtained using an FTIR spectrometer (Spectrum 100, PerkinElmer Co., and Britain). Samples were prepared for scanning by blending and grinding 0.5 mg DNA with 150 mg KBr, then compressing the resulting pellet into disks. Scans were repeated 16 times in the scanning range of 4 000~400 cm-1 at a resolution of 4 cm-1. During detection, atmospheric absorption correction was employed and consistent force was applied to the sample.
The FTIR data of DNA were pretreated using smoothing, normalizing, and the first derivative method. Forty principal components were extracted and used to cluster and identified by using hierarchical cluster. The data were managed with Origin 8.0, MATLAB R2010a, and PASW 18.0 software Origin 8.0 was used to plot the spectrum, and MATLAB R2010a was used to extract the principal components of each spectrum, and PASW 18.0 was used to cluster and analyze anova.
In this paper, we used principal component analysis (PCA) and hierarchical clustering analysis (HCA). In this research, a covariance matrix was used to extract the principal components, and regression was used to calculate a factor score. Ward’ s method was applied to the hierarchical clustering analysis. The clustering distance limits were based on the squared Euclidean distances.
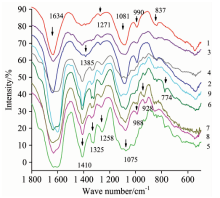
DNA average FTIR spectra from forty-one Camellia varieties were acquired; these are shown in Figure 1. Each spectrum stands for one cluster category respectively. The result shows that there are three outstanding absorbance peaks. The first peak is in the regions of 1 639~1 559 cm-1. The second peak is at 1 410 cm-1. The third peak is in the regions of 1 081~1 050 cm-1. There are some peaks at 1 325, 1 258, 988, 928, 837, and 774 cm-1 (Table 1). The leading distinctions between varieties are in the regions 1 410~1 075, and 1 400~900 cm-1. Some varieties do not have an obvious peak in the above two regions; some have one peak; others have two peaks. Some peaks are obvious in some varieties, whereas others are not so obvious.
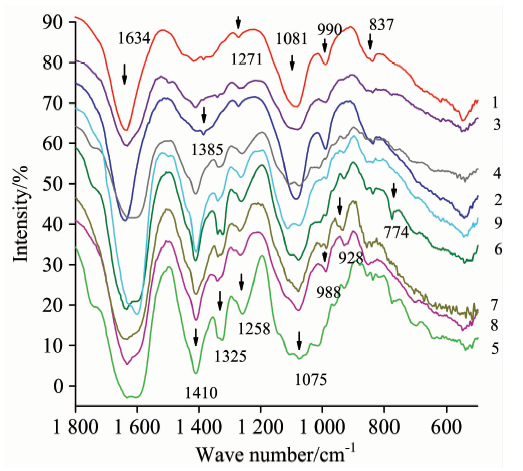 | Fig.1 DNA average FTIR spectra of nine typical Camellia varieties 1: Dalicha; 2: ZiPao; 3: Yunzhen; 4: Hentiangao; 5: Songziling; 6: Luchengchun; 7: Ziqiang; 8: Tongzimian; 9: Jiaoyuan |
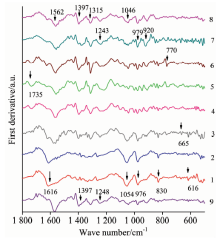
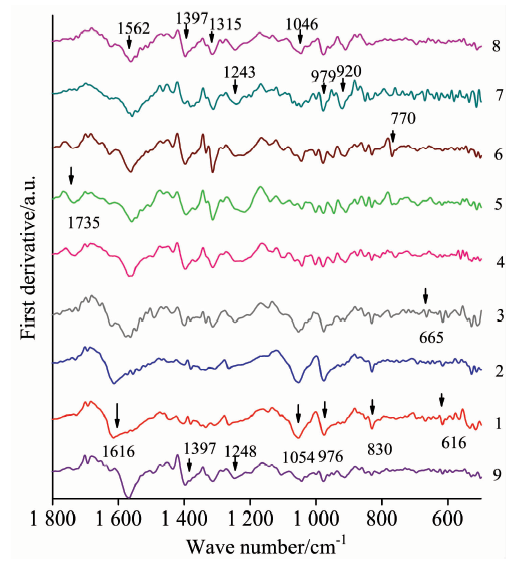 | Fig.2 First derivative average spectra of nine typical Camellia DNA FTIR 1: Dalicha; 2: ZiPao; 3: Yunzhen; 4: Hentiangao; 5: Songziling; 6: Luchengchun; 7: Ziqiang; 8: Tongzimian; 9: Jiaoyuan |
The first derivative confirms the accuracy of the peaks’ wavenumbers and emphasizes distinctions among the categories (Figure 2).
In the regions of 1 000~800 cm-1, IR peaks reflect sugar conformation. The peaks in the 1 250~1 000 cm-1 regions are assigned to vibrations along the sugar-phosphate backbone of the DNA molecule. Peaks in the 1 500~1 250 cm-1 range reflect base-sugar vibrations. The 1 760~1 480 cm-1 regions are sensitive to base-pairing and base-stacking effects (Table 1).
| Table 1 Wavenumber and assignations of Camellia DNA FTIR in the regions of 1 800~700 cm-1 |
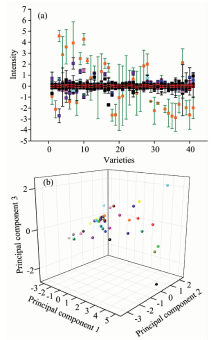
Pretreatment of the spectra eata is necessary due to random noise, baseline drift, concentration differences, asymmetry of sample and environment, etc. Pretreatment can effectively get!rid of artifacts. Smoothing, normalizing, plotting the derivative, and selecting spectra range are common pretreatment methods. In this research, FFT Filter smoothing was used to remove random noise. First derivatives were used to clear up influence from instrument background and baseline drift. The 1 800~700 cm-1 wavenumber range was selected to simplify the mathematics. Figure 3(a) shows the mean, standard deviation, standard error, minimum, and maximum of the FTIR data for each genomic DNA sample from the forty-one varieties of Camellia after pretreatment.
Anova shows that the mean difference is significant between groups (p< 0.05). LSD multiple comparisons reveal further details: the difference is significant when Variety 3, 5, 7, 9, 10, 16, and 28 are compared with Variety 20 or Variety 21 (p< 0.05). The difference is not significant among other varieties.
 | Fig.3 (a) The standard Error of forty-one varieties after pretreatment, (b) 3D scatter plot of the principal component 1, principal component 2 and principal component 3Anova significance analysis is necessary. It can effectively display data’ s characteristic, and provides scientific helps and foresees for further analysis. |
The correlation matrix was used to extract the principal components, and regression was used to determine the factor score coefficient matrix for PCA.
The results show that there is an obvious turning point at the fortieth component, so forty principal components were extracted, and used to further cluster and identify the forty-one varieties. The cumulative percentage of the first forty principal components is 100%.
A 3D scatter plot of PC1, PC2, and PC3 reveals that the forty-one Camellia varieties separate well (Figure 3. b); the points do not cluster well. A 3D scatter plot from the principal components that were significantly different in ANOVA shows that center points are more concentrated, but there is still no informative cluster effect. This indicated that clustering these forty-one Camellia varieties is complicated, and cannot be accomplished directly by PCA. Further analysis was needed.
2.4.1 Standard hierarchical cluster model
One hundred and sixty-four genomic DNA samples from forty-one Camellia varieties (four DNA samples from each variety) were extracted and scanned by FTIR. Three genomic DNA samples were used to establish average spectra for clustering analysis, and one sample was used for identification analysis.
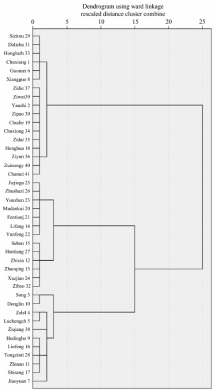
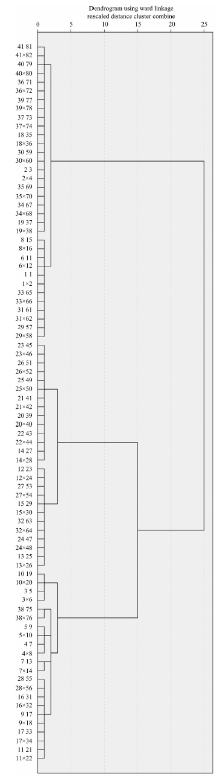
 | Fig.4 Standard hierarchical cluster model of forty-one Camellia varieties based on DNA FTIR |
The standard hierarchical cluster model was established by using forty extracted principal components. Ward’ s method was applied, and the metrics are based on squared Euclidean distance. The cluster results show that these forty-one Camellia varieties group into nine categories at 1.0 cluster distance (Figure 4). The first category is composed of the varieties Shizitou, Dalicha, Hong Lu Zhen, Chuxiong, Guomei, and Xiangguocha. The second category is composed of Zidie, Ziwei (Mt. Zixi), Yanzhi, ZiPao, Chudie, Chuxionghong, Zidai, Honghuayoucha, Ziyun, Zuihongyan, and Chamei. The third category is composed of Jiejiegao, Zhushazipao, Yunzhen, MuDanKui, Fentianjiao, Lifang and Yunzhen. The fourth category is composed of Seben, Hentiangao, Zhixia, Zhaoqinggongzhu, Xuejiao and Zibao. The fifth category is composed of Songziling and Donglin. The sixth category is composed of Zehe and Luchengchun. The seventh category is composed of Ziqiang alone. The eighth category is composed of Hedinghong, Linfeng, Tongzimian, Zhinan and Shisangzhichun. The ninth category contains only Jiaoyuan.
| Table 2 The result of clustering and identified of forty-one Camellia samples by Hierarchical Cluster |
All forty-one varieties were clustered into three larger categories at 15.0 cluster distance. The first and the second category above belong to one. The third and the fourth category belong to another. Those from the fifth to the ninth category belong to the third. The clustering accuracy rate is 92.68% (Table 2). Three varieties that belong to the species C. japonica L., C. oleifera Abel, and C. sasanqua Thunb. should be clustered independently from C. reticulata Lindl. according to traditional classification. They were not isolated from C. reticulata Lindl., so they were thought to be clustered in error. However, it is not impossible that they are naturally associated with C. reticulata Lindl., since they are used in grafting offspring of C. reticulata Lindl. varieties.
2.4.2 Relationship analysis of forty-one Camellia varieties based on FTIR spectra data of their genomic DNA
Table 2 shows that the nearest relationships among the varieties examined are between three pairs: Shizitou and Dalicha, MuDanKui and Fentianjiao, and Yanzhi and ZiPao. Three other pairs have cluster distances less than 1.0: Jiejiegao and Zhushazipao, Guomei and Xiangguo, and Lifang and Yunfeng. The following pairs have cluster distances less than 2.0: Chudie and Chuxionghong, Shizitou and Hongluzhen, Yunzhen and Jiejiegao, Chudie and Zidai, Seben and Hentiangao, Lifang and MuDanKui, Zidie and Ziwei, Yanzhi and Chudie, and Zhixia and Seben. The cluster distances are less than 10.0 (Table 3).
| Table 3 The cluster distance coefficients schedule of Standard Hierarchical Cluster Model of forty-one Camellia varieties of DNA FTIR |
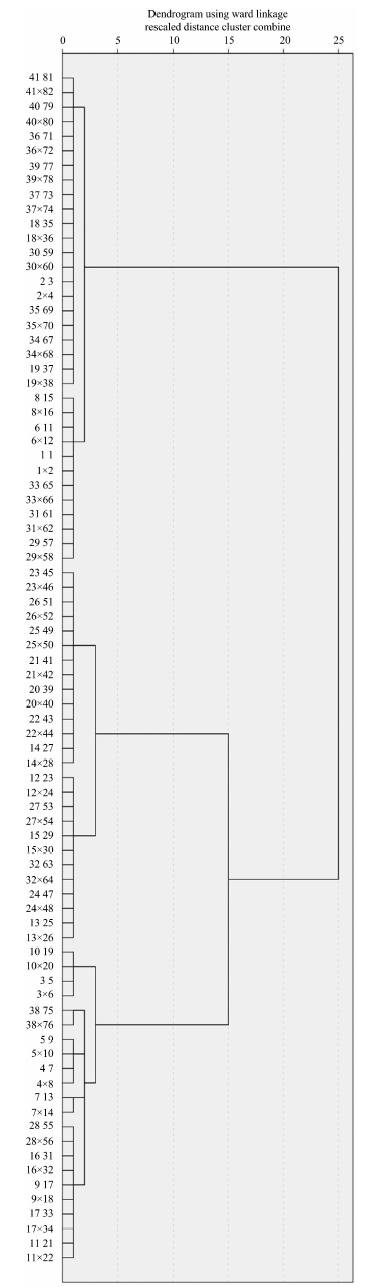
One of the four samples taken from each variety was used for identification analysis, and was labeled with the letter “ x” . FTIR spectra data of these “ mystery” samples were put into the standard hierarchical cluster model. When “ mystery” samples were between two adjacent varieties, the cluster distances between the sample and the two adjacent varieties were compared, and the sample was assigned to the variety with the smaller cluster distance. The hierarchical cluster plot and the cluster distances correctly identified every sample (Figure 5); the accuracy rate is 100% (Table 2).
FTIR spectra of genomic DNA from Camellia samples are in accord with the results reported by G. Tyagi et al.[16]. There are four obvious DNA marker peaks in free DNA from G. Tyagi; they are at 1 669, 1 225, 1 087 and 966 cm-1. The peaks closest to those wavenumbers in our research are at 1 634, 1 258, 1 075 and 990 cm-1. There are peaks at 1 714, 1 669, 1 607, 1 575, 1 540, 1 522, 1 489, 1 419, 1 396, 1 374, 1 338, 1 295, 1 225, 1 087, 1 033, 966, 895, 835, 780, 721 and 663 cm-1 in the study from G. Tyagi. There are peaks at the above wavenumbers in our research, too. There are three differences between this study with the one from G. Tyagi. The first is that the peak at 1 258 cm-1 is not obvious for some varieties. The second is that the peaks at 1 410 and 1 325 cm-1 are obvious for some varieties. The third is that there are shifts in wavenumber: from 1 634 to 1 562 cm-1, from 1 075 to 1 046 cm-1, and from 990 to 976 cm-1.
 | Fig.5 The hierarchical cluster plot for identifying forty-one Camellias based on DNA FTIR |
In the regions of 1 000~800 cm-1, IR peaks are sensitive to the changes in the end cyclic torsion angles of the furanose ring, which reflects sugar conformation. The marker band in the regions of 840~825 cm-1 is associated with the vibration modes of S-type sugars; specifically, a vibration mode localized to the C3'— C4'— C5'— O5'— P part of the sugar-phosphate backbone[17]. The band in this study is at 979, 831 and 770 cm-1.
The peaks in the 1 250~1 000 cm-1 regions are assigned to vibrations along the sugar-phosphate backbone of the DNA molecule. The 1 225 cm-1 band is associated to the asymmetric stretch vibration of PO2? group of the phosphodiester-deoxyribose backbone of B-type DNA, and the band more than 1 225 cm-1 is A-type DNA. The band at 1 000 cm-1 is due to the symmetric stretching vibration of P
Peaks in the 1 500~1 250 cm-1 range reflect base-sugar vibrations. The peaks in the 1 440~1 330 cm-1 regions reflect glycosyl bond rotation conformation. The band at 1 382 cm-1 is assigned to guanosine for the glycosyl torsion angle x in anti-conformation, and the band at 1 410 cm-1 is due to C2'-endo deoxyribose vibration[20].
The 1 760~1 480 cm-1 regions are sensitive to base-pairing and base-stacking effects; the peaks in the regions of 1 750~1 500 cm-1 are related to the G— C and A— T base pairs. The band at 1 665 cm-1 is due to C2=O2 vibrations of base-paired cytosine; the 1 647 cm-1 band is due to overlapping stretching C4=O4 vibrations of thymine; the band in the 1 634~1 645 cm-1 range is from stretching vibrations of the NH2 in guanine; and the 1 624~1 610 cm-1 band is associated with C4— C5=C6 ring stretch vibrations of cytosine. A marker at 1 590~1 575 cm-1 is assigned to the C4=C5 , C5— C6 ring vibrations of guanine and one at 1 559 cm-1 is assigned to a coupled C6=O6, C5— C6, C4=C5 stretching vibration of guanine. The 1 503 cm-1 band is assigned to vibrations of the cytosine ring[21, 22].
Innovative Research Team of the University of Yunnan Province, Yunnan Province Universities Key Laboratory of Applied Biology, and Applied and Basic Research Foundation of Yunnan Provincial Science and Technology Commission. The related work has been awarded the Yunnan science and technology award in 2016.
The authors have declared that no competing interests exist.
| [1] |
|
| [2] |
|
| [3] |
|
| [4] |
|
| [5] |
|
| [6] |
|
| [7] |
|
| [8] |
|
| [9] |
|
| [10] |
|
| [11] |
|
| [12] |
|
| [13] |
|
| [14] |
|
| [15] |
|
| [16] |
|
| [17] |
|
| [18] |
|
| [19] |
|
| [20] |
|
| [21] |
|
| [22] |
|