

二阶导数光谱法快速测定硝酸盐氮和亚硝酸盐氮
[王静敏1  , 张景超
, 张景超1, * , 张尊举1, 2 ]
, 张景超, 张尊举|
|


作者简介: 王静敏, 1991年生, 燕山大学理学院硕士研究生 e-mail: 405530395@qq.com
紫外吸收方法中, 硝酸盐氮(N
In the ultraviolet spectrophotometry, we know that the absorption peak of nitrate nitrogen is around 202.0 nm, and the absorption peak of nitrite nitrogen is around 210.0 nm. It can be seen that the absorption peaks of the two are very close, and the absorption curves overlap seriously and interfere with each other badly. It is difficult to use single wavelength to determine the content of the two without the separation, and the national standard method is too complicated and time-consuming. In order to monitor the nitrate nitrogen and nitrite nitrogen in environmental water and drinking water more accurately, rapidly and eco-friendly, and to avoid many shortcomings in the national standard method, in this paper we studied the rapid analysis method of the two in water. This method combines with ultraviolet spectrophotometry and the second derivative spectrometry which are more rapid and accurate. And it does not need any pre-separation treatment. Nitrate nitrogen and nitrite nitrogen series solution were prepared by guarantee reagent. Using deionized water as a reference, UV-Vis spectrophotometer was used to scan the UV absorption spectrum in the range of 195~250 nm. After that, we used the Origin software to do the second derivative spectra of the obtained spectrogram, and used the Savitzky-Golay method in the Origin software to smoothen the second derivative spectra. By observing the above two groups of second derivative spectrogram, we found that the second derivative absorbance at different concentrations of nitrite nitrogen samples at 223.5 nm was 0 and nitrate nitrogen samples at 216.5 nm was also 0. The second derivative absorbance of the UV spectra of the mixed samples were observed by experiments. We found that they conformed to Lambert-Beer law. Then the nitrate nitrogen and nitrite nitrogen mixed samples were prepared. The UV absorption spectra of the mixed samples were scanned. We did the second derivative spectra of the obtained spectrogram and smoothened them. After that, we observed the second derivative spectra of mixed samples. It could be seen that when the concentration of nitrate nitrogen is the same and nitrite nitrogen concentration is different, the concentration of nitrite nitrogen will affect the second derivative absorbance of nitrate nitrogen. However, the second derivative spectra of various samples at 223.5 nm are almost overlapping, indicating that the concentration of nitrite nitrogen at this wavelength will not have any effect on the second derivative absorbance of nitrate nitrogen. At this wavelength, the value of the second derivative absorbance of the mixed samples increase linearly with the increase of nitrate nitrogen concentration. Therefore, 223.5 nm was chosen as the determination wavelength of nitrate nitrogen in the mixed samples. In the same way, the determination wavelength of nitrite nitrogen is 216.5 nm. Linear regression analysis of the nitrate nitrogen single component samples was performed between the second derivative absorbance and the concentration at 223.5 nm. The linear relationship was good, and the regression equation of the obtained standard curve was C=438.69 A+0.015, R2=0.995 9. In the same way, we obtained that the regression equation of the nitrite nitrogen at 216.5 nm was C=-657.29 A+0.068 8, R2=0.998. In order to test the application of this method in actual water sample measurement, we took three kinds of water samples from New River, Tang River and Dai River in Qinhuangdao to carry out experiments. The results showed that the recovery rate was between 96.7% and 103%, the relative standard deviation was 1.46~3.68. The method is relatively accurate and easy to operate and costs less. The rapid on-line monitoring of nitrate nitrogen and nitrite nitrogen can be realized at the same time.
硝酸盐和亚硝酸盐广泛存在于生活环境之中, 如河水、 饮用水、 多叶蔬菜、 肉制品等中[1]。 其中亚硝酸盐也可与胃中的仲胺和酰胺反应生成致癌物质, 从而引起消化和排泄系统癌症[2], 对人类健康存在着潜在危害[3]。 而硝酸盐在人体内会还原成亚硝酸盐对人体造成危害, 对孕妇和婴儿尤其严重[4, 5, 6]。 因此, 一个高灵敏度、 准确、 快速的测定二者含量的方法, 对于判断食物安全或水环境质量具有十分重要的意义, 对于公众环境安全也十分必要[7]。 近年来, 大量研究提出了关于这两种物质的测定方法。 Yaqoob等[8]提出一种基于发光氨化学发光的流动注射法来测定水质中硝酸盐和亚硝酸盐。 Wang等[9]设计了一个测定亚硝酸盐的电化学传感器, 该传感器是基于玻碳电极用石墨烯壳聚糖和金纳米粒子改进的。 Feng等[10]采用反相流动注射分析加上一个长程液体波导毛细管对海水中的亚硝酸盐和硝酸盐进行同时测定。 Brandao[11]等采用高分辨率连续电热源分子吸收光谱法测定地下水中的亚硝酸盐和硝酸盐。 Shariati-Rad[12]等提出基于2, 4-二甲苯酚与亚硝酸盐和硝酸盐在浓硫酸试剂中的反应利用偏最小二乘法同时测定水中硝酸盐和亚硝酸盐。 诸多测定方法都有较高的灵敏性和准确性, 但实际应用中仍存在成本高、 需要添加化学药品而造成二次污染或相互干扰无法实现快速在线测定等问题。
本文将紫外分光光度法与二阶导数光谱法有效结合, 解决了亚硝酸盐氮和硝酸盐氮两种物质吸收光谱严重重叠的问题, 实现了样品中亚硝酸盐氮和硝酸盐氮的快速测定。
UV-A560双光束紫外-可见分光光度计(上海翱艺); 1 cm石英比色皿; 电子天平。
亚硝酸盐氮及硝酸盐氮标准贮备溶液: 称取已干燥的NaNO2 (GR) 1.232 1 g或KNO3 (GR) 1.803 6 g, 溶于适量去离子水中, 移入500 mL容量瓶中, 用去离子水稀释至标线, 混匀备用。 此溶液1 mL含亚硝酸盐氮或硝酸盐氮0.5 mg。 临用时稀释为5 μ g· mL-1的标准使用液。
(1)单组分样品: 配制浓度为0.00, 0.10, 0.20, 0.40, 0.60, 0.80, 1.00, 1.20和1.40 mg· L-1的亚硝酸盐氮和硝酸盐氮的系列溶液。
(2)混合样品: 配制亚硝酸盐氮浓度为0.10~1.40 mg· L-1, 硝酸盐氮浓度为0.10~1.40 mg· L-1的混合溶液。
(3)测定: 在200~250 nm波长范围, 扫描间隔0.5 nm, 对样品进行波长扫描。
获得的紫外吸收图谱, 运用Origin对其求二阶导数, 并使用软件中Savitzky-Golay方法对二阶导数光谱进行平滑处理。 确定测量混合溶液中亚硝酸盐氮及硝酸盐氮含量的波长, 获得标准曲线及回归方程。
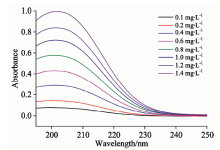
亚硝酸盐氮和硝酸盐氮的标准系列溶液的紫外吸收光谱分别如图1和图2所示, 从图中可以看出, 不同浓度的两种物质的水溶液在波长200~250 nm都具有明显的光谱吸收, 吸收光谱峰形相似, 但它们各自的吸收峰的峰值和吸光度的幅值均不相同, 亚硝酸盐氮的吸收峰值在210 nm左右, 硝酸盐氮的吸收峰值在202 nm左右, 峰值因浓度高低略有偏移。 由于二者峰值位置较近, 吸收曲线会严重重叠, 无法直接采用传统紫外分光光度法同时测定二者的含量, 因此采用二阶导数光谱法对所得数据进行处理来测定二者浓度。
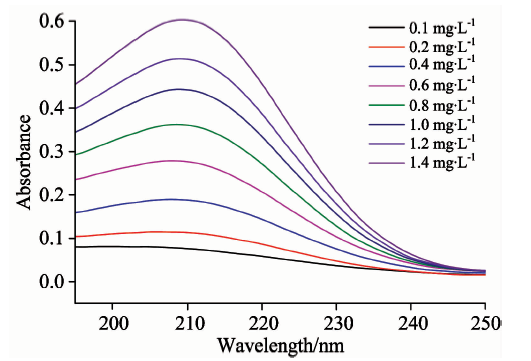 | 图1 不同浓度的亚硝酸盐氮的吸收光谱Fig.1 Absorption spectra of different concentrations of nitrite nitrogen |
 | 图2 不同浓度的硝酸盐氮的吸收光谱Fig.2 Absorption spectra of different concentrations of nitrate nitrogen |
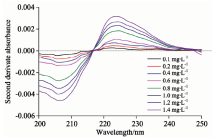
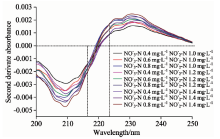
通过二阶导数光谱法处理图1和图2的紫外光谱数据, 分别得到二者的二阶导数光谱图如图3和图4。 不同浓度混合样品的二阶导数光谱图见图5。 由图3可知, 各种浓度的亚硝酸盐氮在223.5 nm处的二阶导数均为0, 且由图5可以看出在硝酸盐氮浓度相同而亚硝酸盐氮浓度不同时, 亚硝酸盐氮的浓度变化会对硝酸盐氮的吸光度的二阶导数有影响, 但是各种混合样品的二阶导数光谱在223.5 nm处几乎交叉于一点, 即在该波长下亚硝酸盐氮的浓度不影响硝酸盐氮的吸光度, 故选择223.5 nm处为混合组分中硝酸盐氮的测定波长。 参照上述方法, 从图4及图5中可确定216.5 nm为混合组分中亚硝酸盐氮的测定波长。
 | 图3 亚硝酸盐氮的二阶导数光谱Fig.3 Second derivative absorbance of nitrite nitrogen with different concentrations |
 | 图4 硝酸盐氮的二阶导数光谱Fig.4 Second derivative absorbance of nitrate nitrogen with different concentrations |
 | 图5 亚硝酸盐氮和硝酸盐氮混合样品的二阶导数光谱Fig.5 Second derivative absorbance of mixed samples of nitrite nitrogen and nitrate nitrogen |
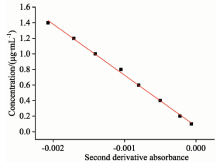
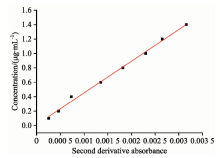
根据单组分测得亚硝酸盐氮在216.5 nm处的吸光度的二阶导数与浓度值进行线性回归后得到的标准曲线见图6, 回归方程为C=-657.29A+0.068 8, R2=0.998; 同理, 可以得到硝酸盐氮在223.5 nm处的标准曲线的回归方程为C=438.69A+0.015, R2=0.995 9, 图7为其标准曲线。
 | 图6 亚硝酸盐氮标准曲线Fig.6 Nitrite nitrogen calibration curve |
 | 图7 硝酸盐氮标准曲线Fig.7 Nitrate nitrogen calibration curve |
取秦皇岛市新河、 汤河及戴河河水水样, 调节pH到5~9, 加入硫酸银溶液混匀再加入氢氧化铝悬浮液摇匀静置10 min之后过滤, 弃去最初10 mL滤出液。 Br-, I-, IO3-, Fe3+, Cu2+, Cr3+和Cr6+等在地表水中含量甚微, 一般不影响测定[13]。 取一定量河水水样稀释一倍后, 分别平行进样6次, 回收率实验结果见表1。 再取河水水样稀释一倍后, 分别进行6次测量其吸光度后计算浓度, 得到平均值、 标准偏差及相对标准偏差结果见表2。
| 表1 河水样品中硝酸盐氮和亚硝酸盐氮的回收率 Table 1 Recovery of nitrate nitrogen and nitrite nitrogen in river water samples |
| 表2 河水样品中硝酸盐氮和亚硝酸盐氮的相对标准偏差 Table 2 Relative standard deviation of nitrate nitrogen and nitrite nitrogen in river water samples |
分析了紫外光谱法与二阶导数法相结合的方式快速测定硝酸盐氮和亚硝酸盐氮含量的易用性。 由于硝酸盐氮和亚硝酸盐氮的紫外吸收峰位置太过接近, 使两种物质的快速测定存在困难。 通过对不同浓度的两种物质的标准溶液的紫外扫描光谱进行二阶导数处理, 观察两种物质单组分及混合样品的二阶导数光谱确定223.5 nm处为混合样品中硝酸盐氮的测定波长, 216.5 nm为亚硝酸盐氮的测定波长。 上述结论均在配制的标准溶液的基础上得出, 为了验证将其应用到实际水样测量中能否成立。 分别取秦皇岛市新河、 汤河以及戴河三种河水水样进行实验验证, 为去除其他物质干扰, 先对河水样品进行了预处理, 再用本文提到的方法进行测定, 得到回收率范围为96.7%~103.0%, 相对标准偏差为1.46~3.68, 结果较为理想。 这种方法操作简便, 成本较低, 值得被广泛推广和使用, 但是对于污水废水等其他存在干扰因素较多的水质, 这种方法是否适用还有待进一步研究。
The authors have declared that no competing interests exist.
| [1] |
|
| [2] |
|
| [3] |
|
| [4] |
|
| [5] |
|
| [6] |
|
| [7] |
|
| [8] |
|
| [9] |
|
| [10] |
|
| [11] |
|
| [12] |
|
| [13] |
|