
基于三维荧光光谱和PSO-SVM对胭脂红含量的测定
[王书涛*  , 彭涛, 李明珊, 王贵川, 孔德明, 王玉田]
, 彭涛, 李明珊, 王贵川, 孔德明, 王玉田]
|
|


作者简介: 彭 涛, 1993年生, 燕山大学河北省测试计量技术及仪器重点实验室硕士研究生 e-mail: 18733507278@163.com
胭脂红是一种应用广泛的食品色素, 在各种食品、 饮料的添加剂里都有它的身影, 过量食用人工合成色素会严重危害健康。 食物中色素一般都是多种联用, 各种色素之间会相互产生干扰, 这加大了对食品中色素检测的难度, 模拟食品中多种色素共存的环境, 采用荧光光谱技术, 结合PSO-SVM算法, 建立一种测定混合溶液中胭脂红含量的方法。 从试剂公司购买胭脂红和苋菜红固体粉末, 选择胭脂红为待检测色素, 苋菜红为干扰色素, 配成不同浓度的胭脂红单色溶液以及加入苋菜红后的混合溶液样本, 其中胭脂红的浓度在0.1~30 μg·mL-1之间, 干扰色素苋菜红的浓度在0.1~10 μg·mL-1之间随意添加。 运用Edinburgh Instruments 公司生产的FS920稳态荧光光谱仪, 测得胭脂红单色溶液与加入苋菜红后混合溶液的荧光光谱图, 分析得到胭脂红的最佳激发波长为 λex=326 nm, 最佳发射波长为 λem=430 nm。 各选取6组不同浓度的单色样本以及混合色素样本, 其中, 胭脂红的物质浓度同为3, 4, 5, 6, 7和8 μg·mL-1, 苋菜红的物质浓度都定在2 μg·mL-1。 观察6组样本在激发波长 λex=326 nm时的发射光谱和荧光强度的关系。 单色样本中, 胭脂红浓度与荧光强度线性关系良好; 而在混合溶液中, 随着胭脂红浓度的增加, 荧光强度呈现出先降后增再降的过程, 光谱线型、 强度与各组分浓度间存在复杂的非线性关系, 得以证明混合溶液的荧光光谱并不是由各组分光谱简单的叠加, 而是在吸收光谱的过程中, 胭脂红溶液与苋菜红溶液存在竞争和相互影响。 配取25组胭脂红、 苋菜红混合溶液, 从中选择7个作为预测样本, 其余18组作为训练样本。 7 个预测样本中胭脂红的浓度分别为 1.0, 2.0, 4.0, 6.0, 9.0, 12和15 μg·mL-1, 干扰物质苋菜红的物质浓度在0.1~10 μg·mL-1之间。 选择各组样本在最佳激发波长 λex=326 nm 下对应的荧光强度, 作为检测模型的输入, 以胭脂红的预测浓度作为输出。 对PSO参数初始化设置后, 训练输出SVM的最佳参数 c和 g, 将所得的最佳参数输入PSO-SVM模型, 得到7组预测样本的浓度预测结果分别为: 1.146 9, 1.860 6, 3.854 4, 6.146 9, 9.133 8, 11.857 6和14.859 8 μg·mL-1。 分析PSO-SVM的预测结果, 得到胭脂红平均回收率为100.84%, 预测均方根误差(RMSEP)为1.03×10⁻⁴, 模型输出与真实值之间的相关系数是0.999。 在同等条件下, 采用误差逆向传播算法(BP)预测得到的7组样本浓度分别为: 1.140 1, 2.139 8, 3.188 2, 6.436 2, 8.882 7, 11.860 1和12.664 3 μg·mL-1, 其平均回收率为98.56%, 均方根误差为4.65×10⁻³, 输出值与真实值之间的相关系数为0.972。 与误差逆向传播算法(BP)的预测结果相比较, PSO-SVM 相关系数高出2.7%, 平均回收率高出0.6%, 均方根误差降低了将近一个数量级。 分析结果表明, 通过荧光光谱技术与PSO-SVM相结合的方法, 能够有效的避开干扰色素的影响, 准确的测定混合溶液中胭脂红的含量, 并且效果相比较于BP更加理想。
Carmine is a widely used food pigment in various food and beverage additives. Excessive consumption of synthetic pigment shall do harm to body seriously. The food is generally associated with a variety of colors. Various pigments will interfere with each other, which increases the difficulty of detection of pigments in food. Under the simulation context of various food pigments’ coexistence, we adopted the technology of fluorescence spectroscopy, together with the PSO-SVM algorithm, so as to establish a method for the determination of carmine content in mixed solution. Carmine and amaranth solid powders were purchased from reagent company. Carmine was selected as pigment to be detected, and amaranth was interfered pigment, carmine monochromatic solution with different concentrations and mixed solution after adding amaranth. The carmine concentrations of 0.1~30 μg·mL-1, interfered pigment amaranth concentrations of 0.1~10 μg·mL-1 were arbitrarily added. Using the FS920 steady state fluorescence spectrometer produced by Edinburgh Instruments Company, the fluorescence spectra of the carmine monochromatic solution and the mixed solution after the addition of amaranth were measured. The optimal excitation wavelength of carmine was λex=326 nm. The optimal emission wavelength For λem=430 nm. The six different concentrations of monochromatic samples and mixed pigment samples were selected. Among them, the concentration of amaranth was set at 2 μg·mL-1, and the concentration of carmine was 3, 4, 5, 6, 7, 8 μg·mL-1. Observe the relationship between the emission spectra and the fluorescence intensity of the six samples at the excitation wavelength λex=326 nm. In the monochromatic samples, the carmine concentration and fluorescence intensity were linear well. The fluorescence intensity of the six samples decreased first and then increased and then decreased again with the increase of the carmine concentration. It is proved that the fluorescence spectrum of the mixed solution is not simply superimposed by the spectrum of the components, but rather the competition and interaction between the carmine solution and amaranth solution in the process of absorbing the light spectrum. With 25 sets of carmine and amaranth mixed solution, seven of them were selected as prediction samples and the remaining 18 groups were used as training samples. The concentrations of carmine in the seven predicted samples were 1.0, 2.0, 4.0, 6.0, 9.0, 12 and 15 μg·mL-1, and the concentrations of the intercalating matter amaranth in the range of 0.1~10 μg·mL-1. The fluorescence intensities corresponding to the optimal excitation wavelength λex=326 nm of each sample were selected as the input of the detection model, and the predicted concentration of carmine was taken as the output. After initializing the PSO parameters, the optimal parameters c and g of SVM were trained. The optimal parameters were input into the PSO-SVM model. The predicted results of the seven predicted samples were: 1.146 9, 1.860 6, 3.854 4, 6.146 9, 9.133 8, 11.857 6, 14.859 8 μg·mL-1. The results of PSO-SVM analysis showed that the average recovery of carmine was 100.84%, and the root mean square error of prediction (RMSEP) was 1.03×10⁻⁴, and the correlation coefficient between model output and real value was 0.999. Under the same conditions, the concentrations of seven samples predicted BP method were 1.140 1, 2.139 8, 3.188 2, 6.436 2, 8.882 7, 11.860 1 and 12.664 3 μg·mL-1. The average recoveries was 98.56% The RMSEP was 4.65×10⁻³ and the correlation between the output and the true value was 0.972. Compared with the predicted results of reverse transmission, the correlation coefficient of PSO-SVM was 2.7% higher, the average recovery rate for 0.6%, and the root mean square error was nearly one order of magnitude lower. According to the analysis results, it can effectively avoid the interference caused by pigment with the combination of the fluorescence spectrum technique and PSO-SVM, accurately determining the content of carmine in mixed solution with an effect better than that of BP.
生活水平的提高, 不断更新着人们对食物的要求。 色泽鲜艳、 口感更佳的食品, 在错综复杂的食物群里往往更能够受到大家的青睐, 因此, 出现有些不良商家违规使用食品色素的情况[1]。 食品色素一般都具有一定毒性, 由于超标摄入而导致畸形、 致癌的案例层出不穷, 国家对各种食品色素用量的标准有着严格的规定[2]。
目前, 在食品色素含量检测中, 主要采取的方法有: 毛细血管电泳法、 气相色谱法及其联用技术、 高效液相色谱法及其联用技术、 荧光光谱技术等[3, 4, 5, 6]。 从前期处理复杂程度、 操作过程繁琐程度、 设备成本高低等方面考虑, 荧光光谱技术明显优于其他几种方法, 被广泛应用于特性分析、 物质鉴别、 痕量测定[7, 8, 9]等方面。
支持向量机(SVM)是继神经网络之后一种比较高效优越的算法, 该算法能避免经验非线性方式的过拟合、 局部最优等问题[10], 泛化能力强, 在模式识别、 回归分析等方面有着广泛用途[11, 12]。 本文通过粒子群优化(PSO)算法得到SVM的参数, 然后建立训练模型, 模拟食品中多种色素相互影响的环境, 在干扰色素苋菜红存在的情况下, 测定混合溶液中的胭脂红浓度, 并将测定结果与误差逆向传播算法(BP)的测定结果相比较。
支持向量机(support vector machine, SVM)[13]是Vapnik与其合作者提出的, 是继神经网络之后, 一种比较优越高效的算法。 对于SVM而言, 任意一个新的输入x, 通过训练建立的回归模型推测其输出值。 输出值y与真实数据之间并不绝对相等, 一般都会存在一定的估计误差, 为了估计误差的范围, 引入不敏感系数g> 0, 若估计误差在g范围内, 则回归估计损失视为0, 定义g不敏感损失函数如式(1)
引入松弛变量ξ i≥ 0和
式中, C是惩罚因子, 影响回归模型对回归误差大于样本的重视水平, g的大小关系着回归模型的精度。
为求式(2)的解, 构造函数, 将其转换化为求解对偶问题, 如式(3)
式中, α i和
由于参数c与g的选择决定着SVM回归的准确度与预测的精度, 寻找最佳的参数可以使回归模型的效果达到最佳。
粒子群优化算法(particle swarm optimization algorithm, PSO)[14]是计算智能领域除蚁群算法外的另一种基于群体智能的优化算法。 设在N维搜索空间中, 微粒数为M, 第i个微粒的位置为Xi=(xi1, xi2, …, xiN), 飞行速度为Vi=(vi1, vi2, …, viN)。 通过目标函数的结果比较, 得到t时刻每个微粒的最佳位置(pb)Pi=(pbi1, pbi2, …, pbiN), 以及群体的最优位置(gb)Pi=(gbi1, gbi2, …, gbiN), 然后依据式(5)和式(6)更新各微粒的位置和速度[15]。
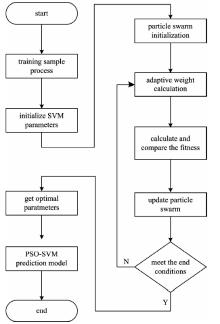
式中, u是惯性权值, 用来调控vi, j(t)对vi, j(t+1)的影响; r是随机数, 范围在0~1之间; c1和c2是加速因子。 利用PSO算法对SVM参数选择优化的建模流程如图1所示。
 | 图1 PSO-SVM建模流程图Fig.1 Flow chart of PSO-SVM modeling |
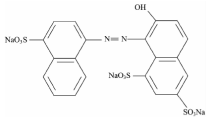
胭脂红是一种偶氮类食用合成色素, 分子结构如图2所示, 其平面共轭式的结构, 可以有效扩大吸光的截面, 增加荧光强度, 并且分子结构中的给电子取代基— OH, 可以促进荧光的发射。 结合这些结构上的优势分析, 可根据胭脂红发射出的荧光, 使用荧光光谱技术定性定量的分析胭脂红。
 | 图2 胭脂红分子结构Fig.2 Molecular structure of carmine |
实验仪器为FS920荧光光谱仪, 检测的波长范围为200~900 nm, 实验中设置激发波长为230~359 nm, 步长为3 nm, 发射波长为385~650 nm, 步长5 nm, 狭缝宽度为2.8 mm。 从上海Elisa生物试剂公司购得胭脂红和苋菜红固体粉末, 取胭脂红、 苋菜红固体粉末各30 mg, 分别溶于1 L纯净水中, 配置得到浓度为30 μ g· mL-1的胭脂红、 苋菜红水溶液作为一级储备液。 用移液枪分别取两种色素的一级储备液, 配置胭脂红、 苋菜红单体色素溶液, 浓度同为10 μ g· mL-1, 同时配取不同浓度的混合溶液样本, 其中胭脂红的浓度在0.1~30 μ g· mL-1之间, 干扰色素苋菜红的浓度在0.1~10 μ g· mL-1之间随意添加。
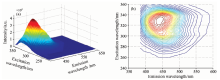
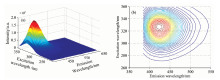
选择浓度为10 μ g· mL-1的胭脂红单色水溶液样本, 实验得到其荧光光谱如图3所示, 结合三维图和等高线图可以看出, 胭脂红溶液在波长λ ex/λ em=330/440 nm时荧光强度最大、 存在荧光特征峰。 再选取胭脂红的质量浓度同样为10 μ g· mL-1的混合色素样本溶液, 实验得到的荧光光谱图如图4所示。 与同质量浓度的胭脂红单色水溶液相比, 胭脂红溶液的荧光特征峰平移到了λ ex/λ em=326/430 nm的位置, 荧光信息更加集中, 荧光强度提高了将近一个数量级。 因为荧光特征峰涵盖了绝大部分的荧光信息, 有利于进一步的荧光特征分析, 因此最佳激发波长选择为λ ex=326 nm。
 | 图3 胭脂红溶液的荧光光谱 (a): 三维荧光光谱; (b): 溶液的等高线图Fig.3 Fluorescence spectra of carminum solution (a): Three dimensional fluorescence; (b): Contour map of solution |
 | 图4 混合溶液的荧光光谱 (a): 三维荧光光谱; (b): 混合溶液的等高线图Fig.4 3-D (three dimensional) fluorescence spectra of mixture (a): Three dimensional fluorescence spectra of mixture; (b): Contour map of mixture |
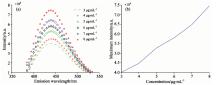
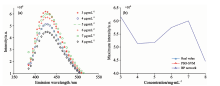
为了比较胭脂红溶液在加入干扰色素苋菜红后, 其荧光强度与浓度变化的关系, 根据上述分析的荧光特征峰位置, 各选取6组不同浓度的胭脂红单色样本以及混合色素样本, 其中, 胭脂红的物质浓度同为为3, 4, 5, 6, 7和8 μ g· mL-1, 苋菜红的物质浓度为2 μ g· mL-1。
6组样本在激发波长λ ex=326 nm时的发射光谱和荧光强度的关系如图5、 图6所示, 在单色样本中, 荧光强度与胭脂红浓度几乎呈线性关系。 而在混合溶液中, 随着胭脂红浓度的增加, 荧光强度呈现出先降后增再降的过程, 即混合溶液的荧光光谱并不是由各组分光谱简单的叠加, 在吸收光谱的过程中, 胭脂红溶液与苋菜红溶液存在竞争和相互影响。 因此需要结合化学计量学等算法建立精确的检测模型, 进而检测物质浓度。
 | 图5 胭脂红溶液浓度与荧光强度的关系 (a): 不同浓度胭脂红溶液发射光谱; (b): 不同浓度溶液最大荧光强度Fig.5 Relationship between the fluorescence intensity and carminum solution with different concentrations (a): Emission spectrum of carminum solution at different concentration; (b): Maximum fluorescence intensity of different concentrations of carminum solution |
 | 图6 混合溶液浓度与荧光强度的关系 (a): 不同浓度溶液发射光谱; (b): 不同浓度混合溶液最大荧光强度Fig.6 Relationship between the fluorescence intensity and mixture with different concentrations (a): Emission spectrum of mixture at different concentration; (b): Maximum fluorescence intensity of different concentrations of mixture |
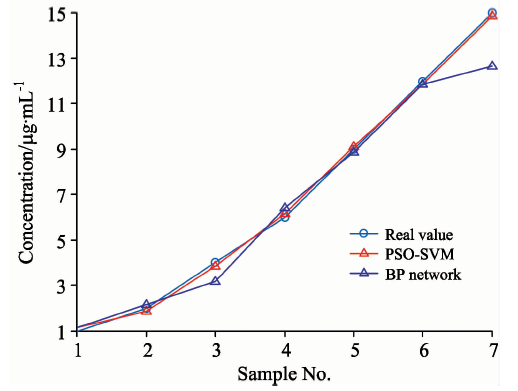
从配制的25组胭脂红、 苋菜红混合溶液中选择7组作为预测样本, 其中, 胭脂红的浓度分别为1.0, 2.0, 4.0, 6.0, 9.0, 12和15 μ g· mL-1, 其余的18组作为训练样本。
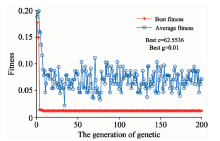
选择各组样本在激发波长λ ex=326 nm 下对应的荧光强度, 作为检测模型的输入, 以胭脂红的预测浓度作为输出。 先对PSO 的参数进行初始化设置: M=20, Tm=200, u=0.7, c1=1.5, c2=1.7, C∈ [0.1, 100], g∈ [0.01, 1 000]。 PSO训练过程的适应度变化曲线如图7所示, 输出的最佳参数值为Best c=62.553 6, Best g=0.01。 将所得的最佳参数输入PSO-SVM模型, 得到7组预测样本的浓度预测结果。 如图8所示, 通过PSO-SVM算法得到胭脂红浓度的预测值与真实值之间的相关系数为0.999, 高于BP算法得到的0.972相关系数, PSO-SVM的输出值更接近真实值。
 | 图7 PSO的适应度变化曲线Fig.7 Fitness curve of PSO |
 | 图8 两种算法的浓度预测结果Fig.8 Concentration predictions of two optimized algorithms |
PSO-SVM与BP预测的结果分析如表1所示。 PSO-SVM模型检测的7组样品预测浓度分别为: 1.146 9, 1.860 6, 3.854 4, 6.146 9, 9.133 8, 11.857 6, 14.859 8 μ g· mL-1, 7组预测样本的平均回收率为100.84%, 均方根误差(RMSEP)为1.03× 10⁻⁴。 与BP的预测结果相比, PSO-SVM预测的平均回收率更高且均方根误差更低, 检测性能更优。
| 表1 PSO-SVM预测结果 Table 1 The results of PSO-SVM prediction |
在食品中多种色素联用的应用背景下, 模拟食品中多种色素相互影响的环境, 构造PSO算法与SVM相结合的胭脂红溶液浓度和荧光强度的预测模型。 将预测结果与BP的预测结果相比较, PSO-SVM的平均回收率高0.6%, 同时均方根误差低一个数量级。 预测结果表明, 用荧光光谱技术与 PSO-SVM相结合的方法, 能够有效地检测出混合溶液中胭脂红的浓度, 且准确度比BP检测方法有更进一步的提升。 该方法在更多色素混合的情况下运用有待进一步研究。
The authors have declared that no competing interests exist.
| [1] |
|
| [2] |
|
| [3] |
|
| [4] |
|
| [5] |
|
| [6] |
|
| [7] |
|
| [8] |
|
| [9] |
|
| [10] |
|
| [11] |
|
| [12] |
|
| [13] |
|
| [14] |
|
| [15] |
|