

利用紫外和荧光光谱指示臭氧降解典型内分泌干扰物的研究
[司秀荣1, 2  , 金洁
, 金洁3 , 付旭1 , 吴小芳1 ]
, 金洁|
|


污水处理和再生回用是缓解我国水污染严重和水资源紧张的有效途径。二级出水水量大、稳定且水质相对良好, 是污水再生回用的良好水源。 然而, 二级出水中广泛存在内分泌干扰物(endocrine disrupting compounds, EDCs), 对其再生回用形成了潜在的安全风险。 臭氧氧化是去除EDCs的有效方法, 但二级出水中存在着多种有机质, 臭氧降解EDCs的过程中同时和有机质中的活性基团发生反应, 引起一定程度的臭氧衰减, 从而对EDCs的臭氧氧化造成影响。 有机质中与臭氧反应的活性基团变化可反映为特征紫外和荧光光谱的变化。 因此, 可以采用特征紫外和荧光光谱变化来指示臭氧对EDCs的降解效果。 本研究通过考察二级出水中主要的三类有机质代表(腐殖酸、 牛血清蛋白和海藻酸钠)对臭氧衰减动力学的影响, 进一步解析有机质对5种典型EDCs臭氧降解规律的影响, 在此基础上考察特征紫外和荧光光谱与EDCs臭氧降解效果的关系, 以期筛选出二级出水中EDCs臭氧降解效果的指示参数, 并建立其与EDCs降解效率之间的定量关系, 从而以这些指示参数来预测EDCs的臭氧化降解情况, 简化EDCs检测。 该研究中五种目标EDCs(雌酮(E1)、 雌二醇(E2)、 雌三醇(E3)、 17α-乙炔基雌二醇(EE2)和双酚A(BPA))采用超高效液相色谱-双质谱联用技术同时分析定量。 通过考察不同种类二级出水有机质对臭氧衰减动力学和EDCs降解效果的影响发现三种有机质均可促进臭氧衰减, 对EDCs的臭氧化降解效率均有抑制作用, 顺序依次是腐殖酸>牛血清蛋白>海藻酸钠; 三种有机质的紫外-可见光谱特征谱图表明有机质中能与臭氧反应的活性基团在紫外-可见光有特定的响应特征; 三种有机质的三维荧光光谱特征谱图表明富里酸类腐殖质及喹啉类结构对臭氧消耗均有显著的贡献; 腐殖酸在254, 258和280 nm的紫外吸光度及激发波长/发射波长(Ex/Em)=240/396 nm, Ex/Em=345/436 nm的荧光吸光度去除率与臭氧投加量显著相关; 其中280 nm处的特征紫外吸光度UVA280, 特征荧光吸光度Ex/Em=240/396 nm可作为臭氧降解EDCs的指示参数, 具体为UVA280去除率大于18%或者Ex/Em=240/396 nm去除率大于35%时, 1 μmol·L-1的5种EDCs几乎被完全降解。 此研究对污水处理厂臭氧去除EDCs过程中臭氧剂量的优化及EDCs去除效果具有指导作用, 且可避免复杂的EDCs检测。
Biography: SI Xiu⁃rong, (1987—), Lecturer of North China Institute of Aerospace Engineering e⁃mail: hbsixiurong@126.com
Wastewater treatment and reclamation are effective approaches to alleviate the serious water pollution and water shortage in China. Because of its large and stable quantity and excellent quality, secondary effluent is an excellent water source for the reclamation of wastewater. However, the widespread presence of the endocrine disrupting compounds (EDCs) in secondary effluent poses potential safety risks to its reclamation. Ozonation is an effective method to remove EDCs. However, because of the presence of many organic substances in secondary effluent, ozone also reacts with the active groups in organic mattersduring the ozonationdegradation process of EDCs, causing a certain degree of ozone attenuation, and thus, affecting the ozonation of EDCs. The change in active groups of organic matters that react with ozone is reflected in the change of their UV and fluorescence spectra. Therefore, changesin the characteristic UV and fluorescence spectra can be used to indicate the degradation effect of EDCs by ozone. In this study, we investigated the effect of three main organic matters (humic acid (HA), bovine serum albumin (BSA), and sodium alginate (SA)) present in secondary effluent on the kinetics of ozone attenuation and further analyzed the effect of organic matters on the ozonation degradation of 5 typical EDCs. Based on these results, we further investigated the relationship between the characteristic UV and fluorescence spectra and the degradation effect of EDCs by ozone, with the hope of selecting indicator parameters for the ozone-degradation of secondary effluent EDCs and establishing a quantitative relationship between these parameters and the degradation efficiency towards EDCs. Accordingly, these indicator parameters can be used to predict the ozonation degradation of EDCs, thereby simplifying the detection of EDCs. In this study, 5 target EDCs (estrone (E1), estradiol (E2), estriol (E3), 17α-ethinylestradiol (EE2), and bisphenol A (BPA)) were analyzed and quantified using ultraperformance liquid chromatography-mass spectrometry (UPLC/MS/MS). It was found through the investigation of the impact of different organic matters in secondary effluent on the kinetics of ozone attenuation and EDCs degradation that three organic matters promotedozone attenuation and inhibited the ozonation degradation of EDCs with the following descending effect: HA>BSA>SA. The characteristic spectra of these organic matters indicated that the active groups of these organic matters that could react with ozone exhibitedspecific response characteristics in the UV-Vis region. The three-dimensional excitation-emission matrix (EEM) fluorescence spectra of the three organic matters indicated that the fulvic acid-type humic acids and quinoline-type structures contributed significantly to ozone attenuation; the UV absorbance at 254, 258 and 280 nm and the fluorescence absorbance at the excitation/emission wavelengths of (Ex/Em)=240/396 nm and Ex/Em=345/436 nm were significantly correlated with the dosage of ozone. Among those, the characteristic UV absorbance (UVA280) and fluorescence absorbance (Ex/Em=240/396 nm) could be used as indicator parameters for the ozonation degradation of EDCs; specifically, as shown when the UVA280 removal efficiency was greater than 18% or the Ex/Em=240/396 nm removal efficiency was greater than 35%, 1 μmol·L-1 of the five EDCs was nearly completely degraded. The results in this study can be used to guide the optimization of ozone dosage in the removal of EDCs in wastewater plants and the removal efficiency of EDCs. In addition, the complicated detection of EDCs can be avoided.
The reuse of secondary effluent is an effective approach to alleviate the urban water resource shortage in China[1]. However, the widespread presence of the endocrine disrupting compounds (EDCs) in secondary effluent poses potential safety risks to its reclamation and reuse[2]. Chemical oxidation normally exhibits excellent effects towards the degradation of EDCs. In addition, there are abundant choices of available oxidizers. Among those, because of the high efficiency, lack of secondary pollution and easy production, ozone can be applied to the removal of EDCs in secondary effluent[3]. For example, Jiang et al.[4] compared the degradation of estrone (E1), estradiol (E2), estriol (E3), 17α -ethinylestradiol (EE2) and 4-n-nonylphenol (4-n-NP) in simulated and actual surface waters by KMnO4, ferrate, HOCl and O3. The results showed that the oxidative efficiency of KMnO4 was substantially higher than those of ferrate and HOCl, but far lower than that of O3. Noutsopoulos et al.[5] investigated the removal efficiencies of bisphenol A (BPA) and NPin secondary effluent by NaClO. The results showed that the removal efficiencies of BPA and NP were 60%~84%. However, the toxicity test of the degraded products showed that degradation by chlorinated oxidizers resulted in more toxic products. Therefore, the degradation of EDCs with chlorinationrequires further study. However, because of the presence of many organic substances in secondary effluent, during the ozonationdegradation process of EDCs, ozone also reacts with the active groups of organic matters, causing a certain degree of ozone attenuation[6], and thus, affecting the ozonation of EDCs. The change in active groups of organic matters can be reflectedin changesto their UV and fluorescence spectra. Therefore, the change of characteristic UV and fluorescence spectra can be used to indicate the degradation effect ozone towards EDCs.
The three most important organic matters in secondary effluent are proteins, polysaccharides and humus[7, 8]. In this study, we selected a polysaccharide representative (sodium alginate, SA), protein representative (bovine serum albumin, BSA) and humus representative (humic acid, HA) as model substances[3, 9] to investigate the impact of these three organic matters on the attenuation of dissolved ozone (DO3) and further analyze the effect of organic matters on the ozonation degradation of 5 typical EDCs. Based on these results, we further investigated the relationship between the characteristic UV and fluorescence spectra and the degradation effect ozone towards EDCs in the hope of selecting the indicator parameters for the ozone-degradation of secondary effluent EDCs and establishing a quantitative relationship between these parameters and the degradation efficiency of EDCs. Accordingly, these indicator parameters can be used to predict the ozonation degradation of EDCs, thereby simplifying the detection of EDCs.
E1, E2, E3, BPA, HA, BSA and SA were purchased from Sigma-Aldrich (USA); EE2 was purchased from Dr. Ehrenstorfer (Germany). The ultraperformance liquid chromatography-mass spectrometry (UPLC/MS/MS) system (UPLC-Quattro Premier XE) was purchased from Waters (USA). The chromatographic columns (BEH C18) were purchased from Waters (USA). The solid-phase extraction chromatography system (Visiprep DL) was purchased from Supelco (USA). An ozone generator (DHX-SS-1G) from Harbin JiuJiu Electrochemical Engineering Technology Co., LTD (China), was used to generate ozone; the shift of the generator was adjusted to I, and the inlet gas was pure oxygen with a flow rate of 1 L· min-1. The ozone water carried the ozone/oxygen mixture gas to the 4 ℃ ultrapure water to prepare ozone.
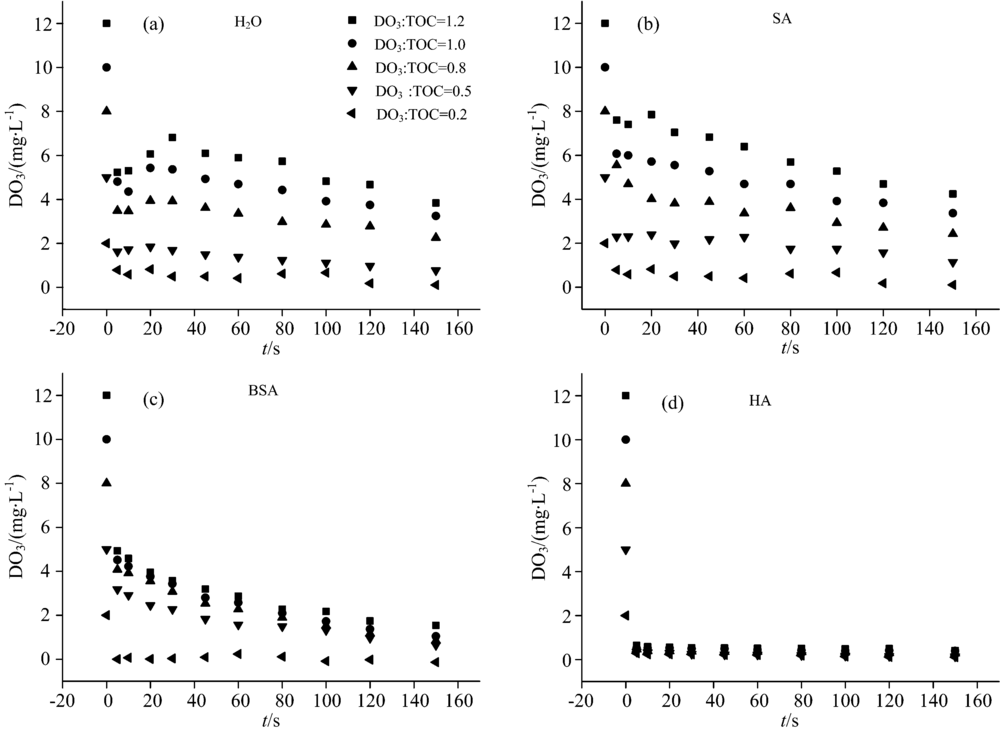
Ultrapure water, NaHCO3, NaCl and CaCl2 were added to the EDCs stock solution and organic substance stock solution to prepare the simulated secondary effluent working solution that contained the three organic matters. The solutions were prepared such that the total organic carbon (TOC)of each organic matter was 20 mg· L-1 and the concentration of EDCs was 1 μ mol· L-1, higher than the concentration in secondary effluent; however, this concentration is typical of small-scale experiments[10, 11]. The working solution (10 mL) was first transferred to a 40 mL sample bottle that contained a magnetic bar, (10-V mL) ultrapure water was then added to the sample bottle, and V mL of ozone water was added to start the reaction. For the DO3: TOC was 0, 0.2, 0.5, 0.8, 1.0 and 1.2, successively. Then, at 5, 10, 20, 30, 45, 60, 80, 100, 120 and 150 s, 0.2 mL of the above solution was transferred to a potassium indigotrisulfonate solution, and the indigo methodwas immediately used to determine the concentration of the D
1.3.1 Analysis methods for EDCs
Solid-phase extraction-chromatography-MS was used to quantify E1, E2, E3, EE2 and BPA in the solution simultaneously. The mobile phase consisted of acetonitrile (A) and ultrapure water (B); the analysis conditions are listed in Table 1.
| Table 1 Analysis conditions of UPLC/MS/MS |
The removal efficiency of EDCs was used to evaluate the effect of ozonation degradation of EDCs; R=
1.3.2 Spectral analysis
The scanning ranges of the three-dimensional excitation-emission matrix (EEM) fluorescence spectroscope (F-7000, Hitachi, Japan) were excitation wavelength/emission wavelengths (Ex/Em) of 220~420 nm (step of 5 nm)/240~600 nm (step of 2 nm). After obtaining the fluorescence intensity corresponding to each Ex/Em, Origin 8.0 was used to plot the contour map. UV-Vis spectroscopy (UV-2401PC, Shimadzu, Japan) was used to scan the full wavelength range of 200~800 nm.
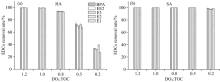
After converting the concentsation to 10 mg· L-1 TOC, the impact of the three organic matters on the attenuation of the DO3 is shown in Fig.1. The difference between the ozone dosage concentration and the concentration of the DO3 at 60 s is defined as the ozone demand (O3 demand, OD). In H2O, when DO3 was 2~12 mg· L-1, the corresponding OD was 1.58~6.11 mg· L-1, and more than half of the DO3 was consumed. In SA, the attenuation of DO3 was close to that of the H2O system. In HA, DO3 was rapidly depleted, and the corresponding OD was 0.80~11.49 mg· L-1. In the BSA medium, the DO3 attenuation rate was between that of the two systems above. Overall, the organic matters significantly promoted the attenuation rate of the DO3. Moreover, the effect produced by HA species was substantially higher than those by polysaccharides and proteins, which agrees with past research results[3].
The effect of the three organic matters on the removal efficiency of the five EDCs was further investigated, and the results are shown in Fig.2. It can be seen from the figure that ozone exhibited excellent removal efficiency for EDCs. In addition, the species of organic matter in the solution yielded a significant effect on the degradation of EDCs. For DO3: TOC≥ 0.8, the removal efficiency of EDCs reached above 90% in all three media. For DO3: TOC=0.5, the removal efficiency of EDCs reached 90% in BSA and SA but was only 68%~73% in HA. For DO3: TOC=0.2, there were significant residues of the five EDCs in HA and BSA; the removal efficiency of EDCs was 68%~76% in the BSA solution, while it was only 26%~39% in the HA solution. These results indicate that the inhibiting effect of the ozonation degradation of EDCs by the three organic matters followed HA> BSA> SA, which agrees with the DO3 attenuation data. Furthermore, the data sufficiently indicated that the organic matters causeda certain degree of ozone attenuation, which decreased the chance of ozonation degradation of EDCs and resulted in the decreased removal efficiency of EDCs. Moreover, the humus-type organic substances presented the greatest inhibitory effect on the ozonation degradation of EDCs.
 | Fig.1 Effect of three kinds of organic matters on dissolved ozone attenuation |
 | Fig.2 Effect of three kinds of organic matters on EDCs removal rate |
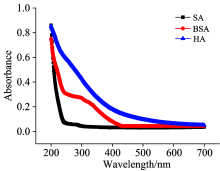
From the results above, the three organic matters exhibited different impacts on the ozone attenuation rate and the ozonation degradation of EDCs. Therefore, we analyzed the structure of the three organic matters in depth. The characteristic UV-Vis spectra of the three organic matters are shown in Fig.3. It can be seen from the figure that the response intensity of the three organic matters followed HA> BSA> SA, which complies with the ozone attenuation and EDCsremoval efficiency results, indicating that the active groups in the organic matters that could react with ozone had specific response characteristics in the UV-Vis region.
 | Fig.3 UV-Vis spectra of three kinds of organic matters |
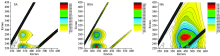
The EEM fluorescence spectra of the three organic matters are shown in Fig.4. Based on the response characteristics of the spectra for the organic matters and the corresponding substance types[13], the spectra can be divided into 5 fluores-cence response regions (as shown in Table 2). It can be seen from the table that the response intensity of the three organic matters at Ex/Em=240/396 nm and Ex/Em=345/436 nm followed HA> BSA> SA, which agrees with the ozone attenuation and EDCs removal efficiency data, indicating that the active groups in the organic matters could react with the ozone responses at Ex/Em=240/396 nm and Ex/Em=345/436 nm, i.e., the fulvic acid-type humic acids and quinoline-type structures contributed significantly to ozone attenuation.
 | Fig.4 Three-dimensional fluorescence spectrum of three kinds of organic matters |
| Table 2 Fluorescence response of the three organic matters |
The aforementioned results show that HA had the greatest inhibiting effect on the ozonation degradation of EDCs. Therefore, we analyzed the change of UV and fluorescence spectra in the presence of HA.
(1) Ultraviolet absorbance (UVA)
Based on the above results and results from the literature[14, 15], the changesin UVA (UVA254, UVA258 and UVA280) that represent aromatic and oxygen-containing aromatic structures were chosen to indirectly indicate the degradation effect on EDCs. It can be seen from Fig.5 that the UVA254, UVA258 and UVA280 of HA decreased with increasing ozone dosage and exhibited an excellent linear relationship. Therefore, the UVA254, UVA258 and UVA280 of HA were used as indicator parameters for the ozone attenuation caused by organic matters. Furthermore, UVA280 was the most sensitive indicator parameter and was chosen for the detailed exploration as follows.
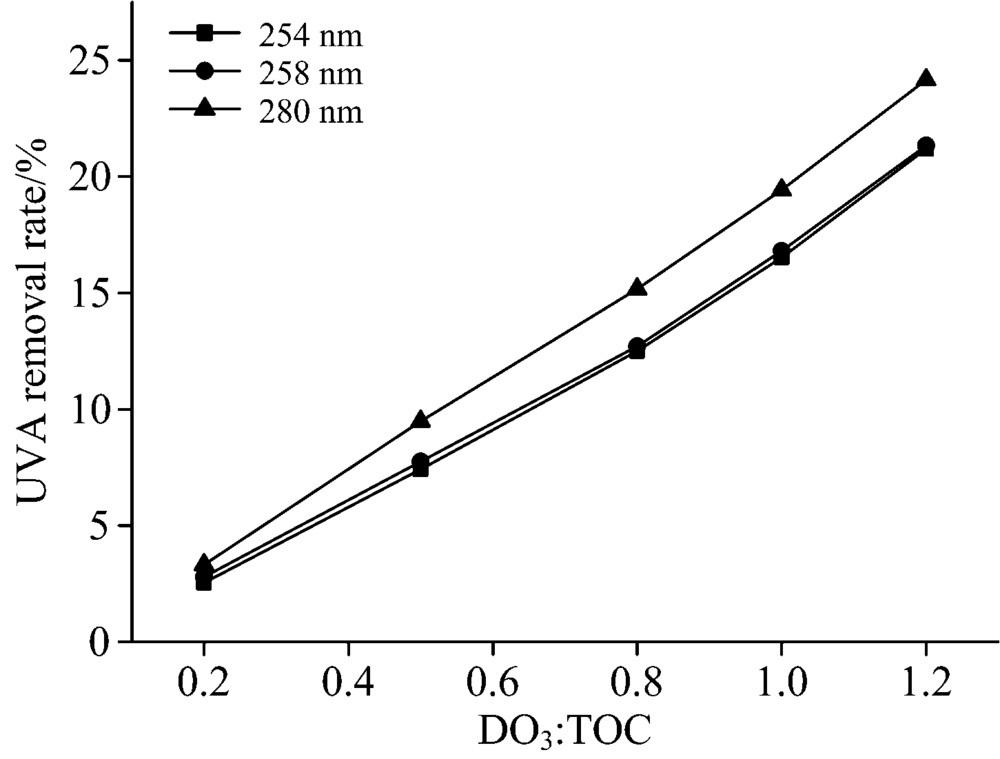 | Fig.5 The relationship between UVA removal rate of HA and O3 dosage |
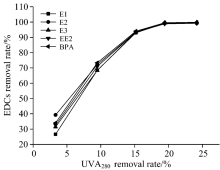
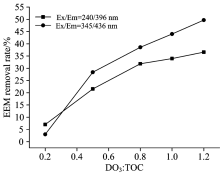
The relationship between the removal efficiency of HA associated with UVA280 and that of EDCs is shown in Fig.6. When the removal efficiency associated with UVA280 was less than 15%, the removal efficiency of the five EDCs increased sharply with increasing removal efficiency of HA. When the removal efficiency of HA associated with UVA280 was greater than 15%, the change in the removal efficiency of EDCs was steady, and when the removal efficiency of HA associated with UVA280 was 18%, the removal efficiency of EDCs reached 100%. Therefore, UVA280 can be used as an indicator parameter to predict the degradation efficiency of EDCs.
 | Fig.6 The relationship between UVA280 removal rate of HA and EDCs removal rate |
(2) Characteristics of the EEM fluorescence spectra
According to the above results, Ex/Em=240/396 nm and Ex/Em=345/436 nm were chosen as references. As shown in Fig.7, the EEM fluorescence spectra show that the removal efficiencyincreased with increasing ozone dosage for the HA solution, exhibitingan excellent linear relationship. Among the paired peaks, Ex/Em=240/396 nm presented a high linear correlation, and thus, was chosen for the detailed exploration.
 | Fig.7 The relationship between EEM removal rate of HA and O3 dosage |
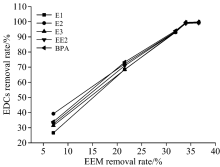
In the presence of HA, the relationship between the removal efficiency associated with Ex/Em=240/396 nm and the removal efficiency of EDCs had a significant linear correlation, as shown in Fig.8. In addition, the removal efficiency of the five EDCs exhibited a similar trend as that of the EEM. When the removal efficiency associated with Ex/Em=240/396 nm was less than 35%, the removal efficiency of EDCs increased significantly with increasing effective removal efficiency presented in the EEM. When the removal efficiency associated with Ex/Em=240/396 nm was greater than 35%, the removal efficiency of EDCs nearly reached 100%. Therefore, Ex/Em=240/396 nm can be used as an indicator parameter to predict the degradation efficiency of EDCs.
 | Fig.8 The relationship between Ex/Em=240/396 nm removal rate of HA and EDCs removal rate |
In this study, we investigated the impact of three types of organic matter on the ozone attenuation rate and the ozonation degradation of 5 typical EDCs.Furthermore, we explored the relationship between the index parameters of UV and fluorescence spectra and the removal efficiency towards EDCs. The following conclusions were drawn:
(1) The promoting effect of organic matter on the attenuation rate of the DO3 and the inhibiting effect on the degradation efficiency of EDCs follow the descending order of HA> BSA> SA.
(2) The characteristic UV spectrum of UVA280 and fluorescence spectrum Ex/Em=240/396 nm can be used as indicator parameters to predict the ozonation degradation of EDCs. Clearly, when the removal efficiency associated with UVA280 was greater than 18% or that associated with Ex/Em=240/396 nm was greater than 35%, 1 μ mol· L-1 of the five EDCswas nearly completely degraded.
The authors have declared that no competing interests exist.
| [1] |
|
| [2] |
|
| [3] |
|
| [4] |
|
| [5] |
|
| [6] |
|
| [7] |
|
| [8] |
|
| [9] |
|
| [10] |
|
| [11] |
|
| [12] |
|
| [13] |
|
| [14] |
|
| [15] |
|