
水体细菌微生物多波长透射光谱特征分析研究
[甘婷婷1, 2  , 赵南京
, 赵南京1, 2, * , 胡玉霞1, 2, 3 , 喻慧娟1, 2, 3 , 段静波1, 2 , 刘建国1, 2 , 刘文清1, 2 ]
, 赵南京, 胡玉霞|
|


多波长透射光谱能够反映出样品细胞大小、 形状、 内部结构和化学组分等丰富而独特的信息, 是微生物快速、 实时、 在线检测与识别的有利工具。 将多波长透射光谱技术应用于水体致病性细菌微生物的快速有效检测对控制水体细菌微生物污染及保护饮用水源水质安全具有重要的现实意义。 为了建立及发展基于多波长透射光谱技术的水体致病性细菌微生物快速有效的检测方法, 采用紫外-可见分光光度计获取了多种水体致病性细菌微生物(如: 肺炎克雷伯氏菌、 鼠伤寒沙门氏菌、 金黄色葡萄球菌和大肠杆菌)在200~900 nm波段的多波长透射光谱, 对比分析了不同细菌及同种细菌在不同浓度时的多波长透射光谱特征。 结果表明: 对于同种细菌, 当细菌浓度发生变化时, 400~900 nm波段透射光谱形状较为一致, 并且在400, 450, 500和550 nm波长处的光密度值与浓度具有很好的线性关系, 该波段由细菌体的散射起主要作用; 但在200~400 nm波段范围内, 细菌透射光谱的形状随细菌浓度的变化而变化, 在200, 258, 300和350 nm波长处的光密度值与细菌浓度分别具有很好的二次多项式关系。 根据微粒的Mie散射理论, 采用Levenberg-Marquardt非线性最小二乘方法对测得的四种细菌透射光谱进行了散射光谱和吸收光谱拟合, 并对比分析了不同细菌散射光谱特征和吸收光谱特征, 结果表明: 四种细菌散射光谱的特征峰均在245 nm波长处, 但该波长处的光密度值具有明显差异性, 这与不同细菌外部结构及内部结构细胞器的大小、 形状等不同有关; 而四种细菌吸收光谱特征峰均在260 nm波长处, 且不同细菌在240~400 nm波段内吸收光谱也具有明显差异性, 这与不同细菌细胞内的核酸、 蛋白质等化学组分含量不同有关。 该研究表明对于不同种细菌及具有不同浓度的同种细菌, 测得的多波长透射光谱及计算出的散射光谱和吸收光谱特征都具有明显的不同, 通过多波长透射光谱解析可以获得细菌多种特征参数, 多波长透射光谱可以被用于快速有效检测水体中的致病性细菌微生物。 该研究为发展水体细菌微生物快速在线监测仪提供了重要依据。
, ZHAO Nan-jing, HU Yu-xiaBiography: GAN Ting-ting, (1986-), female, assistant research fellow, Anhui Institute of Optics and Fine Mechanics, Chinese Academy of Sciences e-mail: ttgan@aiofm.ac.cn
Multi-wavelength transmission spectrum can reflect the unique information on cell size, shape, internal structure and chemical composition of a sample, so multi-wavelength transmission spectroscopy is a powerful technique for real-time and in-site detection and identification of cells. And the development of multi-wavelength transmission spectroscopy for the rapid and effective detection of bacterial microbes in water will be of great significance to the control of microbial contamination in water and the protection of the safety and health of water quality. In this paper, in order to develop the method of rapidly and accurately detecting the pathogenic bacterial microbes in water based on multi-wavelength transmission spectroscopy, the multi-wavelength transmission spectra in the range of 200~900 nm of various pathogenic bacterial microbes such as Klebsiella pneumoniae, Salmonella typhimurium, Staphylococcus aureus and Escherichia coli were obtained adopting UV-Vis spectrophotometer for the first time, respectively. And the spectral features of different bacteria and the same bacteria with different concentrations were compared and analyzed. The results demonstrate that for different bacteria, when the concentration changes, the spectral shapes in the range of 400~900 nm are consistent, and the optical density value at 400, 450, 500 and 550 nm respectively has a very good linear relationship with bacterial concentration. But in the range of 200~400 nm, the spectral shapes change with the change of bacterial concentration, and the optical density value at 200, 258, 300 and 350 nm respectively has a very good quadratic polynomial relationship with bacterial concentration. According to Mie scattering theory, Levenberg-Marquardt nonlinear least square method was adopted to calculate the scattering spectra and absorption spectra based on the measured transmission spectra of different bacteria. And the spectral features of normalized scattering spectra and absorption spectra of different bacteria were compared and analyzed. The results demonstrate that for the four types of bacteria, all the characteristic spectral peaks of scattering spectra are at 245 nm. But for different bacteria, the optical density values at characteristic peak are obviously different, which arises from the differences in cell size and shape of different bacteria. Furthermore, all the characteristic spectral peaks of absorption spectra of the four types of bacteria are at 260 nm. But for different bacteria, the spectral absorption band between 240~400 nm and spectral intensity at 260 nm are obvious different, which are attributed to the difference in content of chemical composition such as nucleic acid and protein in different bacteria. This study indicates that for the different bacteria and the same bacteria with different concentrations, the spectral features of multi-wavelength transmission spectra, calculated scattering spectra and absorption spectra are obviously different. And various parameters of bacteria can be obtained by the interpretation of multi-wavelength transmission spectra. So multi-wavelength transmission spectroscopy can be used to rapidly and effectively detect pathogenic bacterial microbes in water. This study provides an important basis for the development of rapid and on-line monitoring instrument of bacteria in water.
The safety and hygiene of water quality is directly related to human health. Pathogenic bacteria in water such as Staphylococcus aureus and Escherichia coli, possessing formidable pathogenicity, can cause disease outbreak and endanger human body health. And fecal coliform bacteria has been one of the important detection indexes in drinking water quality standards of countries around the world and the World Health Organization (WHO). So the development of method and technology of rapid, efficient and accurate detection of bacterial microbes in water will be of great significance to the control of microbial contamination in water and the protection of the safety and health of water quality.
At present, the detection methods of bacterial microbes mainly include traditional culture method[1, 2, 3], polymerase chain reaction method[4, 5] and ATP bioluminescence method[6, 7, 8], etc. The traditional culture method needs field sampling, subsequent culture in appropriate media, count and analysis. Although the method is highly accurate, it is cumbersome, time-consuming and can’ t realize the rapid and on-line detection of pathogenic bacteria in water. Polymerase chain reaction uses the specific fragment of bacterial nucleic acid to detect and recognize bacterial species. Although the method is also highly accurate, the process requires dedicated operators and complex and expensive equipment, and the method is not suitable for field application. ATP bioluminescence assay method is simple, rapid and can realize real-time and in-site detection of the total number of bacterial microbes. But the method can’ t realize the identification of bacterial species.
Multiwavelength transmission spectroscopy is a spectroscopy analysis method which comes from the interaction of structure and chemical composition of cells presented in a sample with incident light. And it is generated from both the scattering and absorption characteristics of the sample. A typical multiwavelength transmission spectrum can reflect various information of a sample, such as the shape, size, internal structure, chemical composition and concentration of cells[9, 10, 11, 12]. And compared with the above detection methods of bacterial microbes, multiwavelength transmission spectroscopy is a simple, rapid, versatile, inexpensive and reliable analytical tool. It can realize not only the real-time and in-site detection of microorganisms and cells, but also the identification of microorganism species and cell types.
The application of multiwavelength transmission spectroscopy in detection and identification of bacterial microbes in water is of great potential. The detection of pathogenic bacteria in water can be conducted by measuring the multiwavelength transmission spectra of sample, analyzing the spectral features of different bacterial microbes, and then extracting the sample information from the measured spectra. So the analysis of spectral features of multiwavelength transmission spectra for different bacterial microbes is the key and basis of detection and identification of pathogenic bacteria in water using multiwavelength transmission spectroscopy.
In this paper, the multiwavelength transmission spectra over a wavelength range of 200~900 nm of Klebsiella pneumoniae, Salmonella typhimurium, Staphylococcus aureus and Escherichia coli, which are the pathogenic bacterial microbes commonly present in water, were obtained adopting UV-Vis spectrophotometer, respectively. The spectral features of this four types of bacteria with different concentrations were compared and analyzed. According to Mie scattering theory of particles, Levenberg-Marquardt nonlinear least square method was adopted to calculate the scattering spectra and absorption spectra based on the measured transmission spectra of the four types of bacteria. And the spectral features of the normalized scattering spectra and absorption spectra of different bacteria were compared and analyzed. This study provides the basis for rapid and accurate detection and identification of bacterial microbes in water using mutiwavelength transmission spectroscopy technology.
Klebsiella pneumoniae (CICC #21106), Salmonella typhimurium (CICC #21913), Staphylococcus aureus (CICC #21648), and Escherichia coli (CICC #10389) were obtained from China Center of Industrial Culture Collection (CICC), Beijing, China. Beer extract (biochemical reagent), Sodium chloride (analytically pure), Sodium hydroxide (analytically pure) and Agar (biochemical reagent) were purchased from Sinopharm Chemical Reagent Co., Ltd (Shanghai, China). Peptone (biochemical reagent) was purchased from Beijing Aobox Biotechnology Co., Ltd (Beijing, China). Ethyl alcohol (analytically pure) was purchased from Shanghai Titan technology Co., Ltd (Shanghai, China). All the water used in the experiment was double deionized water purified by a Millipore Milli-Q Purification System. The liquid growth media were prepared by 0.3% beer extract, 0.5% peptone, 0.5% sodium chloride and double deionized water. And the pH of media was adjusted to 7.2 by dropwising 1 mol· L-1 NaOH or HCl.
First, the prepared liquid growth media were sterilized in a vertical pressure steam sterilization pot. In a sterile operating platform, Klebsiella pneumoniae, Salmonella typhimurium, Staphylococcus aureus and Escherichia coli on the agar slant culture media stored at 4 ℃ were inoculated to beakerflasks containing sterilized liquid growth media, respectively. Then the beakerflasks were placed in an intelligent illuminating incubator and the four types of bacteria were cultured 19~20 h at 37 ℃. In order to avoid the interference of growth media to the spectral measurements of bacteria, the bacterial pure cultures were washed and separated using the sterilized deionized water to eliminate the growth media. The washing procedures of bacterial pure cultures are as follows: the bacterial pure cultures were centrifuged for 5 min at 12 000 r· min-1, then they were the supernatants were rapidly drawn off and discarded to remove the growth media. The remaining bacterial agminated pellets were resuspended in sterilized deionized water and vibrated gently, then centrifuged once again. The washing process was repeated at least three times. Finally, the bacterial suspensions of Klebsiella pneumoniae, Salmonella typhimurium, Staphylococcus aureus and Escherichia coli were obtained by resuspending the pellets of clean bacterial cells in steriled deionized water. And the steriled deionized water was also used to dilute the samples to obtain the suspensions of the four types of bacteria with different concentrations. The plate count method was adopted to determine the concentration of bacterial suspensions.
All multiwavelength transmission spectra of bacterial suspensions recorded using a double beam UV-Vis spectrophotometer (UV2550, Shimadzu, Japan) have an acceptance angle smaller than 2 degrees, and the deionized water was as reference solution. Scanning speed of intermediate speed and sampling interval of 1 nm were used for all spectral measurements. And the spectra in the region between 200~900 nm were recorded. All measurements were conducted at room temperature using two 1 cm pathlength quartz cuvettes containing deionized water and sample, respectively.
Multiwavelength transmission spectra of bacterial microbes reflect the extinction property of bacteria and consist of the scattering and absorption phenomena resulting from the interaction of incident light with bacterial cells. In this study, the concentrations of different bacteria suspensions were determined by the plate count method. And the multiwavelength transmission spectra of Klebsiella pneumoniae, Salmonella typhimurium, Staphylococcus aureus and Escherichia coli with different concentrations are shown in Fig.1— Fig.4.
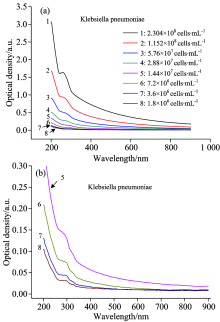
 | Fig.1 Multiwavelength transmission spectra of Klebsiella pneumoniae with different concentrations |
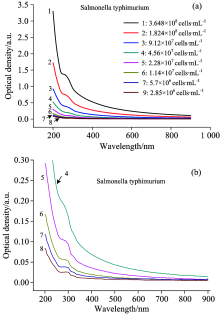
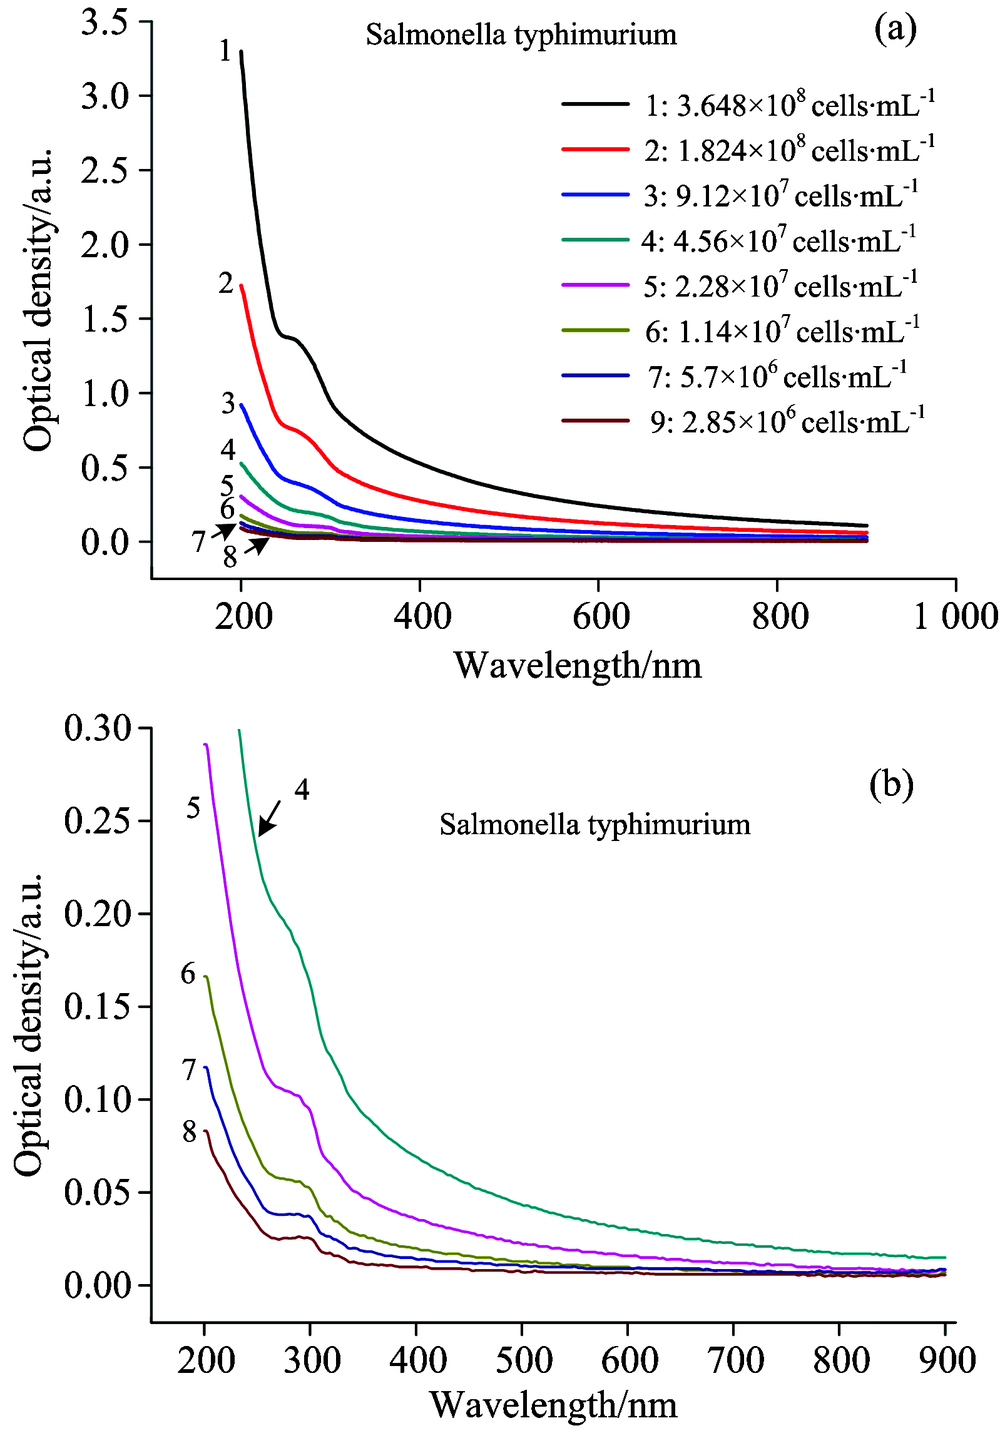 | Fig.2 Multiwavelength transmission spectra of Salmonella typhimurium with different concentrations |
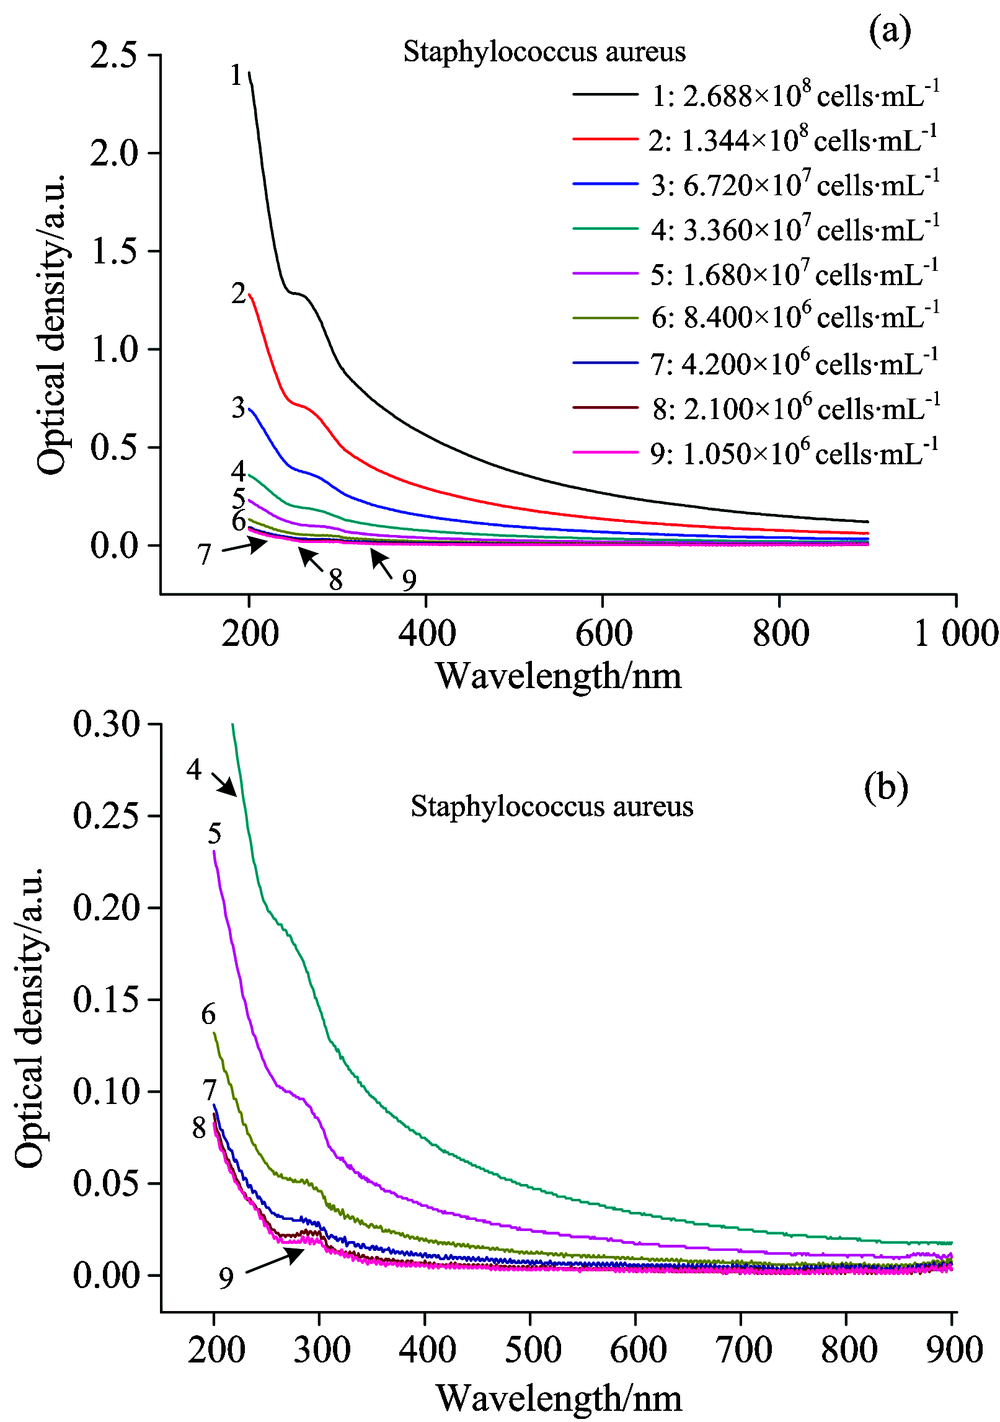 | Fig.3 Multiwavelength transmission spectra of Staphylococcus aureus with different concentrations |
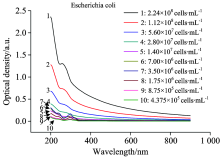
 | Fig.4 Multiwavelength transmission spectra of Escherichia coli with different concentrations |
From Fig.1— Fig.4 we can see that for Klebsiella pneumoniae, Salmonella typhimurium, Staphylococcus aureus and Escherichia coli, when the concentration changes, the features of transmission spectra in the region of 400~900 nm are relatively similar. But the features of transmission spectra in the region of 200~400 nm are obvious different. So the spectral features are analyzed by dividing the multiwavelength transmission spectra into two wavelength ranges of 200~400 and 400~900 nm.
2.1.1 Spectral features in the wavelength region of 400~900 nm
For the transmission spectra between 400~900 nm of Klebsiella pneumoniae, Salmonella typhimurium, Staphylococcus aureus and Escherichia coli with different concentrations shown in Fig.1— Fig.4, we can see that the spectral shapes are flat and relatively consistent, and the optical density values decrease with wavelength increasing. And with the decrease of bacterial concentration, the optical density values at correspongding wavelength also gradually reduce. According to Luis H. Garcia-Rubio[9, 10] reported, the transmission spectra of bacteria in the region of 400~900 nm are mainly generated from the scattering interaction of light with bacterial cells and determined by the cell number, size and shape of bacteria. And the absorption property of the sample is very weak and can be considered negligible in this spectral region.
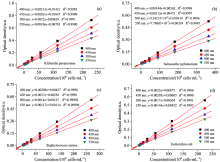
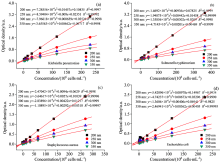
In the same growth stage of the same bacteria, the cell size, shape, internal structure of bacterial cells are all the same. So the relationship between the optical density of the transmission spectra in the range of 400~900 nm and bacterial concentrations is studied. We can notice that for the four types of bacteria, the optical density values in the wavelength range of more than 550 nm are very low as is shown in Fig.1— Fig.4. So the optical density values at 400, 450, 500 and 550 nm were selected to study the relationship between optical density and bacterial concentration. For Klebsiella pneumoniae, Salmonella typhimurium, Staphylococcus aureus and Escherichia coli, the plots of optical density values versus bacterial concentration are shown in Fig.5, which exhibit very good linear relationships, and the linear correlation coefficients R2 are all greater than 0.99. Moreover, for the same bacteria, the shorter the wavelength is, the greater the slope of calibration curve is and the higher the sensitivity is. These results indicate that the transmission spectra in the region of 400~900 nm can realize the quantitative analysis of bacterial microbes.
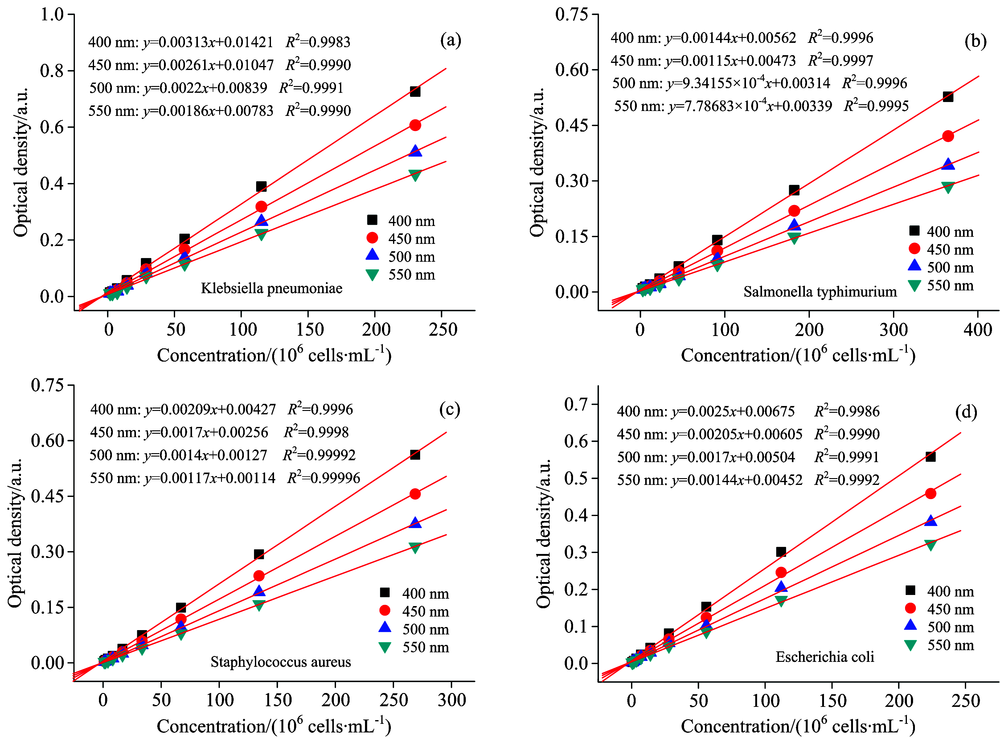 | Fig.5 The plots of optical density values at 400, 450, 500 and 550 nm versus concentration (a): Klebsiella pneumoniae; (b): Salmonella typhimurium; (c): Staphylococcus aureus; (d): Escherichia coli |
2.1.2 Spectral features in the wavelength region of 200~400 nm
For the transmission spectra between 200~400 nm of Klebsiella pneumoniae, Salmonella typhimurium, Staphylococcus aureus and Escherichia coli with different concentrations shown in Fig.1— Fig.4, the optical density values are significantly higher than the optical density values in the wavelength region of 400~900 nm. According to what Luis H. Garcia-Rubio[9, 10] reported, the transmission spectra of bacteria in the region of 200~400 nm are generated from the combination of scattering interaction and absorption interaction of light with bacterial cells. The scattering property is determined by the cell number, size and shape of bacteria, and the absorption property is determined by the chemical composition in bacterial cells.
For different bacteria, with the change of bacterial concentration, the shapes of transmission spectra between 200~400 nm are different as is shown in Fig.1— Fig.4. We can see from Fig.1 that for Klebsiella pneumoniae, the transmission spectrum of 2.304× 10⁸ cells· mL-1 bacterial suspension has a very obvious characteristic peak at 258 nm. And in the concentration range from 7.2× 10⁶ to 1.152× 10⁸ cells· mL-1, the transmission spectra of bacterial suspension have obvious characteristic spectral band between 250~275 nm, although without the characteristic peak at 258 nm. Moreover, the lower bacterial concentration is, the wider the range of characteristic spectral band is. For example, the characteristic spectral band of 1.152× 10⁸ cells· mL-1 bacterial suspension is roughly in the range of 250~275 nm, but the characteristic spectral band of 7.2× 10⁶ cells· mL-1 bacterial suspension is roughly in the range of 250~300 nm. When the concentration decreases to 3.6× 10⁶ or 1.8× 10⁶ cells· mL-1, the transmission spectrum has a very obvious characteristic peak at 298 nm.
As can be observed from Fig.2 and Fig.3 that for Salmonella typhimurium and Staphylococcus aureus with different concentrations, their spectral features are similar. The shapes of transmission spectra between 200~400 nm are slightly different with the change of bacterial concentration. When the concentrations of bacterial suspensions are relatively higher, the transmission spectra have obvious characteristic spectral band between 250~275 nm, although no obvious characteristic spectral peak. Moreover, the lower the bacteria concentration is, the wider the range of characteristic spectral band is. For example, the characteristic spectral band of 3.648× 10⁸ cells· mL-1Salmonella typhimurium suspension is roughly in the range of 250~275 nm, but the characteristic spectral band of 1.14× 10⁷ cells· mL-1Salmonella typhimurium suspension is roughly in the range of 250~300 nm. In the same way, the characteristic spectral band of 2.688× 10⁸ cells· mL-1Staphylococcus aureus suspension is roughly in the range of 250~275 nm, but the characteristic spectral band of 4.2× 10⁶ cells· mL-1Staphylococcus aureus suspension is roughly in the range of 250~300 nm. Similar to the above Klebsiella pneumoniae, when the concentration of Salmonella typhimurium decreases to 5.7× 10⁶ or 2.85× 10⁶ cells· mL-1 and the concentration of Staphylococcus aureus decreases to 2.1× 10⁶ or 1.05× 10⁶ cells· mL-1, the transmission spectrum has a very obvious characteristic peak at 298 nm, and the transmission spectrum of Staphylococcus aureus also has a obvious characteristic peak at 234 nm.
From Fig.4 we can see that for Escherichia coli with different concentrations, the shapes of transmission spectra between 200~400 nm are very different. The transmission spectrum of 2.24× 10⁸ cells· mL-1 bacterial suspension has a very obvious characteristic peak at 258 nm. And in the concentration range from 1.4× 10⁷~1.12× 10⁸ cells· mL-1, the transmission spectra of bacterial suspensions has obvious characteristic spectral band between 250~275 nm, although no obvious characteristic peak at 258 nm. In addition, the lower bacteria concentration is, the wider the range of characteristic spectral band is. When the concentration further reduces to 4.375× 10⁵~7× 10⁵ cells· mL-1, the spectral intensity in the range of 200~400 nm first rises then reduces with the decrease of concentration, and the transmission spectra have obvious characteristic peaks at 234 and 300 nm.
According to the above results, we know that for the bacterial suspensions with different concentrations, the spectral features of transmission spectra between 200~400 nm of the four types of bacteria are very different. This is because the transmission spectra of bacteria between 200~400 nm are generated from both the scattering interaction of bacterial cells with light and the absorption interaction of chemical composition with light. For bacteria, the most basic polymers in cells are nucleic acid, protein and bilayer phospholipid membrane[13]. The maximum absorption peak of nucleic acid is in the neighborhood of 260 nm[10]. For protein, only aromatic amino acid and sulfur-containing amino acid have absorption peak in the range of 230~310 nm, including the absorption peak of phenylalanine at 254, 282, 272 and 234 nm, respectively [14, 15]. For bacterial suspension with high concentration, the number of bacteria is more, and the total content of chemical composition in bacterial cells is higher. So both the scattering interaction and absorption interaction are strong. The combined effect of scattering property and absorption property leads to the transmission spectra of Klebsiella pneumoniae and Escherichia coli appearing obvious characteristic peak at 258 nm and the transmission spectra of the four types of bacteria appearing obvious characteristic spectral band at 250~275 nm. The range of characteristic spectral band at 250~275 nm gradually broadens with the decrease of bacterial concentration. This is because the number of bacteria gradually reduces and at the same time the total content of chemical composition in cells also decreases with the decrease of bacteria concentration. And the lower the bacterial concentration is, the weaker both the scattering interaction and the absorption interaction of bacteria are, which leads to the reduction of transmission spectral intensity and the broadening of characteristic spectral band range. For bacterial suspensions with lower concentration, all the transmission spectra of Klebsiella pneumoniae, Salmonella typhimurium, Staphylococcus aureus and Escherichia coli have characteristic spectral peak at 298 or 300 nm, in addition the transmission spectra of Staphylococcus aureus and Escherichia coli also have characteristic spectral peak at 234 nm. This is because in the bacterial suspensions with lower concentration, the number of bacteria is less, and the absorption interaction of total chemical composition in cells is stronger than the scattering interaction of bacteria. So the characteristic spectral peaks at 298 nm or 300 nm is attributed to the integrated absorption of aromatic amino acids and nucleic acid. And the characteristic spectral peaks at 234 nm is the absorption peak of peptide linkages in protein molecular of bacterial cells.
Because the transmission spectra of Klebsiella pneumoniae and Escherichia coli with higher concentrations have a absorption peak at 258 nm, in order to analyze the relationship between the optical density values of transmission spectra in the range of 200~400 nm and bacterial concentrations, the optical density values at 200, 258, 300 and 350 nm of transmission spectra in Fig.1— Fig.4 were selected to establish the relation curves. For Klebsiella pneumoniae, Salmonella typhimurium, Staphylococcus aureus and Escherichia coli, the plots of optical density values versus bacterial concentrations are shown in Fig.6. As can be observed in Fig.6 that for Klebsiella pneumoniae, Salmonella typhimurium and Staphylococcus aureus, the optical density values at 200, 258, 300 and 350 nm have a very good quadratic polynomial relationship with the concentrations, respectively. And the correlation coefficients R2 are all greater than 0.999. Especially for 258 nm, the correlation coefficients R2 are all greater than 0.9999. In contrast, for Escherichia coli, the quadratic polynomial relationships between optical density values at 200 or 300 nm and concentrations are not very good, but the quadratic polynomial correlation coefficients R2 for 258 and 350 nm are still greater than 0.999. The results obtained above can provide a good basis for the quantitative analysis of bacterial microbes in water using wavelength transmission spectroscopy.
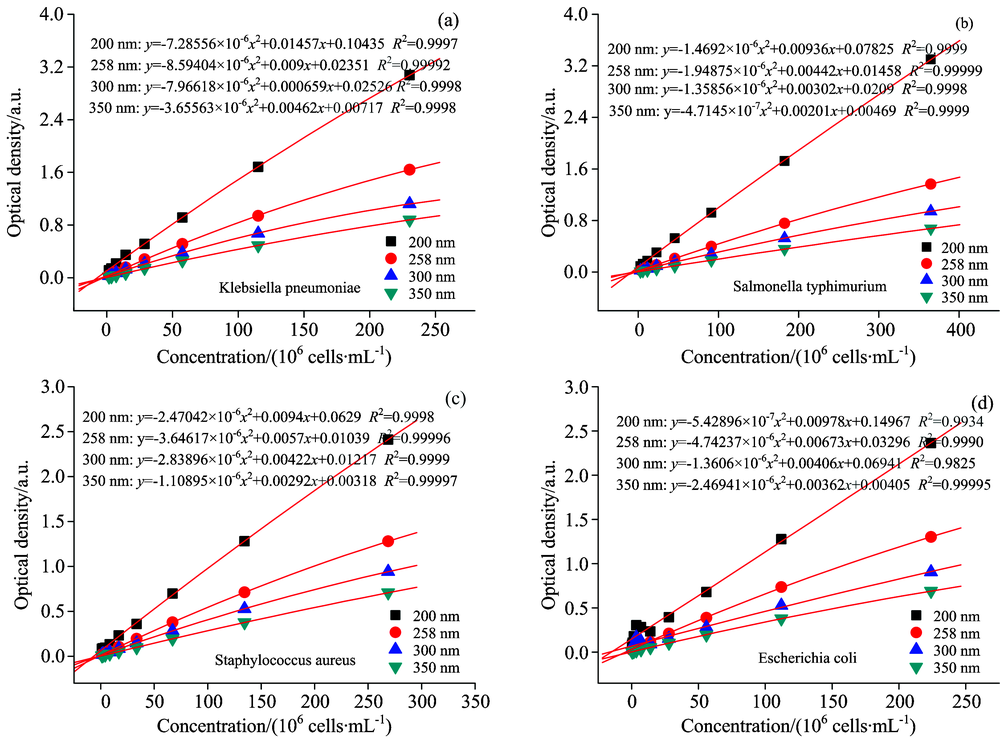 | Fig.6 The plots of optical density values at 200, 258, 300 and 350 nm versus concentration (a): Klebsiella pneumoniae; (b): Salmonella typhimurium; (c): Staphylococcus aureus; (d): Escherichia coli |
In order to compare the spectral features of different bacteria, the transmission spectra of Klebsiella pneumoniae, Salmonella typhimurium, Staphylococcus aureus and Escherichia coli were deconvoluted based on light scattering theory.
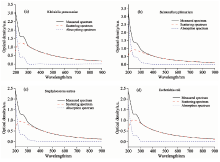
According to the above analysis we know that the transmission spectra between 400~900 nm of the four types of bacteria in Fig.1— Fig.4 are mainly generated from the scattering property of bacteria, and the contribution of absorption interaction is extremely weak and negligible. So based on the model and spectral deconvolution techniques reported by Luis H. Garcia Rubio[9, 10], for the transmission spectra between 400~900 nm of 2.304× 10⁸ cells· mL-1Klebsiella pneumoniae, 3.648× 10⁸ cells· mL-1Salmonella typhimurium, 2.688× 10⁸ cells· mL-1Staphylococcus aureus and 2.24× 10⁸ cells· mL-1Escherichia coli in Fig.1— Fig.4, Levenberg-Marquardt nonlinear least squares method was used to calculate the scattering spectra between 400~900 nm. Based on the obtained parameters, the scattering spectra in the range of 200~400 nm were further calculated. And the absorption spectra between 200~900 nm of the four types of bacteria were obtained by the measured transmission spectra subtracting the calculated scattering spectra. The measured transmission spectra, calculated scattering spectra and absorption spectra of Klebsiella pneumoniae, Salmonella typhimurium, Staphylococcus aureus and Escherichia coli are shown in Fig.7.
 | Fig.7 The measured transmission spectra, calculated scattering spectra and absorption spectra of (a) 2.304× 10⁸ cells· mL-1Klebsiella pneumoniae, (b) 3.648× 10⁸ cells· mL-1Salmonella typhimurium, (c) 2.688× 10⁸ cells· mL-1Staphylococcus aureus and (d) 2.24× 10⁸ cells.mL-1Escherichia coli |
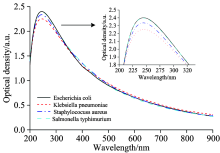
In order to contrast and analyze the features of scattering spectra and absorption spectra of the four types of bacteria and eliminate the influence of concentration, the calculated scattering spectra and absorption spectra between 200~900 nm of the four types of bacteria in Fig.7 were normalized with the total optical density according to equation (1), and the normalized scattering spectra and absorption spectra are shown in Fig.8 and Fig.9, respectively.
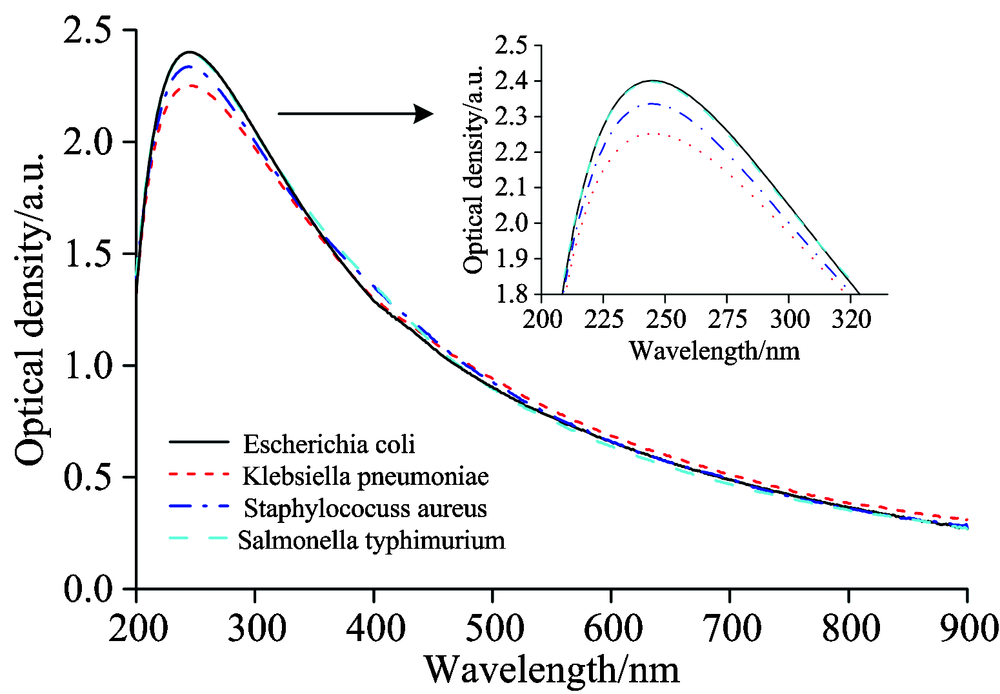 | Fig.8 The normalized scattering spectra of Klebsiella pneumoniae, Salmonella typhimurium, Staphylococcus aureus and Escherichia coli |
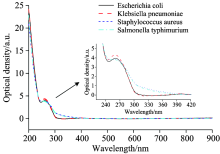
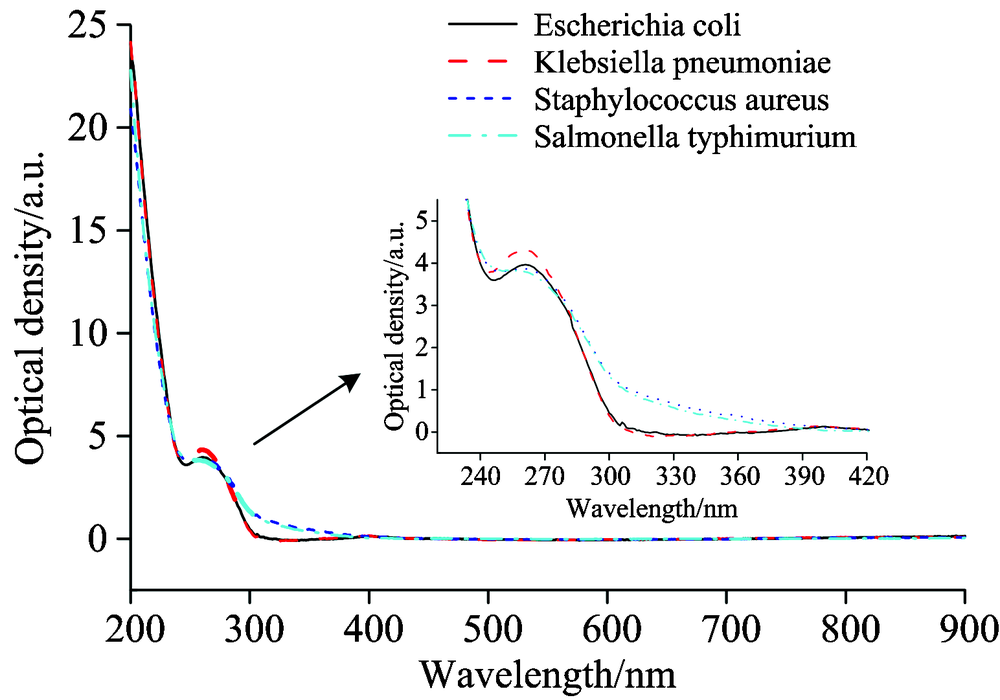 | Fig.9 The normalized absorption spectra of Klebsiella pneumoniae, Salmonella typhimurium, Staphylococcus aureus and Escherichia coli |
We can notice that the spectral shapes of the four types of bacteria are similar as is show in Fig.8. All the scattering spectra of the four types of bacteria have obvious characteristic peak at 245 nm. In the range of 200~245 nm, the spectral intensity rapidly rises with the increase of wavelength. At 245 nm, the spectral intensity has a maximum value. When the wavelength is greater than 245 nm, the spectral intensity gradually decreases with the increase of wavelength.
According to the features of spectral intensity shown in Fig.8, we can see that for the four types of bacteria, the spectral intensities at 245 nm characteristic peak are obvious different. Among the four types of bacteria, the spectral intensity for Escherichia coli and Salmonella typhimurium is relatively approximate, and significantly higher than the spectral intensity for Staphylococcus aureus and Klebsiella pneumoniae. And the spectral intensity for Staphylococcus aureus is also greater than the spectral intensity for Klebsiella pneumoniae. The characteristic peak at 245 nm of the scattering spectrum is the result of the scattering interaction of bacterial cells with incident light. The difference in the spectral intensity at 245 nm characteristic peak shown in Fig.8 arises from the differences in the cell size and shape of different bacteria[9, 10]. The scattering component of the transmission spectra can reflect the information of the cell size, shape and number of bacteria.
The spectral features of normalized absorption spectra of Klebsiella pneumoniae, Salmonella typhimurium, Staphylococcus aureus and Escherichia coli were contrasted and analyzed. We can see from Fig.9 that all the absorption spectra of the four types of bacteria have an obvious absorption peak at 260 nm and an absorption trough at 245 nm. Moreover, the absorption spectra in the range of 240~400 nm are obviously different. The absorption peak at 260 nm is the contribution of the absorption interaction of nucleic acid and protein in bacterial cells with incident light. And the different content of chemical composition such as nucleic acid and protein in different bacteria leads to the difference in spectral intensity at 260 nm characteristic peak and the obvious difference in the absorption spectral band between 240~400 nm[9]. The absorption component of the transmission spectra can reflect the quantitative information on the chemical composition of bacterial cells.
The results obtained from the above analysis of spectral features indicate that multiwavelength transmission spectroscopy is a powerful tool for quantitative detection and qualitative identification of bacterial microbes in water.
In this paper, the spectral features of muliwavelength transmission spectra of Klebsiella pneumoniae, Salmonella typhimurium, Staphylococcus aureus and Escherichia coli with different concentrations were analyzed. The results show that the transmission spectra in the range of 400~900 nm are generated from the scattering property of bacteria and the transmission spectra in the range of 200~400 nm are generate from the combination of scattering property and absorption property of bacteria, which leads to that the spectral features of transmission spectra in the range of 200~400 nm are different from that in the range of 400~900 nm for the four types of bacteria, and for the same bacteria with different concentrations, the spectral features of transmission spectra between 200~400 nm are different. The spectral features of the normalized scattering spectra and absorption spectra of the four types of bacteria after deconvolution were contrasted and analyzed. The results further demonstrate that the differences in cell size, shape and content of chemical composition of different bacteria lead to the difference in spectral features of scattering spectra and absorption spectra for the four types of bacteria. As a result, the mutiwavelength transmission spectrum can reflect the more information on bacterial cell and structure, and multiwavelength transmission spectroscopy is an effective technique for rapid and accurate detection and identification of bacterial microbes in water.
The authors have declared that no competing interests exist.
| [1] |
|
| [2] |
|
| [3] |
|
| [4] |
|
| [5] |
|
| [6] |
|
| [7] |
|
| [8] |
|
| [9] |
|
| [10] |
|
| [11] |
|
| [12] |
|
| [13] |
|
| [14] |
|
| [15] |
|