光谱响应对辐射光谱测温法的影响研究
引用本文
杨斌, 郭浩然, 陈晓龙, 潘科玮, 桂欣扬, 蔡小舒, 刘佩进. 光谱响应对辐射光谱测温法的影响研究[J]. 光谱学与光谱分析, 2018,38(2): 638-642.
YANG Bin, GUO Hao-ran, CHEN Xiao-long, PAN Ke-wei, GUI Xin-yang, CAI Xiao-shu, LIU Pei-jin. Research on the Influence of Spectral Response on Radiation Spectroscopy Thermometry[J]. Spectroscopy and Spectral Analysis, 2018,38(2): 638-642.
Doi:10.3964/j.issn.1000-0593(2018)02-0638-05
Permissions
YANG Bin, GUO Hao-ran, CHEN Xiao-long, PAN Ke-wei, GUI Xin-yang, CAI Xiao-shu, LIU Pei-jin. Research on the Influence of Spectral Response on Radiation Spectroscopy Thermometry[J]. Spectroscopy and Spectral Analysis, 2018,38(2): 638-642.
Doi:10.3964/j.issn.1000-0593(2018)02-0638-05
Copyright©2018, 《光谱学与光谱分析》期刊社
《光谱学与光谱分析》期刊社 所有
光谱响应对辐射光谱测温法的影响研究
摘要
针对光谱响应系数对辐射光谱测温法的影响问题, 利用200~1 100和900~1 700 nm两种波段光纤光谱仪测量了不同温度下黑体炉辐射光谱, 分析了不同波段高温黑体辐射光谱特征, 确定了不同波段光谱分析适宜采用的有效响应波段, 获得了不同温度下该波段光谱响应系数变化情况, 详细分析了温度对光谱响应系数的影响, 总结了辐射光谱法温度拟合时的波长范围以及响应系数选择原则, 并分析了波长范围以及响应系数选择对测温的影响, 这为提高辐射光谱测温法的测量精度具有重要价值。
关键词:
辐射光谱; 燃烧诊断; 温度测量; 影响因素; 光谱响应系数
中图分类号:O433.5+2
文献标志码:A
Research on the Influence of Spectral Response on Radiation Spectroscopy Thermometry
Abstract
In order to comprehend the influence of spectral response coefficients on radiation spectroscopy thermometry, the VIS (visible, 200~1 100 nm) and NIR (near-infrared, 900~1 700 nm) spectrometers were used to measure the blackbody radiation spectrums at different temperature. The spectral characteristics of high temperature blackbody radiation spectrums in different wavebands were analyzed. The appropriate response wavebands of different spectrometers were selected to measure temperature. The changes of spectral response coefficient with temperature in this optimized waveband were obtained. The influence of temperature on response coefficient was analyzed in detail. The wavelength range of temperature fitting of radiation spectroscopy and the selecting criterions of response coefficient were summarized. And the influence of selecting of wavelength and response coefficient on thermometry were analyzed. It provides the important references for improving on measurement accuracy of radiation spectroscopy thermometry.
Keyword:
Radiation Spectroscopy; Combustion diagnostics; Temperature measurement; Influence factors; Spectral response coefficient
Introduction
Flame, as a representation of combustion, has a great influence on revealing combustion mechanism. For a long time, the conventional methods, such as thermocouple, etc., have been widely applied to temperature measurements of flame. However, these conventional invasive methods have slow response, and the measurement results need careful correction, which can’ t meet the dynamic and real-time requirements of combustion research[1]. With the rapid development of optoelectronics and spectroscopy, some advanced laser and spectroscopy measurement techniques, such as Planar Laser Induced Fluorescence (PLIF), Coherent Anti-stokes Raman Spectroscopy (CARS), Tunable Diode Laser Absorption Spectroscopy (TDLAS), Radiation Spectroscopy, etc., are gradually applied to obtain parameters and structure of flame, which promote the further development of combustion research[2, 3, 4, 5, 6]. Among them, Radiation Spectroscopy is a convenient tool to measure temperature, with emissivity and specific component of flame due to high temperature and self-radiation[7, 8, 9]. Compared with colorimetric, monochromatic, dual-wavelength and multi-wavelength strategies, more abundant spectral information, such as intermediate products and metal atom, can be observed by radiation spectroscopy[10]. And more accurate thermometry can be realized based on fitting method of Planck’ s radiation law. In addition, the spatial reconstruction of parameters can also be realized with combing imaging method[11, 12]. Therefore, Radiation Spectroscopy is a very promising online flame measurement technology.
Unfortunately, because of different responses of photoelectric detecting element in the different wavelength of light radiation, the spectrometer should be calibrated by blackbody furnace to get the ratio of the theoretical blackbody radiation intensity to the measured intensity (spectral response coefficient kλ ) at the wavelength of λ and at a certain temperature[13]. In practice, the temperature and emissivity of flame are obtained by fitting of real radiation spectrums. The spectral response coefficients are used to convert the measured response to real radiation spectrums. Therefore, the choice of spectral range, the range of temperature measurement and the choice of response coefficient have a great influence on the results of temperature fitting. In this paper, the radiation spectrums of blackbody furnace at different temperatures were measured by two kinds of fiber spectrometers (VIS 200~1 100 nm and NIR 900~1 700 nm wavebands), and the influence of spectral response coefficient of spectrometer on radiation spectrum thermometry was analyzed in detail.
1 Principle of Radiation Spectroscopy
Considering flame as graybody, the relation between wavelength of flame radiation light (λ ) and radiation intensity (Eλ )[W· m-2] is described by Planck’ s law:
Where, ε is emissivity, which is the function of temperature; C1, C2 are the first and second radiation constant, and T[K] is the radiation temperature.
Due to different responses of photoelectric detecting element in different wavelength of light radiation, the spectral response coefficient is defined as the ratio of the measured response (Iλ ) to the real radiation intensity (Eλ )
As usual, the spectral response coefficients at different wavelength are calibrated by blackbody furnace. The real radiation intensity is calculated by equation (1).
Hence, the relation between wavelength and measured response is described as
Once the radiation spectrum is measured by spectrometer, the average temperature of field can be obtained by fitting of equation (3). Due to different spectral response coefficients of different wavelength radiation light, the spectral response coefficient has great influence on fitting result.
2 Experimental system of radiation calibration with high temperature blackbody furnace
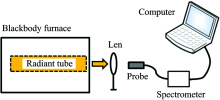
As shown in Figure 1, the experimental system consisted of the blackbody furnace (Fuyuan Photoelectric, HFY-203B), optical fiber spectrometer, lens, optical fiber probe, computer, etc. The diameter of high temperature blackbody radiation tube arranged in blackbody furnace is 40 mm, and its effective emissivity is 0.98~0.99. The spectrometers used in the experiment are 200~1 100 nm VIS spectrometer (Ocean Optics, HR4000, Toshiba TCD1304AP detector) and 900~1 700 nm NIR spectrometer (Isuzu Optics, NIRez, Sony ILX554B detector).
 | Fig.1 Experiment system of radiation calibration |
The blackbody furnace is set to the specified temperature. The radiation light of tube in the blackbody furnace is collected by the probe and transmitted to the optical fiber spectrometer. The measured spectrums are recorded and analyzed by the computer. In this paper the temperature range of blackbody furnace is set to 981~1 053 K. The radiation spectrums of blackbody at different temperatures in this range are alternately measured by NIR and VIS spectrometers. The integral time of VIS spectrometer is 200 ms, and the spectrum width of NIR spectrometer is 10.53 nm.
3 Results and discussions
Due to the spectral response coefficient associates with wavelength, temperature and other parameters, the spectral range selection has a great influence on the fitting results of temperature. In order to improve measurement accuracy, the Signal to Nosie Ratio (SNR) of measured spectrums and temperature stability of spectral response coefficient should be considered.
3.1 Radiation spectrums of blackbody furnace with different spectrometers
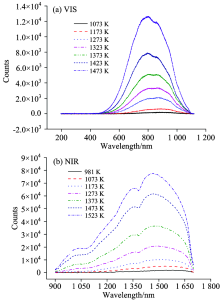
The radiation spectrums of blackbody furnace obtained by VIS and NIR spectrometers in the temperature range of 981~1 503 K are shown in Figure 2, in which (a) is the VIS spectrometer, and (b) is NIR spectrometer. Compared with the two wave-band spectrums, the SNR and lower limit of temperature detection response of NIR are better than VIS. There are obvious response in NIR above 1 073 K, but above 1 173 K in VIS.
 | Fig.2 Radiation spectrums of blackbody furnace using VIS and NIR spectrometers |
3.2 Spectral response coefficients at different temperatures
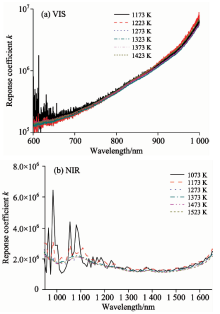
According to the VIS and NIR spectrums at different temperature obtained by experiment, the corresponding spectral response coefficients can be calculated by equation (2). Considering SNR of the VIS and NIR spectrums, 600~1 000 and 950~1 050 nm are selected for further analysis. The spectral response coefficients in these two wavebands are shown in Figure 3. Due to stronger radiation intensity at higher temperature, the curves of spectral response coefficients become more stable as temperature increases.
 | Fig.3 Response coefficient of VIS and NIR spectrometer for different temperature blackbody radiation |
For VIS waveband, the response coefficients vary greatly in different wavelength. Due to the small value in 600~700 nm, the temperature sensitivity of response coefficients is low, and there is great fluctuation at low temperature. Moreover, the spectral response coefficients is large in 900~1 000 nm. The spectral noise will be amplified by real radiation calculation.
For NIR waveband, the changing characteristics in different temperature ranges are different. The curves have large, fluctuations in 950~1 300 nm waveband below 1 273 K, but these fluctuations are disappeared above 1 273 K.
Considering stability and roughly equivalent value of response coefficients in the selected range, the spectral data in 700~900 nm (VIS) and 1 000~1 600(NIR) ranges are appropriate to determine temperature.
3.3 Temperature influence on spectral response coefficient
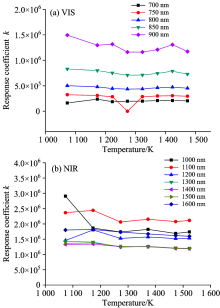
As mentioned above, the response coefficients change with the temperature. The iterative method is required to solve the optimized temperature in radiation spectroscopy. As the target temperature is unknown, even far exceeding calibrated temperature range, this iterative method is low-efficient. However, as shown in Fig.4, the response coefficients of the specific wavelength at different temperature are approximately constant in the range of 700~900 and 1 000~1 600 nm which are also shown in Fig.3. Thus, the response coefficients at any temperature can be effectively acted as calibration coefficients in radiation spectroscopy.
3.4 Spectral range selection influence on Radiation Spectroscopy thermometry
Based on the above analysis, the selecting criterions of response coefficient can be summarized as follows:
(1) For VIS waveband, due to the SNR of the radiation spectrums at different temperature, VIS Radiation Spectroscopy is only suitable for thermometry above 1 173 K. And the recommended fitting range of spectral data is 700~900 nm.
(2) For NIR waveband, the lower limit of temperature measurement can be reach 1 073 K, and 1 000~1 600 nm fitting range is recommended.
 | Fig.4 Response coefficient of VIS and NIR spectrometer for different wavelength blackbody radiation |
These criterions are verified by the same experiment system, but at different temperature form calibration. The comparison results are shown in Table 1. Temperature fitting in the optimized selected range can reduce the relative deviation of measurement and improve the accuracy of measurement. Moreover, for high-temperature measurement, the selection of spectral response coefficients at specific temperature has less influence on measurement results.
| Table 1 Comparison of relative deviation of results based on full range and optimized selected range |
Furthermore, it is worth pointing out that the spectral response coefficients depend on detector material of different waveband. Therefore, the results have applicability for the spectrometers with the same detector material.
4 Conclusion
(1) The spectral response coefficients vary with temperatures in different wavelengths. For the visible band, the spectral response coefficients tend to be stable in the range of 700~850 nm which is the suitable spectral range for the temperature fitting. While the near-infrared spectral range selection depends on temperature range. For the temperature below 1 273 K, 1 300~1 600 nm spectral range is more appropriate. But for the temperature above 1 273 K, 1 000~1 600 nm spectral range is better. Compared to the full band spectral data, the accuracy of these measurements can be improved by fitting the spectrums in these selected wavelength ranges.
(2) With temperature rising, visible and near-infrared spectral response coefficients are both stable. For high-temperature measurement, the selection of spectral response coefficients at specific temperature has less influence on measurement results.
The authors have declared that no competing interests exist.
参考文献
| [1] |
|
| [2] |
|
| [3] |
|
| [4] |
|
| [5] |
|
| [6] |
|
| [7] |
|
| [8] |
|
| [9] |
|
| [10] |
|
| [11] |
|
| [12] |
|
| [13] |
|