


基于高光谱的颜色辨别方法研究
[叶琦1, 2  , 王跃明
, 王跃明1, * , 周世尧1, 2 , 程晓钰1, 2 , 贾建鑫1, 2 ]
, 王跃明, 周世尧|
|


在颜色测量领域区分相似颜色的样品是非常困难的。 测量颜色的准确性和高效性对于工业上的应用非常重要。 提出了一种基于超光谱成像技术的色彩测量的方法, 并设计制成原理样机系统。 该系统能够快速准确的测量彩色样品的光谱, 并在分析后可得丰富的颜色数据与颜色坐标。 该方法克服了传统测色方法“测谱不成像, 成像不测谱”的局限性。 为了评估系统的性能, 进行分析和实验: 比较细分的每个波段的信噪比, 并使用光谱匹配技术来比较彩色照相机和所设计的系统在颜色测量方面的优缺点。 结果表明, 本系统提供了一种更精确的颜色测量方法, 可以有效地测试产品颜色的质量。
Biography: YE Qi, (1993—), female, postgraduate, University of Chinese Academy of Sciences,e-mail: orange_ye@foxmail.com
It is very difficult to distinguish samples with similar colors in color measurement. Accuracy and efficiency are very important for industries’ application. A method for color measurement based on hyper- spectral imaging technology was proposed, and a prototype was integrated in this paper. The system is able to measure the spectrum of the colorful samples rapidly. The color analysis or color coordinates were calculated after measurement. This method provided the image and spectrum at the same time. To evaluate the performance of the system, analysis and experiment were also performed. We compared the signal-to-noise ratio of each bands that are subdivided, and used the spectral mapping technique to compare the advantages and disadvantages of the color cameras and the proposed system. The results show that we proposed a more accurate method for color measurement and it can test the quality of products efficiently.
Color means a lot when identifying an object, and it is an important basis to determine the product quality and identify the type of objects[1]. There are a lot of methods for surface color measurement and characterization, such as color card (compared by human eyes), color camera and spectrophotometer, etc[2, 3]. Color card comparison method has not good consistency, heavy labor intensity for operating workers and limited precision when compared color artificially. Bases on the RGB principle, color camera has high resolution efficiency but color camera cannot discriminate tiny color difference of objects due to coarse spectral resolution. Spectrophotometer has a better precision but can only measure one point at the same time, which made the method inefficient[4, 5]. Hyperspectral imaging technology is of high spectral resolution, and high sensitivity. The data of the hyperspectral consist of the image and spectrum, so it is an efficient way in industrial color measurement[6].
The traditional color measurement and presentation systems, such as color cameras, are based on three filter sensory systems corresponding to three dimensional coordinate representation[7, 8]. This is mainly due to the knowledge about human color vision. These systems consist of filter wheel colorimeter, in which a sensor is used and the color is measured as intensity components through different filter. The fixed filter ideas are also used in the color cameras, where R-, G- and B-component have their own CCD-pixels[9]. Nowadays we use a system like the spectrophotometer to measure the tri-stimulus value of the color, the color tri-stimulus values of any light spectrum are determined by integrating the products between the spectrum and the CIE color matching functions in the visible spectral range[10].
For representing color, several color coordinate systems have been standardized. Most of the color coordinate systems are three dimensional and basically transformations of the XYZ-tri-stimulus values, which are based on the psychophysical experiments of the human color vision[11]. In the field of computer vision, paper industry and many other applications, the xyY, CIELAB, CIELUV and RGB are common coordinate systems[12, 13]. There are disadvantages, however, in these systems: the representation is systematically dependent, e.g. the values are defined for a certain illuminant. Due to this, the color is not uniquely defined[14]. Furthermore, the accuracy is not high enough for many applications. To partly avoid these problems, the approach based on the wavelength spectrum is used in the paper[15].
In this letter, we proposed a new approach for measuring the color by the hyperspectral imaging technology. The difference between the hyperspectral color measurement method and the traditional three-color color expression method will be analyzed in detail, and the results of experiment showed the better performance of hyperspectral color measurement.
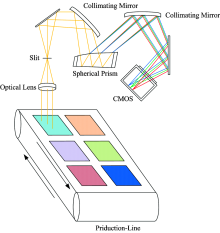
We conducted an experiment that used a Visible and Near InfraRed (VNIR) hyperspectral imager, which operated from 400 to 800 nm. F number of the system is 5. It is a prismatic hyperspectral system with low stray light. The array size of focal plane array is 2 560× 512 and the spectral band is divided into 512 dimension. Pixel binning were performed to get 10 nm spectral sampling interval. The color patches were imaged under the natural light. The layout of hyperspectral imaging experiment system was shown in Fig.1.
 | Fig.1 The hyperspectral imaging optical system for color measurement used in industrial production |
We used the Nikon D3200 color camera as a contrast F number of this color camera was set to 5. The exposure time is 10ms and we imaged the object under the natural light. All these conditions were the same as the hyperspectral imaging system. We choose Pantone standard color card to experiment, and Fig.2 showed 18 pairs of similar color patches imaged by color camera and hyperspectral imaging system, respectively.
 | Fig.2 The contrast between the image of the color camera (a) and the image of the hyperspectral imaging system (b) |
The signal-noise ratios (SNR) are both between 150 and 200. It is obvious that the SNR conditions of two set of images are the same approximately. For the color patches marked ① to ⑥, after standard whiteboard calibration, the spectral reflectance curves for all their different bands are shown in Fig.3. It is not difficult to find out that there are some obvious differences between the curves of each pair of similar color patches.
 | Fig.3 Reflectance of three pairs of similar color patches marked ① to ⑥ measured by the hyperspectral imaging system in visible light waveband |
We still use that three pairs of similar color patches ① to ⑥ to compare the reflectance of the color imaged by the color camera, after standard whiteboard calibration, the curves are shown in Fig.4. It can be seen that the color camera cannot effectively distinguish the difference of the three pairs of similar color patches, and the reproducibility of this experiment is poor.
 | Fig.4 Reflectance of three pairs of color patches marked ① to ⑥ measured by the color camera in RGB three bands |
Using the hyperspectral image shown in Fig.2, for each pairs of similar color patches we do the average processing after removing the system noise, and get the Ri and Ti. Then we use the equation (1) to characterize the degree of discrimination of each pair of similar color patches, which is defined as
By using the equations below
We could get the average values of each row of pixels imaged by our hyperspectral imaging system and the color camera. Where i represents the row number and j represents the column number of each pair of similar color patches, and
The bigger the Ui is, the higher the degree of discrimination is for that pair of similar color patches.
The image obtained by the color camera is also subjected to the processing by the formulas above. It is defined as Vi. The mean values of Ui and Vi for each pair of similar color patches were compared. Maximum value of Ui, Vi and the ratio of them were shown the in Table 1.
| Table 1 Compare the accuracy of the color measurement of the hyperspectral imager and the color camera |
Furthermore we combined the spectral data obtained from the hyperspectral imager into three bands according to the indexes of blue (450~515 nm), green (525~605 nm) and red (630~690 nm), then made a contrast to the RGB values Ui(R), Ui(G), and Ui(B), and used color patches ① to ⑥ as an example to compare with the color camera’ s RGB values Vi(R), Vi(G), and Vi(B). The Ui and Vi and the ratio of them are shown in Table 2.
| Table 2 Compare the accuracy of the color measurement in the RGB bands of the hyperspectral imager and the color camera |
It can be seen in Table 2 that under the same band conditions, the hyperspectral imager of the color measurement accuracy is much higher than that of the color camera which increased more than 5 times, also we can conclude from Table 1 that in some particular bands, the measurement accuracy can be improved several times.
To demonstrate the efficiency of hyperspectral imaging meuhod we proposed further points, we used the spectral mapping technique to compare the measurement accuracy between the hyperspectral imager and the color camera. It defined the Eulerian angle of two vectors as a similarity function. The spectral response of the N bands of the pixel for the color patches is taken as the vector of the N-dimensional space, and the degree of matching can be characterized by calculating the Eulerian angle and the spectrum of the similar color patches to compare the difference. Two vector generalized angle cosine is defined by
we can get the angle of two wector
We calculated the general angle of two vectors in each pair of the similar colors. The angle images are shown in Fig.5.
By measuring the angles between each pairs of the similar colors, we can find that the hyperspectral imager can clearly see the difference between two similar colors and the color camera cannot recognize the difference. It is even hard to calculate the spectral angles of most pixels.
 | Fig.5 The picture on the left is the angle image imaged by the color camera and the picture on the right is imaged by our hyperspectral imaging system |
We compared the spectral angles between the similar color patches. Average of Eulerian angles, the noise, the Eulerian angles between the average angles and the angles of pixels in similar colors were calculated. The results are shown in Table 3.
| Table 3 Compare the angle of two vectors both in the same color patches and in the similar color patches imaged by the hyperspectral imager |
We may select an appropriate threshold from which we could easily distinguish the different color imaged by the hyperspectral imaging system by the spectral mapping technique. From the Table 3, the average values of spectral angle between different pixels in the same color patches are all under 0.01 rad, and the average values of spectral angle between different pixels in the similar color patches are all more than 0.02 rad, which means the maximum values of the spectral angle between the different pixels in the same color patches is smaller than the minimum values of the spectral angle between the different pixels in the similar different color patches.
In conclusion, this hyperspectral imager system can be good at color imaging, recognition and measurement. The system combined the image and spectrum, could distinguish the color that color cameras cannot distinguish, and the effect is very significant. The method is based on spectral reflectance, so it is a more accurate method for color measurement. The method may be used in industries to improve the accuracy of color indicators then better the product quality.
The authors have declared that no competing interests exist.
| [1] |
|
| [2] |
|
| [3] |
|
| [4] |
|
| [5] |
|
| [6] |
|
| [7] |
|
| [8] |
|
| [9] |
|
| [10] |
|
| [11] |
|
| [12] |
|
| [13] |
|
| [14] |
|
| [15] |
|