


电感耦合等离子体原子发射光谱法测定铝合金中微量碲
[刘攀1, 2, 3 , 杜米芳1, *  , 李斌
, 李斌1 , 李景滨1 , 曾磊1 , 刘国元1 , 张欣耀1, 4 , 查小琴1, 4 ]
, 李斌|
|


作者简介: 刘攀, 1989年生, 洛阳船舶材料研究所(中国船舶集团有限公司第七二五研究所)高级工程师 e-mail: LIUPAN_LP@163.com
碲是新型先进铝合金的微合金化元素, 可提高合金强度、 塑性、 耐热性和耐蚀性。 针对先进铝合金研发、 生产和应用过程提出的微量碲的准确、 快速检验需求与国内外检测标准缺乏铝合金中碲元素分析方法的现状, 基于电感耦合等离子体原子发射光谱法开展了铝合金中碲的分析方法研究。 研究确定了样品消解方法, 考察优化了分析谱线、 观测方式、 射频功率与雾化气、 等离子体气和辅助气流量等光谱仪的工作参数。 确定的条件参数如下, 射频功率: 1.20 kW, 雾化气流量: 0.75 L·min-1, 等离子体气流量: 12.5 L·min-1, 辅助气流量: 1.0 L·min-1, 轴向观测方式, 选择214.282 nm作碲的分析谱线。 准确称取0.10 g铝合金试样, 加入5.0 mL高纯水、 5.0 mL盐酸和1.5 mL硝酸加热溶解后定容至100.00 mL。 以0.100 g高纯铝为基体, 采用基体匹配法建立铝合金中碲校准曲线溶液, 校准曲线线性相关系数达0.999。 方法的检出限为0.002%, 定量限为0.005%, 测定结果的相对标准偏差(RSD)不大于5%, 方法加标回收率为96%~109%, 合成样品的测定结果与理论值相符, 偏倚小于GB/T 20975.25—2020规定的再现性限。 该方法具有灵敏、 准确、 快速、 绿色等优点, 可用于铝合金中微量碲的分析, 填补了国内外铝合金中碲元素分析的方法空白, 为含碲新型先进铝合金的研发与应用过程的质量控制提供了技术支撑。
, LI BinTellurium was a trace microalloying element of new advanced aluminum alloy, which could improve the strength, plasticity, heat resistance and corrosion resistance. The research, development, production and application of aluminum alloys put forward the demand for accurate and rapid determination of trace tellurium. However, there was still a lack of analysis standards and methods for tellurium in aluminum alloys at home and abroad. In order to solve the above problems, an analytical method for tellurium in aluminum alloy has been studied and established based on inductively coupled plasma atomic emission spectrometry to solve the above problems. The digestion method of aluminum alloy sample and the working conditions of the spectrometer were studied and optimized, such as analysis of spectral line, observation mode, radio frequency power, atomization gas flows, plasma gas flow and auxiliary gas flow. The optimized condition parameters were as below: radio frequency power of 1.20 kW; atomized gas flow of 0.75 L·min-1, plasma gas flow of 12.5 L·min-1 and auxiliary gas flow of 1.0 L·min-1. The observation mode was set to axial direction, and Te 214.282 nm was selected as the analysis line. 0.10 g of aluminum alloy sample was accurately weighed into the conical flask. Moreover, 5.0 mL of high-purity water, 5.0 mL of hydrochloric acid and 1.5 mL of nitric acid were added. Then heat until completely dissolved. After cooling, the test solution was diluted to 100.00 mL. The calibration curve solution of tellurium in aluminum alloy was established by the matrix matching method with 0.100 g of high-purity aluminum as the matrix. The calibration curve was a linear equation with a correlation coefficient of 0.999. The detection limit was 0.002%, and the limit of quantification was 0.005%. The optimized method was applied to the analysis of actual samples. The relative standard deviation of the determination result was no more than 5%, and the recovery rate of tellurium was 96%~109%. The determination results of the simulated sample were consistent with the theoretical value, and the bias was better than the reproducibility limit specified in GB/T 20975.25—2020. The proposed method has the advantages of sensitivity, accuracy, speed and greenness and can be used for the analysis of trace tellurium in aluminum alloys, filling the blank of the method for the analysis of tellurium in aluminum alloys at home and abroad, and providing technical support for the quality control of the development and application process of aluminum alloys containing tellurium.
铝合金是重要的轻量化金属材料, 具有比强度高、 塑性加工性能好等优点, 被广泛应用于航天、 航空、 交通、 船舶、 建筑等领域[1, 2]。 微量碲元素可显著改善铝合金的性能, 提高其强度、 塑性、 耐热性, 降低腐蚀敏感性。 鉴于含碲铝合金新型先进材料尚处产品研发和应用推广阶段[3, 4], GB/T 20975.25—2020[5]、 ASTM E3061—17[6]、 EN 14242—2023[7]、 JIS H 1307—1993[8]、 KS D 1678—2012[9]等国内外铝及铝合金化学分析方法标准体系尚未能包括碲元素[10], 亦罕见铝合金中碲含量的分析方法研究及应用报道。 上述检测标准及方法的缺失严重制约了含碲铝合金的研制与工艺和应用研究。
目前, 电感耦合等离子体原子发射光谱法已在铝合金中合金元素和金属合金中微量砷、 锡、 锑等过渡性半金属元素的分析中得到了成熟应用, 并推广应用于纯银和纯铜等金属合金中碲含量的测定[11, 12, 13, 14, 15, 16, 17, 18]。 本文讨论了样品消解体系和分析谱线, 考察了观测方式、 射频功率与雾化气、 等离子体气和辅助气流量等分析条件的影响, 并从空白试验、 精密度试验、 加标回收率试验及合成样品模拟测试等角度开展了方法学评价, 开发建立了电感耦合等离子体原子发射光谱法快速测定铝合金中微量碲的方法, 填补了铝合金中碲元素分析的方法空白, 从检验检测角度为含碲铝合金的研发与应用奠定了质量控制基础。
5110SVDV电感耦合等离子体原子发射光谱仪(美国Agilent公司), 工作参数如下: 观测方式: 轴向, 射频功率: 1.20 kW, 雾化气流量: 0.75 L· min-1, 等离子体气流量: 12.5 L· min-1, 辅助气流量: 1.0 L· min-1, 泵速: 12 r· min-1, 稳定延迟时间: 15 s, 样品提升时间: 12 s, 读取时间: 6 s, 重复测量次数: 2次, 校正方式: 拟合。 电子分析天平(d=0.01 mg)。 Ariu
高纯铝(w(Al)≥ 99.999%); 盐酸(ρ 1.18 g· mL-1)、 硝酸(ρ 1.42 g· mL-1)均为优级纯; 实验用水为高纯水(电阻率≥ 18 MΩ · cm)。 碲标准溶液(1 000 μ g· mL-1), 采用15%盐酸逐级稀释至100和10 μ g· mL-1。
校准曲线溶液: 准确称取6份0.100 g高纯铝于锥形瓶中, 加入5.0 mL高纯水、 5.0 mL盐酸和1.5 mL硝酸, 加热溶解完全, 冷却后分别定量加入0、 10、 50、 100、 500、 1 000 μ g碲标准溶液, 用高纯水定容至100.00 mL, 制备成碲质量浓度分别为0、 0.1、 0.5、 1.0、 5.0和10.0 μ g· mL-1的系列校准曲线溶液, 记作Std 0#—5#。 样品质量按100.00 mg计, 碲的质量分数分别为0、 0.01%、 0.05%、 0.10%、 0.50%、 1.00%。
称取0.10 g试样(精确至0.1 mg), 加入5.0 mL高纯水、 5.0 mL盐酸和1.5 mL硝酸, 加热至溶解完全, 冷却后用高纯水定容至100.00 mL。 按1.1设定仪器工作参数, 选择214.282 nm作碲的分析谱线, 依次将空白溶液、 系列校准曲线溶液和待测试液导入光谱仪测定其光谱强度, 根据碲的光谱强度与质量浓度或质量分数的拟合曲线, 得出待测试样的碲含量。
铝和碲均属于两性准金属, 其中金属铝易溶解于稀硫酸、 硝酸、 盐酸、 王水和苛性碱溶液, 碲易溶解于硫酸、 硝酸、 王水和苛性碱溶液, 但不溶于盐酸。 GB/T 20975.25—2020[5]推荐铝及铝合金的消解体系有: (1)盐酸和过氧化氢; (2)盐酸和硝酸混合酸(王水); (3)氢氧化钠溶液和过氧化氢; (4)盐酸和硝酸混合酸、 氢氟酸。 其中, 苛性碱介质将引入较高的背景基体干扰并易带来盐分沉积, 降低方法检出能力, 含氢氟酸溶液需要专用进样和雾化系统, 过氧化氢存在将碲氧化为毒性增强的碲酸根离子的风险。 综上信息, 依据铝、 碲的溶解性及化学性质, 推荐消解体系为盐酸和硝酸混合酸(王水)。 试验表明, 5.0 mL盐酸和1.5 mL硝酸可完全消解0.10 g待测试料, 试液澄清透明。
电感耦合等离子体原子发射光谱法的干扰效应主要包括光谱干扰及物理干扰, 选用合适的分析谱线是降低光谱重叠干扰的重要方式。 碲的分析谱线主要有214.282、 182.153、 238.578和226.555 nm, 其中182.153 nm强度低, 且在紫外区, 需用载气高速吹扫以避免空气成分及水分子干扰。 上述谱线的离子状态、 背景等效浓度(BEC)、 径向检出限(RDL)、 相对灵敏度、 光谱强度与干扰元素及谱线等信息列于表1。 铝合金包括1× × × —9× × × 等9个系列, 其合金元素主要有硅、 铜、 锰、 镁、 锌, 其他元素主要作杂质或微合金化元素进行控制。 其中钒元素一般控制在0.05%以内, 2219、 2519、 2B16和2A20等个别牌号可引入钒进行微合金化, 其质量分数可达0.05%~0.15%[19]。
| 表1 碲的分析谱线 Table 1 Analytical lines of tellurium |
根据上述信息, 遵循无共存成分光谱干扰、 背景等效浓度和检出限低、 相对灵敏度和信噪比高的原则选择214.282 nm为碲的分析谱线。 同时采用基体匹配法和背景拟合校正方式消除铝基体和介质的基体背景干扰和物理干扰, 图1给出了铝合金中碲标准溶液和实际样品试液的典型谱图, 可见214.282 nm左右无干扰杂峰, 背景平直, 峰体形态平滑、 对称。
 | 图1 碲214.282 nm波长的典型谱图Fig.1 Typical analytical spectrum of Te 214.282 nm wavelength |
观测方式直接影响光谱信号的采集强度。 以标准溶液Std 4#为例, 其轴向观测的光谱强度为6 250 c· s-1; 设定其径向观测高度分别为5、 6、 7、 8、 9、 10 mm, 对应的光谱强度分别为1 347、 1 270、 1 189、 1 134、 1 023和954 c· s-1。 可见, 轴向观测方式具有更高的光谱强度。 结合图1, 在待测含量范围内, 碲的光谱强度远未达到饱和溢出的临界点, 故确定观测方式为轴向。
射频功率与雾化气、 等离子体气及辅助气流量直接影响等离子体的温度分布并决定元素激发和电离效率及光谱发射强度。 设定轴向观测方式, 以标准溶液Std 3#和4#为例, 采用四因素、 五水平正交试验[20, 21]研究上述参数对铝合金中碲元素光谱强度及信噪比的影响, 结果见表2, 并进一步计算特定因素不同水平下各试验平均值, 结果见图2。 由图2发现: 射频功率和雾化气流量对光谱强度和信噪比有显著影响, 等离子体气和辅助气流量对光谱强度及信噪比的影响较弱; 随着射频功率的增加, 光谱强度近似线性增加, 但信噪比主要呈线性降低趋势; 随着雾化气流量的增强, 光谱强度近似线性下降, 但信噪比呈线性增加趋势。 采用表2数据进一步拟合光谱强度和信噪比量值关系, 结果见图3。 其中, 图3(a)剔除了离群坐标点(994 c· s-1, 0.8)。 由图3, 正交试验条件下, 标准溶液Std 3#和Std 4#的光谱强度和信噪比均各自呈现出强负相关性, 相关系数均在0.8以上。 根据正交试验结果及光谱强度和信噪比的变化关系, 推断射频功率与雾化气、 等离子体气和辅助气流量宜取中间值, 分别为1.20 kW与0.75、 12.5和1.0 L· min-1。
 | 图2 仪器参数对光谱强度和信噪比(S/N)的影响 (a): 射频功率; (b): 雾化气流量; (c): 等离子体气流量; (d): 辅助气流量Fig.2 Effect of spectrometer parameters on spectral intensity and signal-to-noise ratio (a): Radio frequency power; (b): Atomizing gas flow; (c): Plasma gas flow; (d): Auxiliary gas flow |
 | 图3 光谱强度和信噪比相关性 (a): Std 3#溶液; (b): Std 4#溶液Fig.3 Correlation between spectral intensity and signal-to-noise ratio (a): Std 3# solution; (b): Std 4# solution |
| 表2 仪器参数优化正交试验结果 Table 2 Orthogonal test results for spectrometer parameters optimization |
以标准溶液Std 4#为例, 设定上述推荐值, 采用控制变量法进一步研究和验证射频功率、 雾化气流量及等离子体流量对光谱强度或信噪比的影响, 详见图4—图6。 试验结果佐证了上文结论, 即射频功率和雾化气流量对光谱强度和信噪比有显著影响, 等离子体气流量对光谱强度影响较弱。 射频功率的增加带来激发能量的增加, 促进待测试液的离子化, 但亦提高背景干扰, 易造成信噪比下降; 雾化气流量的降低将增大待测试液的雾滴粒径, 增加可被有效激发的原子浓度, 利于提高光谱强度, 但会提高背景噪声, 导致信噪比呈下降趋势。
 | 图4 射频功率和雾化气流量对光谱强度的影响Fig.4 Effect of radio frequency power and atomization gas flow on spectral intensity |
 | 图5 射频功率和雾化气流量对光谱信噪比的影响Fig.5 Effect of radio frequency power and atomization gas flow on signal-to-noise ratio |
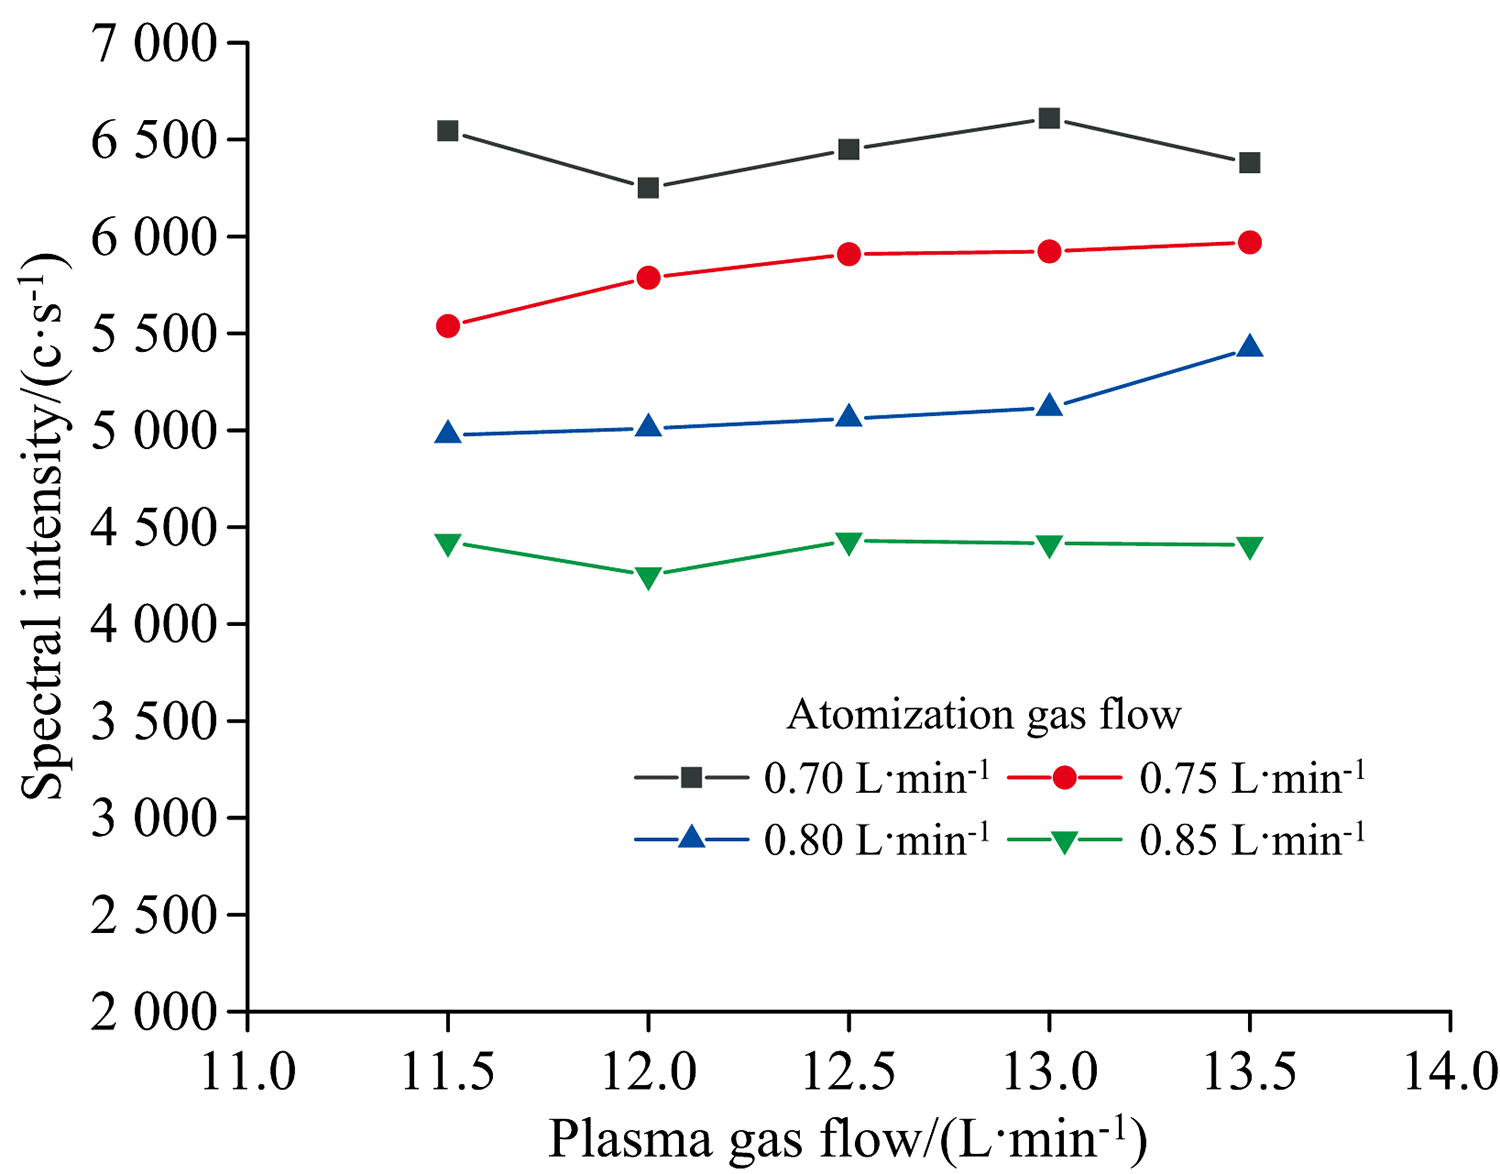 | 图6 等离子体气流量和雾化气流量对光谱强度的影响Fig.6 Effect of plasma gas flow and atomization gas flow on spectral intensity |
按实验方法测定系列校准曲线溶液, 以光谱强度[I/(c· s-1)]为纵坐标, 质量浓度[c/(μ g· mL-1)]或质量分数(w/%)为横坐标, 拟合校准曲线, 拟合方程为I=1 120c+54, I=11 200w+54, 相关系数r=0.999 3。 独立平行测定13次高纯铝空白溶液, 计算空白值的标准差, 取其3倍和10倍计算方法检出限和定量限, 按质量浓度计, 分别为0.02和0.05 μ g· mL-1; 按质量分数计, 分别为0.002%和0.005%。
按实验方法测定铝合金实际样品Spl 1#—4#, 结果见表3。 根据GB/T 20975.25—2020[5]规定的重复性限r和GB/T 6379.6—2009《测量方法与结果的准确度(正确度与精密度) 第6部分: 准确度值的实际应用》[22]规定的临界极差系数f(2)=2.8、 f(6)=4.0, 计算各测定值对应的临界极差CD=f(6)× r/f(2), 结果列于表3。 由表3可知, 测定结果的极差均低于临界极差, 标准偏差不大于0.005%, 相对标准偏差(RSD)不大于5%, 表明方法具有较好的精密度。
| 表3 实际样品的测定结果 Table 3 Determination results of actual samples |
准确称取3#和4#铝合金实际样品于锥形瓶中, 加入一定量的碲标准溶液, 按实验方法进行样品消解和光谱分析, 进行加标回收试验, 结果见表4, 回收率为96%~109%。
| 表4 回收率试验结果 Table 4 Recovery rate test results |
碲是新型先进铝合金的微合金化元素。 针对GB/T 20975.25—2020等国内外标准缺乏铝合金中碲元素检测方法的现状, 研究建立了电感耦合等离子体原子发射光谱法测定铝合金中碲的分析方法, 并优化确定了观测方式、 射频功率、 等离子体气和雾化气流量、 分析谱线等光谱仪的工作参数与样品消解方法。 方法定量限为0.005%, 测定结果的相对标准偏差(RSD)不大于5%, 方法加标回收率为96%~109%, 合成样品测定结果与理论值相符。 该方法具有灵敏、 准确、 快速、 绿色等优点, 填补了国内外铝合金中碲元素分析的方法空白, 为含碲铝合金的研发与应用过程的质量控制提供了技术支撑。
| [1] |
|
| [2] |
|
| [3] |
|
| [4] |
|
| [5] |
|
| [6] |
|
| [7] |
|
| [8] |
|
| [9] |
|
| [10] |
|
| [11] |
|
| [12] |
|
| [13] |
|
| [14] |
|
| [15] |
|
| [16] |
|
| [17] |
|
| [18] |
|
| [19] |
|
| [20] |
|
| [21] |
|
| [22] |
|