丁香精油抗LDL糖基化活性及其主要成分—丁香酚与牛血清白蛋白的相互作用
[李金芝1  , 刘常金
, 刘常金1, 4, * , 佘智煜2 , 周飚2 , 谢志勇2 , 张军兵3 , 江慎华2, 4, * ]
, 刘常金, 佘智煜]
|
|


实验室前期研究结果表明, 在国家规定的药食两用物品名单中, 丁香抗氧化活性最强。 前人发现天然产物的抗氧化功能与抗糖基化活性息息相关。 因此, 目的是在此基础上进一步对丁香精油(clove essential oil, CEO)的抗糖基化活性及其中含量最高的组分—丁香酚(Eugenol)与牛血清白蛋白(bovine serum albumin, BSA)的相互作用进行研究。 在低密度脂蛋白(low density lipoprotein, LDL)的非酶糖基化孵育体系中, 光谱测定结果表明CEO对LDL糖基化早期、 中期和末期产物的生成均具有显著的抑制效果, 且对末期产物的抑制作用最强。 采用气相色谱-质谱联用技术(gas chromatography mass spectrometry, GC-MS)对CEO分析发现, CEO中含量最多的组分是丁香酚。 通过多光谱和分子对接对丁香酚与BSA的相互作用研究发现, 紫外-可见(ultraviolet-visible, UV-Vis)光谱表明丁香酚与BSA之间存在相互作用; 在荧光发射光谱中, 随着丁香酚浓度增加, BSA的荧光强度逐渐增强且发生蓝移, 进一步证明了二者之间存在相互作用。 通过计算不同温度下的结合常数发现, 丁香酚与BSA产生相互作用过程中有热力学过程参与, 热力学参数和位点标记竞争试验表明丁香酚通过氢键和范德华力与BSA在位点Ⅰ结合。 随着丁香酚浓度增加, 丁香酚与BSA混合体系的同步荧光(synchronous fluorescence, SF)、 三维荧光(three-dimensional, 3D)和傅里叶变换红外(Fourier transform infrared, FTIR)光谱的信号强度在发生变化的同时也发生了位移, 表明丁香酚的添加使BSA构象发生了改变。 通过分子对接技术进一步验证了丁香酚与BSA间相互作用的试验结果。 该研究为丁香进一步开发应用提供理论支持。
, LIU Chang-jin, SHE Zhi-yu
Biography: LI Jin-zhi, female, (1997—), a Graduate Student of the College of Food Science and Engineering of Tianjin University of Science and Technology e-mail: 1579659774@qq.com
The previous research results of our laboratory showed that clove had the strongest antioxidant activity in the state’s list of food-medicine herbs promulgated. It has been found that the antioxidant activity of natural products is closely related to antiglycation activity. Therefore, this study aimed to investigate further the antiglycation activity of clove essential oil (CEO) and the interaction between eugenol the component with the highest content in CEO and bovine serum albumin (BSA). The spectral results showed that in the non-enzymatic glycation incubation system of low-density lipoprotein (LDL), CEO had significant inhibition effects on forming the early, intermediate and late products of LDL glycation and had the strongest inhibition effect on the late product. The composition analysis of CEO by gas chromatography-mass spectrometry (GC-MS) indicated that eugenol was the most abundant component in CEO. Multispectral and molecular docking were applied to investigate the interaction between eugenol and BSA. The result of ultraviolet-visible (UV-Vis) absorption spectroscopy indicated an interaction between eugenol and BSA. In fluorescence emission spectroscopy, with the increase of eugenol concentration, the fluorescence intensity of BSA gradually increased with the blue shift, which further proved the interaction between them. The calculated results of binding parameters at different temperatures confirmed that the thermodynamic processes were involved in the interaction between eugenol and BSA. Thermodynamic parameters and the site marker competitive experiments showed that eugenol particularly bonds to BSA at the site Ⅰ through hydrogen bond and vander Waals force. In synchronous fluorescence (SF), three-dimensional (3D) fluorescence, and Fourier transform infrared (FTIR) spectroscopy, the signal strengths changed with the increase of eugenol concentration, and the shifts also occurred, which indicated that the conformation of BSA changed with the addition of eugenol. The results of the interaction between eugenol and BSA were further verified by molecular docking technology. The findings can provide theoretical support for the further development of clove.
Clove (Syzygium aromaticum) belongs to the Syzygiumgaertn genus plant of the Myrtaceae family. It has wide usages in medical and food preservatives[1]. There are many effective components inclove, and CEO occupies approximately 15%~20% among these components. CEO has attracted extensive attention due to its anti-fungal and antioxidant activities. Eugenol, the most abundant component in clove, has anti-oxidative, anti-fungal properties. And it also has wide usages in medical and food[1].
Diabetes is a major challenge to global public health in the 21st Century. It is estimated that global diabetic patients will reach 700 million by 2045[2]. LDL is the main blood carrier of cholesterol for transport to all tissues. In the hyperglycemic environment of diabetes, carbonyl groups in reducing sugars react with the amino groups in LDL, resulting in LDL glycation. LDL glycation has been regarded as one important factor contributing to the development of atherosclerosis[3]. In previous studies, several natural LDL glycation inhibitors have been reported[4]. Our previous studies also demonstrated that clove oil significantly inhibits LDL glycation[5]. The compositions of clove oil and CEO were different because the extraction principles were different[1]. To the best of our knowledge, there were few reports about the inhibitory effect of CEO on LDL glycation. Therefore, the inhibition activity of CEO on LDL glycation was firstly studied in this paper.
The main physiological property of humanserum albumin is that it acts as a transport protein for many drugs or nutrients in the body. The interactions between these small molecules with serum albumin may alter the protein conformation[6]. The interaction between sitagliptin or alpha arbutinand serum albumin was studied through UV-Vis, fluorescence, FTIR and other methods by Shaghaghi et al[7] and Xiong et al[8]. Up to now, the interaction between serum albumin and eugenol is not clear. The structure and chemical composition of BSA share a 76% identical sequence with human serum albumin. BSA is a model protein for studying the interaction between small molecules and biomacromolecules. Meanwhile, BSA is a non-expensive and easy availability protein[6].
This study aimed to investigate the activity of the CEO and the interaction of BSA with eugenol. Firstly, CEO was extracted by steam distillation method and the inhibition effect on LDL glycation was studied. After that, the GC-MS method was used to analyze the components of the CEO. Furthermore, UV-Vis spectroscopy, fluorescence spectroscopy, FTIR spectroscopy and molecular docking were applied to investigate the interaction of BSA with eugenol. This research can provide a helpful understanding of the inhibitory activities of CEO on LDL glycation and the interaction between eugenol and transport proteins.
Clove was purchased from Hebei Chufeng traditional Chinese medicine decoction pieces Co., Ltd (China). Other reagents, such as, BSA (> 96.0%) and eugenol (> 99.5%), were purchased from Shanghai Aladdin Biochemical Technology Co., Ltd. (China).
All UV-Vis absorption spectra were measured on the TU-1901 spectrophotometer (Beijing Purkinje General Instruments Co., Ltd., China). All fluorescence spectra were recorded on the F-7000 spectrofluorometer (Hitachi, Japan). The composition of the CEO was analyzed using the Thermo Trace 1310 GC (Thermo Scientific, MA, USA).The FTIR spectra were recorded using the Vertex 70 FTIR spectrometer (BRUKER, Germany) with KBr pellets.
1.2.1 The inhibition effect of CEO on the products of three stages of LDL glycation
The CEO was extracted by the steam distillation method[1]. LDL isolation was carried out following Rozo et al[3]. LDL glycation experiments were performed as previously described[5]. CEO (0.2 mg· mL-1) and Aminoguanidine (AG) (0.2 mg· mL-1) were used as test and positive control. NBT reductive assay, Girard-T assay and fluorescence were used to determine the inhibition effects on LDL glycation.
1.2.2 GC-MS analysis
The CEO was dissolved in dichloromethane with a dilution of 0.1% (V/V), and then 1 μ L was injected into the column with a split ratio 1:20. The oven temperature was initiated from 50 ℃ and hold for 1 min; raised to 120 ℃ at 20 ℃· min-1 and held for 10 min; raised to 250 ℃ at 20 ℃· min-1 and hold 5 min. The mass spectrum was operated with the electron impact ionization (EI) method at 70 eV. The mass scan range was from 35 to 550 amu and the ion source temperature was 270 ℃. MS transfer line and injector temperature were 250 ℃.
1.2.3 The interaction between eugenol and BSA
BSA stock solution was prepared in 50 mmol· L-1 Tris-HCl buffer, which contained 50 mmol· L-1 NaCl at pH 7.4. Eugenol, phenylbutazone and ibuprofen stock solution were prepared with absolute ethanol. Then these stock solutions were stored in the dark at 4 ℃ before spectroscopy assay, and each solution was mixed and incubated for 30 mins before the spectra were measured.
1.2.3.1 UV-Vis absorption spectroscopy
The UV-Vis absorbance measurements were carried out at room temperature. The absorbance of the complex solution was recorded in the range of λ 200 to 400 nm[9].
1.2.3.2 Fluorescence spectroscopy
Fluorescence emission spectra: the spectra of BSA and BSA-eugenol systems were measured at 298, 303, and 308 K, respectively. Excitation wavelength (EX) was set to 280 nm and emission wavelength (EM) ranged from 290 to 420 nm[9].
Site marker competitive experiments: These experiments were carried out at 298 K. Phenylbutazone, and Ibuprofen were used as site markers for the site Ⅰ and Ⅱ , respectively[10].
SF and 3D spectroscopy: The SF and 3D spectra of BSA and BSA-eugenol systems were recorded at 298 K[10].
1.2.3.3 FTIR spectroscopy
FTIR spectra of BSA and BSA-eugenol complexes were determined by the potassium bromide tablet pressing method at 298 K. All FTIR spectra were collected from 1 500 to 1 700 cm-1 and taken by 32 scans at 2 cm-1 resolution[7].
1.2.3.4 Molecule docking
A molecular docking experiment was performed by using Docking Software Schrö dinger to simulate the interaction of BSA with eugenol[8]. For molecular docking, the crystal structure of BSA (PDB Code: 4F5S) was downloaded from Protein Data Bank (http://www.rcsb.org/pdb). The structure of eugenol was downloaded from the Chemspider database (http://www.chemspider.com/). BSA and eugenol were prepared in mastro software. The optimized protein molecule was set as the active site to simulate docking with eugenol inmastro software and select the optimal docking results for analysis.
2.1.1 Analysis of the early products
LDL Glycation generally consists of three reaction stages: early, intermediate and late stage. In the early stage, carbonyl groups of reducing sugars react with free amino groups to form unstable early lipoxidation products (Schiff bases). These Schiff bases further undergo rearrangement to form stable products-Amadori products[4]. Therefore, the content of Amadori products is an indicator of the early stage of proteins glycation.
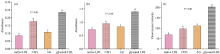
The absorbance of CEO or AG was between the absorbances of natural LDL and glycated LDL [Fig.1(a)], and it was significantly lower than that of glycated LDL samples (p< 0.01).The results showed that CEO and AG had significant inhibition effects on Amadori products, and the inhibition percentage of CEO and AG were 24.58% and 54.24%, respectively. José et al[1] found that CEO contains phenolic substances with strong antioxidant activity, including eugenol. Khanam et al[11] found that the antioxidant activity of natural products is closely related to the antiglycative activity. Therefore, the inhibition effect on Amadori products may be due to phenolic substances contained in CEO.
 | Fig.1 The inhibition effects of CEO on LDL glycation products at different stages (a): The inhibition effect of CEO on Amadori products; (b): The inhibition effect of CEO on dicarbonyl products; (c): The inhibition effect of CEO on AGEs |
2.1.2 Analysis of the intermediate products
Dicarbonyl compounds are considered the intermediates in the formation of AGEs and are formed during the intermediate stage[4]. Although the absorbance of AG or CEO was higher than that of natural LDL [Fig.1(b)], it is significantly lower than that of glycosylated LDL (p< 0.01). It showed that CEO and AG could effectively inhibit the formation of dicarbonyl compounds, and the inhibition percentages of CEO and AG were 31.63% and 40.15%, respectively. The inhibition effect of CEO on the intermediate products of LDL glycation might also be related to its phenolic components.
2.1.3 Analysis of the late products
AGEs, the late products of LDL glycation, formed with the interaction between dicarbonyl compounds and proteins[4]. As shown in Fig.1(c), under identical conditions, the fluorescence intensity of glycated LDL was the highest. Compared with glycated LDL, the inhibition rates of CEO and AG were 52.00% and 45.01%, respectively. Hence, it can be inferred that both CEO and AG exhibited significant inhibitory effects on AGEs formation, and the inhibitory effect of CEO was even better than that of AG (p< 0.01).
It was found that CEO had the best inhibition effect on the late stage (Fig.1).
CEO was proved to possess an inhibition effect on LDL glycation in sections 2.1. It was speculated that the antiglycative activity of the CEO might be related to its phenolic substances. After that, the chemical composition of CEO was analyzed by GC-MS in the present study, and the result was shown in Table 1. There are eight major compounds in CEO. Eugenol was the most abundant compound in CEO, and its content accounted for approximately three-fourths of total components, which also verified that there were many phenolic compounds in CEO. The GC-MS identification results of CEO were difference different from the previous research. This might be related to the source and extraction method of clove.
| Table 1 Component identification and peak area percentages of CEO |
2.3.1 UV-Vis spectroscopy
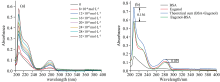
Generally, the BSA absorption spectrum presents two peaks. One absorption peak in the wavelength region of 200~240 nm is related to the n— π * transition of the polypeptide backbone structure of the BSA. The other peak is 260~300 nm, which arises from the presence of tyrosine (Tyr), tryptophan (Trp), and phenylalanine (Phe) amino acids[12].
From Fig.2(a), it was observed that there was an increase in absorbance intensity of BSA at 209 and 281 nm with the gradual addition of eugenol. Eugenol addition to BSA solution (Eugenol-BSA complex) produced a lower absorbance intensity than the theoretical sum (BSA+eugenol) [Fig.2(b)], which was due to the formation of the complex during the intermolecular interaction and resulted in lower absorbance.
 | Fig.2 UV-Vis spectra of the interaction between eugenol and BSA at room temperature (a): UV-Vis spectra of BSA with different concentrations of eugenol, cBSA=1× 10⁻⁷ mol· L-1, ceugenol=(8, 12, 16, 20, 24, 28, 32)× 10-6 mol· L-1; (b): UV-vis spectra of eugenol, BSA and eugenol-BSA complex, theoretical sum (BSA+eugenol), BSA and eugenol, cBSA=1× 10⁻⁷ mol· L-1, ceugenol=32× 10-6 mol· L-1 |
2.3.2 Fluorescence emission spectroscopy
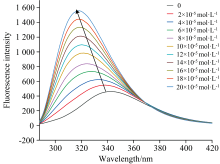
Fluorescence spectroscopy is one of the important techniques used to investigate the interaction between small molecules and biological macromolecules as an effective method[10]. In general, the intrinsic fluorescence of BSA is due to the presence of Trp, Tyr and Phe residues[47].
With different concentrations of eugenol addition, the emission intensity of BSA showed a marked increase with a blue shift in the emission maxima from 341.4 to 318.4 nm (Fig.3). This indicated that the interaction between eugenol and BSA changed the microenvironment around BSA, which further confirmed the interaction between BSA and eugenol.Xiong et al[8] found that alpha arbutin could also cause a similar phenomenon in the fluorescence emission spectrum of HSA.
 | Fig.3 Fluorescence spectra of the interaction between eugenol and BSA at 298 K cBSA=2× 10⁻⁶ mol· L-1, ceugenol=(0, 2, 4, 6, 8, 10, 12, 14, 16, 18, 20)× 10-5 mol· L-1 |
2.3.3 Binding parameters
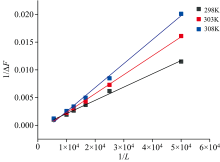
The results in sections 2.3.1 and 2.3.2 confirmed the interaction between eugenol and BSA. Therefore, the binding constant value was calculated using the following equation[8].
where Δ F=Fx-F0, Δ Fmax=F∞ -F0; F0, Fx and F∞ are the fluorescence intensities of BSA in the absence of eugenol, at an intermediate concentration of eugenol, and the saturation of interaction, respectively; Kb is the binding constant and [L] is the concentration of eugenol.
 | Fig.4 Double-reciprocal plot of fluorescence enhancement of the interaction between eugenol and BSA at three temperatures (viz. 298, 303 and 308 K) |
It showed a good linear relationship between 1/Δ F and 1/[L] at different temperatures in Fig.5 (R2> 0.99). The binding constant Kb can be obtained from the reciprocal of the slope of the line, and the corresponding values were calculated and listed in Table 2[8]. From the data in table 2, it was clear that with the temperature rise, the Kb values declined. It showed that the thermodynamic process was involved in the formation of the complex, and the stability of the eugenol-BSA complex decreased with increasing temperature. The calculated binding constant Kb was also in the range of the binding constants of other small molecules interacting with serum albumin, confirming these results’ validity[6].
| Table 2 The binding constants and thermodynamic parameters at different temperatures for the interaction between eugenol and BSA |
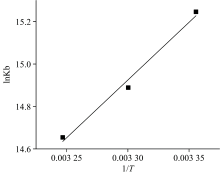
 | Fig.5 Van’ t Hoff plotof the interaction between eugenol and BSA |
2.3.4 Thermodynamics of the BSA-eugenol interaction
Generally, there are four non-covalent forces upon ligands interacting with biomolecules: electrostatic interaction, hydrogen bond, hydrophobic force and vander Waals force. Thermodynamic parameters, including enthalpy change (Δ H), entropy change (Δ S) and Gibbs free energy change (Δ G) are mostly used to identify the principal binding forces between ligands and proteins. In order to determine the main forces involved in BSA-eugenol binding, the thermodynamic parameters can be evaluated at three different temperatures (298, 303 and 308 K) referring to the van’ t H off equation[7].
Kb represents the binding constant at the corresponding temperature T, and R (8.314 J· K-1· mol-1) is the gas constant.
The plot of lnKb against 1/T in Fig.5 gave a straight line (R2=0.988), and the values of Δ H and Δ S could be determined according to the slope and intercept (Table 2). The main type of the binding forces between eugenol and BSA was judged according to the opinion of Ross and Subramanian[7]. The positive values of Δ H and Δ S imply that hydrophobic forces are the main force. If Δ H< 0 and Δ S> 0, the main force is electrostatic interactions. When Δ H< 0 and Δ S< 0, the main force corresponds to vander Waals force and hydrogen bond formation[7]. The negative Δ G values indicated that the interaction was spontaneous. From the data, it was seen that Δ H< 0 and Δ S< 0, signified that the interaction between BSA and eugenol was due to the presence of vander Waals force and hydrogen bond formation.
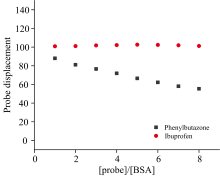
 | Fig.6 Effects of site maker probes on the binding sites of eugenol and BSA at 298 K cBSA=ceugenol= 5× 10⁻⁶ mol· L-1, cprobe=(0, 5, 10, 15, 20, 25, 30, 35, 40)× 10-6 mol· L-1 |
2.3.5 Site marker competitive experiments
The main binding sites of the ligands on BSA are site Ⅰ and site Ⅱ (Sudlow sites)[7]. Therefore, in this site marker competitive experiment, phenylbutazone and ibuprofen were used as fluorescent probes to discern whether eugenol bound BSA at site Ⅰ or Ⅱ . After being substituted by probes, the binding percentages of eugenol with BSA were calculated by the following equation[13].
where F1 and F2 are the fluorescence intensity of the BSA-eugenol system in the absence and presence of the probes, respectively.
It showed that with the increasing addition in phenylbutazone there was an obvious decline of probe displacement (Fig.7). While, there was almost no change caused by ibuprofen. Therefore, these results indicated that the eugenol competed preferentially with phenylbutazone for the same binding site in BSA structure, i.e site Ⅰ .
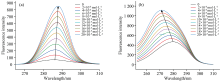
 | Fig.7 SF spectra of the interaction between eugenol and BSA at 298 K (a): Δ λ =15 nm; (b): Δ λ =60 nm cBSA=2.0× 10⁻⁶ mol· L-1, ceugenol=(0, 2, 4, 6, 8, 10, 12, 14, 16, 18, 20)× 10-5 mol· L-1 |
2.3.6 Conformation investigation
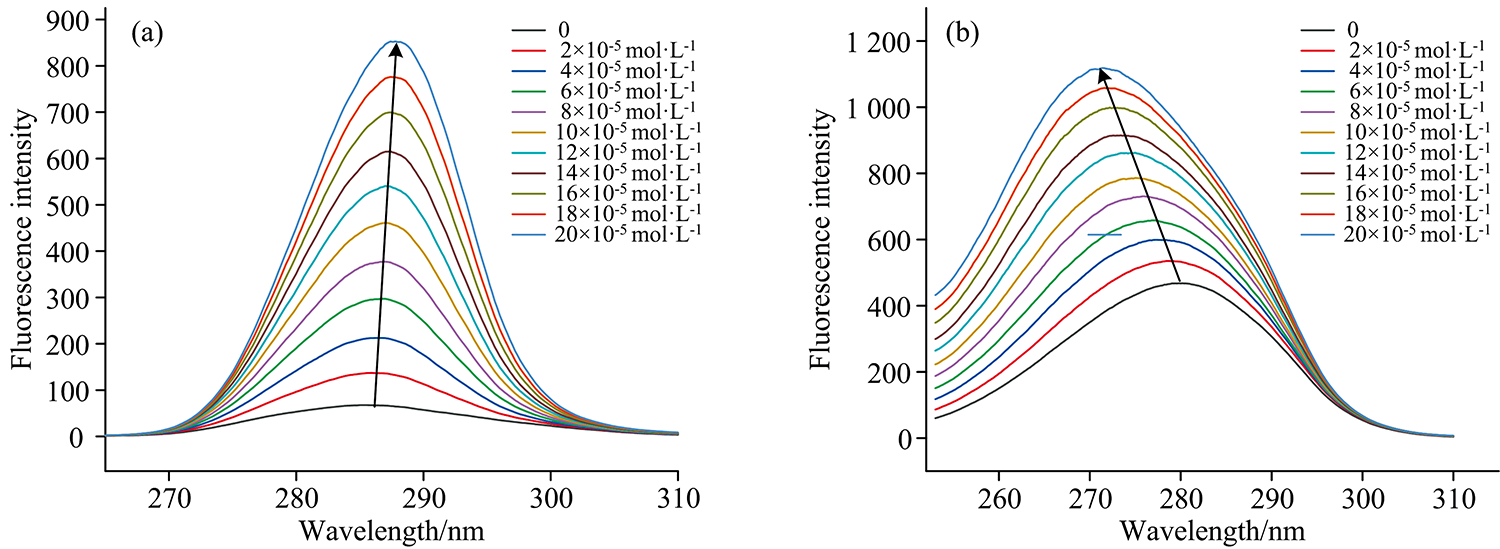
2.3.6.1 SF spectroscopy
SF spectroscopy can be used to characterize the microenvironment changes around amino acid residues in the protein[10]. Two different Δ λ (15 and 60 nm) separately represent the spectrum characteristics of Tyr and Trp residues. BSA has 20 Tyr residues and two Trp (Trp134 and Trp213) residues[7]. The possible shift of the maximum fluorescence wavelength is related to the change in the hydrophobicity and polar environment in the vicinity of Tyr and Trp in BSA upon ligand binding[14]. The conformational changes of BSA can be explained by the micro-region changes of Tyr and Trp residues.
It can be inferred that there was a slight red shift (285.60 nm→ 287.80 nm) in the maximum emission wavelength of BSA with the increasing concentration of eugenol when Δ λ =15 nm from Fig.7(a), which suggested that the polarity of the micro-environment around the Tyr residues increased and the hydrophobicity decreased with the addition of eugenol[15]. On the other hand, a substantial blue shift (from 279.40 to 271.40 nm) was observed in the maximum fluorescence intensity of BSA at Δ λ =60 nm [Fig.8(b)]. This implied that with the increase of eugenol concentration, the polarity of the microenvironment around Trp residues decreased and the hydrophobicity increased[10]. Thus, the conformation of BSA was altered in the presence of eugenol and the Trp residues played a major role in the conformational changes of BSA.
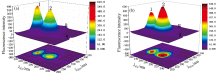
 | Fig.8 3D fluorescence spectra of BSA in the absence and presence of eugenol at 298 K (a): BSA; (b): Eugenol-BSA; cBSA=2.0× 10⁻⁶ mol· L-1, ceugenol=0, 8× 10⁻⁵ mol· L-1 |
2.3.6.2 3D fluorescence spectroscopy
3D fluorescence spectroscopy can provide comprehensive fluorescence information and is a reliable technology to characterize protein conformational changes[10].
Fig.8(a) shows four main peaks (1, 2, A, B). Peak A (EM=EX) represented the Rayleigh scattering peak, whereas peak B (EM=2EX) was directly connected to the second-ordered Rayleigh scattering peak. Meanwhile, the other two peaks, namely Peak 1 (EX=230 nm, EM=360 nm) and Peak 2 (EX=280 nm, EM=355 nm), symbolized the fluorescence spectral characteristics of the polypeptide backbone, and Tyr and Trp aromatic amino acids, respectively[10]. After the addition of eugenol, the fluorescence intensitiesof peak 1 and peak 2 increased from 383.07 and 348.60 to 434.10 and 608.17, respectively. Therefore, the variation trend of fluorescence intensitiesin 3D fluorescence spectroscopy was consistent with that in 2.3.2.After the interaction between eugenol and BSA, the fluorescence intensity of peak 1 increased by 13.32% with blue shift (360 nm→ 345 nm), which may be related to the P→ P* transition of on the BSA polypeptide skeleton[8]. The fluorescence intensity of peak 2 increased by 74.46% with blue shift (355 nm→ 340 nm). It indicated that eugenol could reduce the polarity of the environment around amino acid residues in BSA and enhance hydrophobicity, which is consistent with the results of the SF spectroscopy test.
2.3.6.3 FTIR spectroscopy
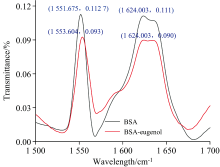
FTIR spectroscopy is an additional method to obtain information on amide bands in BSA. Amide Ⅰ (1 700~1 600 cm-1) is mainly related to the C=O stretch vibration, and amide Ⅱ (1 600~1 500 cm-1) is mainly associated with C— N stretch vibration coupled with N— H bending mode. These two amides are most widely used for BSA secondary structure analysis[15]. Fig.9 showed the FTIR spectra difference before and after the addition of eugenol. These results showed that the interaction of BSA with eugenol led to a slight shift in the peak intensity and wave number of BSA amide Ⅱ from 1 551.68 to 1 553.60 cm-1. However, the intense bands in the amide Ⅰ spectral region were not shifted. These outcomes revealed that eugenol affected the stretching vibration of C— N stretching and N— H bending mode. In addition, the observed changes implied that the secondary structure of BSA was partially affected by the addition of eugenol[15].
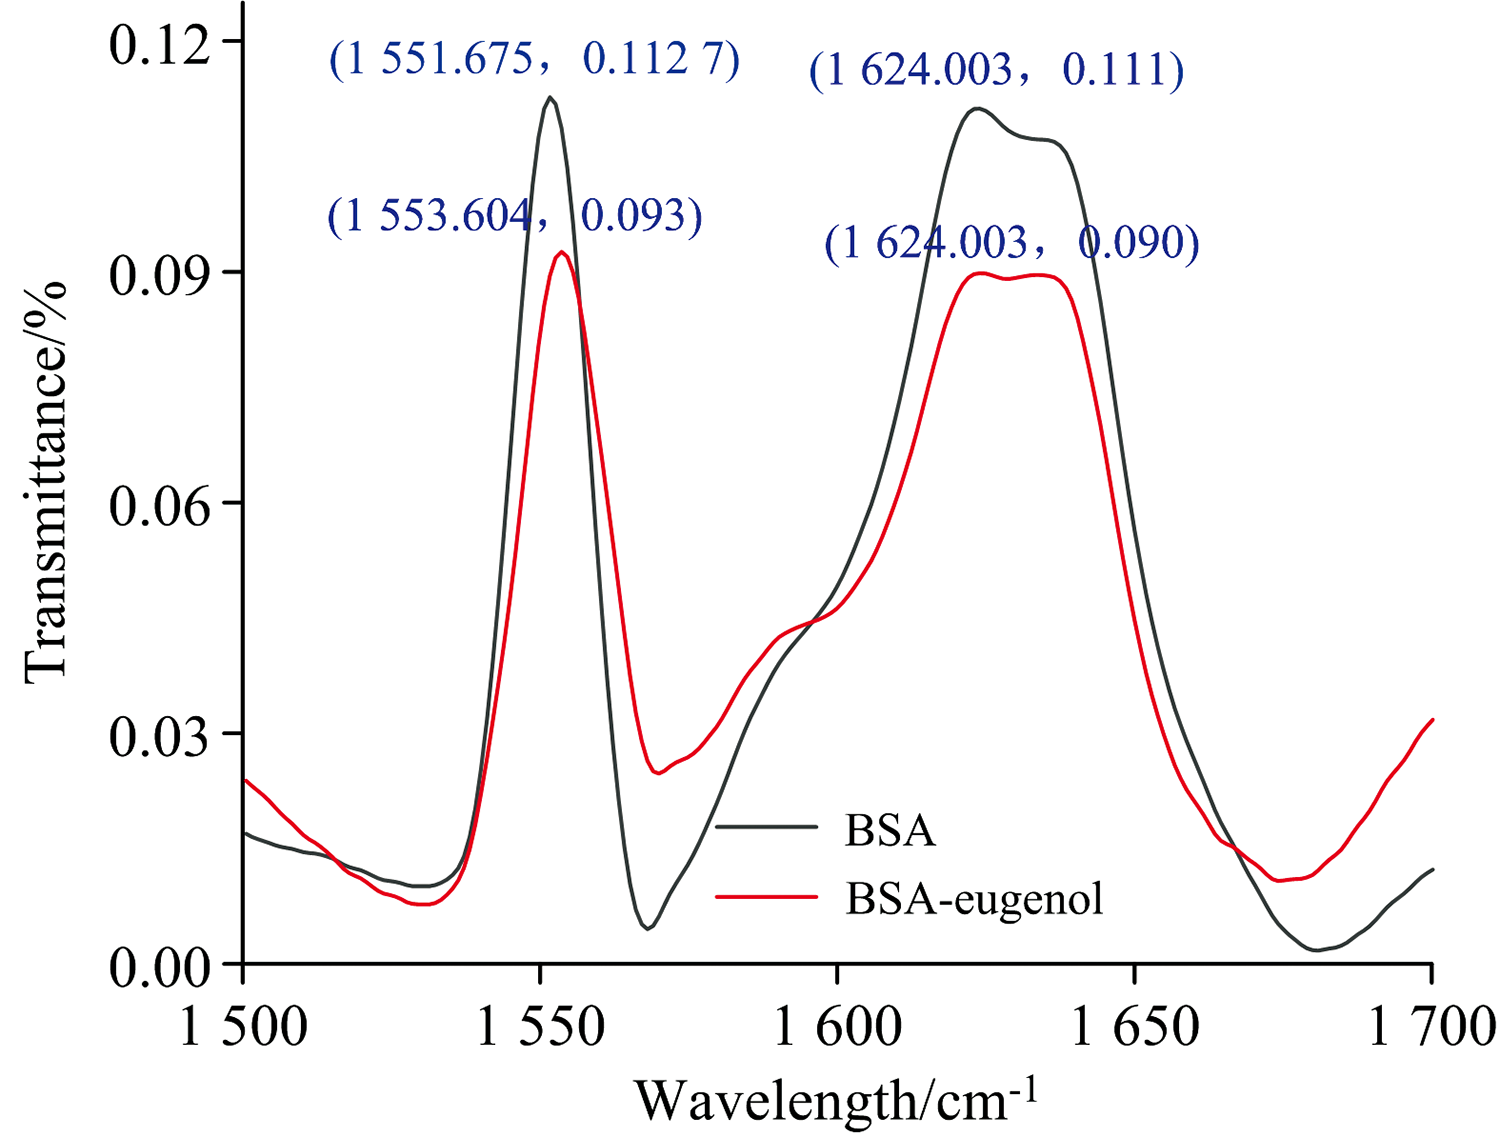 | Fig.9 FTIR spectra of the interaction between eugenol and BSA at 298 K cBSA=5× 10⁻⁶ mol· L-1, ceugenol=0, 5× 10⁻⁶ mol· L-1 |
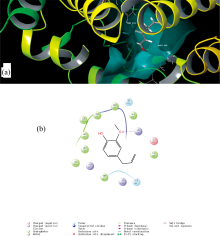
2.3.7 Molecular docking
The interaction between BSA and eugenol was verified in the above sections. On this base, molecular docking was used and verify the fluorescence experiment results’ validity.
BSA is a globular protein with the heart-shaped structure containing 582 amino acids. It is divided into three main domains, and each homologous domain is composed of two subdomains (marked as A and B). Site Ⅰ and Ⅱ of BSA are located in subdomains Ⅱ A and Ⅲ A[16].The docking result was displayed in Fig.10. It indicated that the binding site of eugenol on BSA was a site Ⅰ and Trp213 were involved in forming a hydrophobic pocket. Eugenol interacted with Arg256 residue on BSA through the hydrogen bond. In addition, the amino acids around eugenol were polar amino acids, such as Arg198, Glu152 and Arg256, which showed strong vander Waals force, respectively. The result of the molecular docking experiment was consistent with the experimental spectroscopy results.
 | Fig.10 Molecular docking results of eugenol and BSA (a): The molecular docking simulation of eugenol and BSA; (b): Two-dimensional diagram of the interaction between eugenol and BSA |
At first, the CEO was found to possess an antiglycative effect on LDL. After that, eugenol was identified as the most abundant component in CEO by GC-MS. Finally, the interaction between BSA and eugenol was confirmed by multispectral, and the conformation of BSA was changed due to thisinteraction. Thermodynamic parameters’ calculation results showed that the BSA and eugenol binding process was spontaneous and mainly facilitated by hydrogen bond and vander Waals force. Site marker competitive experiments suggested site Ⅰ as the binding site of eugenol on BSA. The molecular docking results confirmed the results of the spectral test from the theoretical level. All in all, our results demonstrate that eugenol presents a good binding ability toward BSA and could be transferred to the body through serum albumin. This study also provides a choice for looking for LDL glycation inhibitors from the clove.
The authors would like to thank LanLan Zang in Shandong University and Wenbo Liu in Jiujiang University for kind helps in molecular docking analysis, and thank Xiangqun Shi and Donglin Li in analysis and testing center of Jiujiang University for GC-MS and FTIR spectra analysis.
| [1] |
|
| [2] |
|
| [3] |
|
| [4] |
|
| [5] |
|
| [6] |
|
| [7] |
|
| [8] |
|
| [9] |
|
| [10] |
|
| [11] |
|
| [12] |
|
| [13] |
|
| [14] |
|
| [15] |
|
| [16] |
|