碳氢扩散火焰实验研究: 燃烧气氛对火焰光谱与温度的影响
[唐广通1 , 闫慧博1 , 汪潮洋1 , 刘志强1 , 李欣1 , 闫晓沛1 , 张仲侬2 , 娄春2, *  ]
]
]
|
|


辐射是各种燃烧过程中热传递的主要方式。 在不同的火焰中, 辐射光谱分布十分复杂。 在这项工作中, 利用光谱仪测量了可见光(200~900 nm), 近红外(900~1 700 nm)和中红外(2 500~5 000 nm)波段火焰的光谱强度, 分析了空气和富氧气氛下扩散火焰的光谱特征。 并基于光谱分析, 定量得到了火焰中碳烟以及气体发射的辐射力, 计算了火焰的温度分布。 结果表明, 空气燃烧中的火焰温度低于富氧燃烧中的火焰温度。 在空气气氛下, 火焰中的碳烟和气体均对中的热辐射起着重要作用。 而在富氧气氛下, 气体对于火焰热辐射更为重要。 在可见光和近红外波段, 由于在空气气氛下火焰中碳烟的大量形成, 光谱曲线显示出了良好连续性。 而富氧气氛下火焰的辐射光谱降低。 在中红外波段, 空气气氛下火焰的气体辐射明显弱于富氧气氛下火焰的气体辐射。
Radiative heat transfer is the main mode of heat transfer in various combustion processes. The distribution of radiative spectra is complicated for different flames. In this work, the spectral intensities of a hydrocarbon diffusion flame invisible (200~900 nm), near-infrared (900~1 700 nm) and middle-infrared (2 500~5 000 nm) wavebands were measured by spectrometers. The spectral characteristics of the flame in air and oxy-combustion atmospheres were analysed. Based on spectral analysis, flame temperature was calculated, and thermal radiation from soot particle and gases in the flame could be quantitively evaluated. The results show that flame temperature in air combustion is lower than in oxy-combustion. Both soot and gas in flames play an important role in thermal radiation in air combustion, and gas is more important for thermal radiation in oxy-combustion. In visible and near-infrared wavebands, the spectral curve shows good continuity in air-combustion due to soot formation, but the radiative spectrum reduces in oxy-combustion. In the mid-infrared waveband, the gas radiation spectrum of air-combustion is obviously weaker than that of oxy-combustion.
Thermal radiation is one of the important characteristics of flame, which is closely related to flame temperature, composition and volume[1]. The thermal radiation of flames mainly come from particles (soot and char, etc.) and gases (CO2, H2O, CO, etc.) in the flame[2], and the spectral range covered includes ultraviolet, visible and infrared wavebands. Besides reflecting the spectral characteristics of the flame, some important parameters, such as temperature, can be obtained indirectly by measuring flame radiative spectroscopy[2].
However, the distribution of flame radiative spectra is complicated due to soot and gas. The particles' radiation spectrum shows continuous characteristics similar to the blackbody spectrum. Liu et al. [3] proposed a generalized method to estimate a two-dimensional distribution of temperature and wavelength-dependent emissivity in sooting flames with spectroscopic radiation intensities based on this characteristic of soot. Recently, Yu et al.[4] compared soot thermal radiation of diffusion flames in air and oxygen-enriched atmospheres. Meanwhile, gas radiation mostly exhibits band properties. That is, it only emit and absorb thermal radiation in specific bands and is located in the infrared band. These bands are composed of many spectral lines, and the characteristic of these spectral lines is more complex[5]. Many gas radiation models and computing methods have been proposed and well developed[5]. Additionally, the temperature is a crucial factor that affects the flame thermal radiation. The thermal radiation intensity increases when the temperature rises, and flame temperature can be measured by obtaining the spectral distribution of flame[6].
One of the inherent benefits of oxy-combustion is that the oxygen and dilution gases are initially separated and can be strategically blended with either fuel stream, oxidizer stream, or both. It provides significant flexibility in the design and operation of oxy-combustion burners. Laboratory studies of diffusion flames have proved that the relocation of dilution gases can profoundly impact soot formation and flame structure[7, 8]. Furthermore, the flame radiative spectroscopy distribution also has obvious change. Thus, some works were developed for analysing the radiative spectra of various flames. Shaddix et al[9] measured the radiation spectrum of the turbulent, non-premixed methane flames, and they analysed the effect of oxygen enrichment on the thermal radiation of flame. Wang et al. [10] investigated the changing of soot radiation by oxygen being added to the fuel stream of a steady laminar ethylene diffusion flame.
This fundamental study set four co-flow ethylene diffusion flame cases, maintaining the same flame adiabatic temperature while Zst gradually increases. It is worth noting that Zst is an important parameter in the analysis of combustion, and it affects flame construction and soot formation. The definition of Zst was given in reference[8]. CO2 was employed as the dilution gas to simulate the recycling of dry flue gas. The spectral radiative intensity distributions in visible, near-infrared, and middle infrared wavebands along the height of the flames were measured, and then the flame temperature and radiation power of flames would be calculated through spectral analysis. Furthermore, the variation of thermal radiation of soot and gases were analysed. Finally, the influences of varying Zst on flame radiation and flame temperature were discussed.
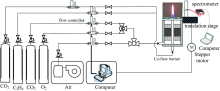
As shown in Fig. 1, the experimental system comprises a burner, flow controllers, computers, spectrometers, translation stage and other devices. A Gü lder burner, which can generate co-flow laminar diffusion flames at atmospheric pressure[6], was utilized in this work. The burner consists of a 10.9 mm inner diameter of a fuel tube centred in an oxidizer nozzle with 88 mm inner diameter and 100 mm outer diameter. The wall thickness of the fuel tube is 0.95 mm.
 | Fig.1 Diagram of experimental setup |
The fuel flow passes through the central tube, and the oxidizer stream passes through packed beds of glass beads and porous metal disks to make the flow as laminar as possible and prevent flame instabilities. Gas mass flow controllers, with a metering error of less than ± 1%, govern the flow rates of all gases and ensure the accuracy and stability of gases flow. The experimental conditions are summarized in Table 1. Symbols
| Table 1 Experimental cases |
1.2.1 Acquisition of flame spectral intensities
Flame emission spectra within a certain wavelength range can be obtained by spectrometers. In the experiment, the spectrometer system includes three portable spectrometers (type: AvaSpec-USB2048, AvaSpec-NIR256 and SM301-EX). The measurement wavelength range of the AvaSpec-USB2048 spectrometer is from 200 to 1 100 nm, and the spectral resolution is 0.8 nm, the AvaSpec-NIR256 spectrometer provides measurement wavelength range from 900 to 1 750 nm, and the spectral resolution with 6 nm and the SM301-EX spectrometer provides measurement wavelength range from 2 500 to 5 000 nm and the spectral resolution with 10 nm. In the experiment, spectrometers obtained the spectral radiation information at different heights of the flame axis, and the measurement positions were accurately controlled by the translation stage and the stepping motor. The spectrometers have completed the calibration on a blackbody furnace (type: M330) before the experiment so that the absolute radiative intensities of the flame could be measured. The calibrated results show that the spectral curve coincides with a wavelength range from 900 to 1 100 nm. The flame height varies greatly under different experimental conditions. In order to better compare the thermal radiation of different flames, the method of height normalization was adopted in this paper, which means the height of each flame was considered as 1. It is necessary to point out that the normalization height of some points will be greater than 1, as the measuring positions exceed the actual height of the flame.
1.2.2 Calculation of flame temperature
As shown in Fig.3 and Fig.4, flame spectral radiative intensities Iλ are equal to the sum of continuous spectral radiation intensities Isoot from particulates and discontinuous spectral intensities Igases from gas emission bands in flame, that is Iλ =Isoot+Igases. Iλ is the actual spectral radiative intensity measured under the wavelength λ . In the visible band, the flame temperature T and emissivity of soot ε λ could be calculated by the method of multi-wavelength radiation analysis[3]. In this method, according to the Taylor series, emissivity ε is generally expressed as a function of wavelength λ
where a0, a1, ..., ap represent the unknown polynomial coefficients. Furthermore, the spectral radiative intensity can be given as
Therefore, the temperature and these polynomial coefficients can be obtained by solving Eq. (2) using the Newton-type iterative method.
1.2.3 Calculation of radiation power of soot and gases
Band emissive power
Besides spectral radiative intensities, radiation power P will also be calculated to compare the quantity of radiation heat transfer of different species in the whole flame. P can be expressed as
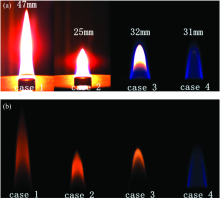
The flames' colour images in case 1~4 are shown in Fig.2. In case 1 and case 2, flames are bright yellows, and the visible height is 47 and 25 mm, respectively. In case 3, the interior of the flame is yellow, while the outer layer is blue, and the flame height is 32 mm. In case 4, the flame is almost completely blue, with only a little yellow flame at the tip of the flame, with a height of 31 mm. It can be seen that the colour of the flame gradually changes from yellow to blue because soot formation is suppressed with the increase of Zst. The dilution of CO2 has great effects on the flame structure.
 | Fig.2 Color flame images of four cases (a): Shutter speeds are fixed at 1/60 s; (b): Shutter speeds are 1/39 000, 1/30 000, 1/1 000, and 1/100 s, respectively (from case 1 to case 4) |
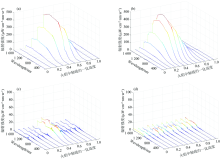
Fig.3 shows the spectral radiative intensities of 200~1 700 nm at the different normalized heights of the flame axis. As shown in Fig.3, the spectral radiative intensities of 200~1 700 nm tend to increase first and then decrease with the increase of height. The peak values of soot radiative intensities in these two cases are close, and the soot radiation is mainly concentrated at the middle height of the flame, while at the bottom and top, that is very weak, which is almost zero. This band mainly consists of visible and near-infrared, and the spectral curve shows good continuity due to the radiation from soot particles. It can be seen that the radiative intensities of soot in case 1 and case 2 are strong, and the corresponding flames are bright yellow. Once the diluent was added to the fuel side, the radiative intensity of soot reduced significantly. There is only weak soot radiation at the middle of the flame in case 3 and no soot radiation in case 4. It can be found that the soot radiation gradually becomes weaker with the increase of Zst, which indicates a significant change in the species distribution in the flame.
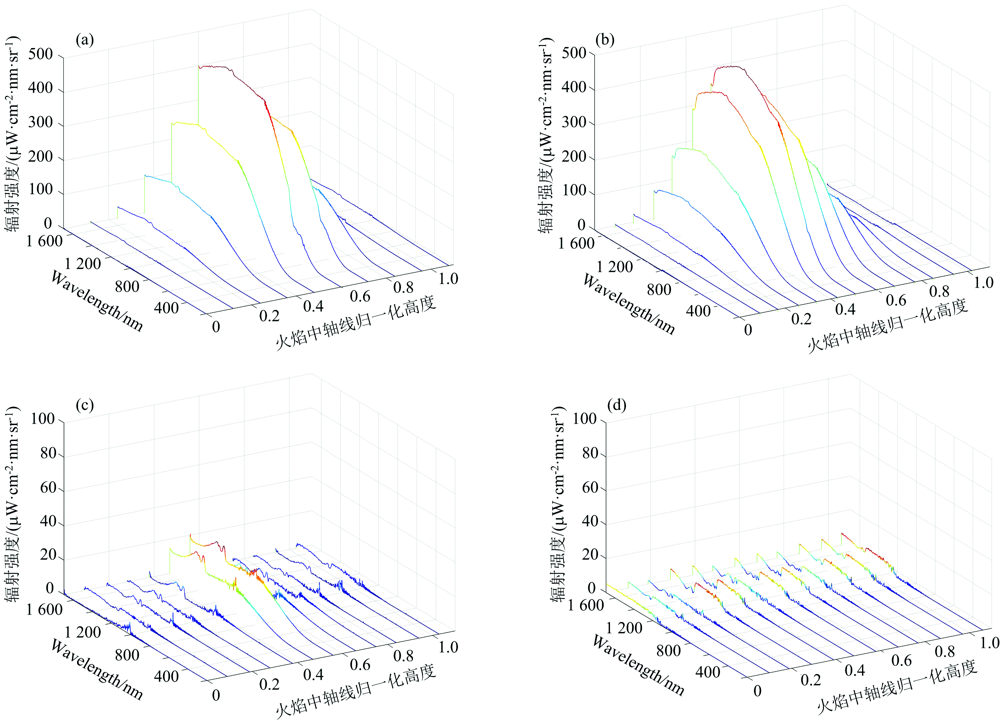 | Fig.3 Spectral radiative intensities from 200 to 1 700 nm at different normalized heights of flame axis (a): Case 1; (b): Case 2; (c): Case 3; (d): Case 4 |
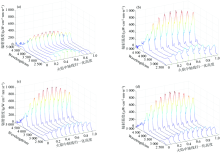
In Fig.4, the spectral radiative intensities of 2 500~5 000 nm at different normalized heights of the flame axis are given, CO2 and H2O have strong radiation in this wave range. As shown in Fig.4, the spectral radiative intensities of 2 500~5 000 nm also tend to increase first and then decrease with the increase of height. There is an obvious wave peak in the spectral curve near 2 700 nm due to both CO2 and H2O radiation, and their radiative band are partly overlapped. In addition, CO2 has its own radiative band around 4 300 nm, which is clearly seen in the figure and the peak value is high. Meanwhile, the wave peak in case 1 is at about 4 390 nm, while at about 4 510 nm in the other three cases. This may own to the high concentration of CO2 at the oxidant side in oxy-combustion, the absorption of CO2 changes the received spectral radiation distribution. By overall comparison, gas radiation in the air combustion atmosphere is obviously weaker than that in the other three oxy-combustion atmospheres.
 | Fig.4 Spectral radiative intensities from 2 500 to 5 000 nm at different normalized heights of flame axis (a): Case 1; (b): Case 2; (c): Case 3; (d): Case 4 |
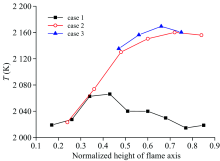
Based on the flame spectral distribution in a visible band in Fig.3, the flame temperatures at different heights in case 1 to case 4 were calculated using multi-wavelength radiation analysis. In case 4 the soot radiation is almost zero, so the temperature cannot be accurately calculated. Similarly, the temperature at the bottom and top height of the flame axis also cannot be calculated. Because the measured radiation intensities are the results accumulated in the direction of sight, the calculated temperature can be considered the average temperature at different flame heights. From Fig..5, it can be seen that in air combustion, the flame temperature varies from 2 000 to 2 050 K and reaches the maximum at middle height, then decreases gradually with the flame height increasing, and the overall variation range is small. In case 2, oxy-combustion atmosphere, the flame temperature increases as the height increases, then it is stable at about 2 150 K at the upper half of the flame and the overall variation range is larger. In case 3, only temperatures at the middle height part of the flame were calculated, and it's about 2 160 K. The difference in temperature between case 2 and case 3 is small. The reason is that soot production in the region of the two flames is similar, and the loss of energy is similar.
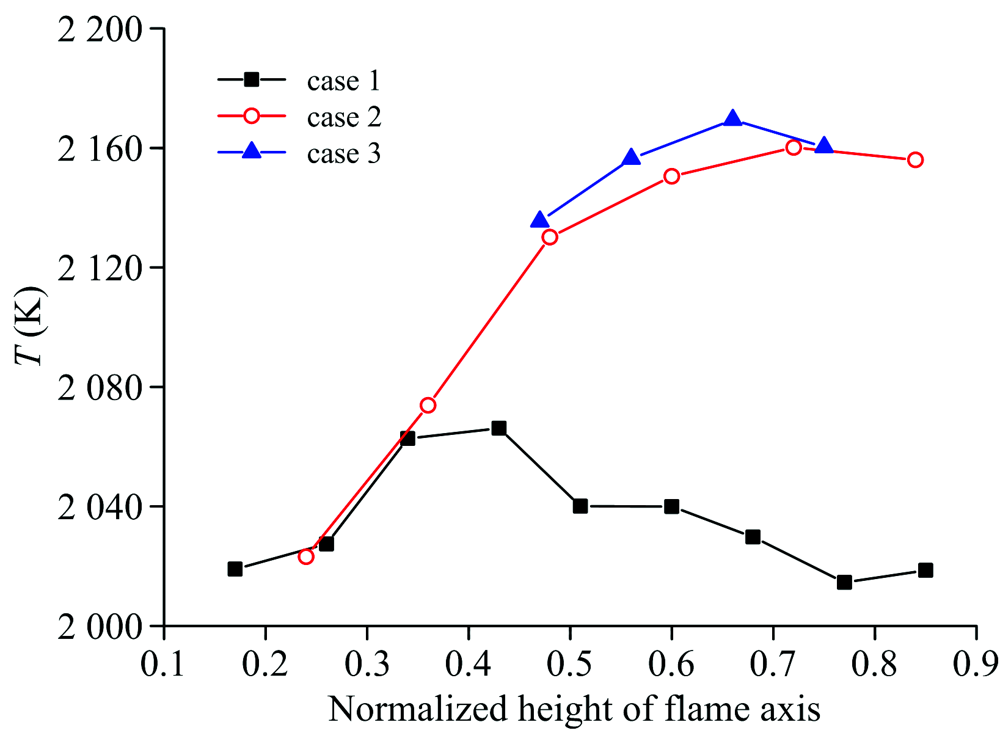 | Fig.5 Temperatures at different normalized heights of flame axis in case 1 to case 3 |
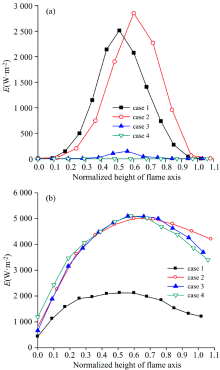
In order to better compare the thermal radiation changes of species in different flames, the band emissive power in a specific band, which can stand for thermal radiation, was calculated. 500~1 000 nm was selected for soot because it was fully contributed by soot radiation, and the calculated results are shown in Fig.6(a). The soot thermal radiation in case 1 and case 2 are strong, and both first increase and then decrease with the flame height increasing. The relative height where soot radiation reaches a peak in case 1 is lower than that in case 2, closely related to the concentration distribution of soot in the flame. In case 3 there is only weak soot thermal radiation at the middle height of the flame, and in case 4, it is almost zero in the whole flame, which shows that the content of soot in the flame is very poor, and the addition of CO2 as diluent has a great effect on the production of soot. Besides soot, the band emissive power of CO2 has also been calculated, but there is a difference in the selection of the band. As mentioned above, the peak positions of CO2 radiation around 4 300 nm are not the same in the four cases. To accurately calculate the emissive power of CO2, 4 290~4 610 nm was selected so that the wavelength range of CO2 thermal radiation was covered. The final calculating results are shown in Fig.6(b). It can be seen that the thermal radiation of CO2 in air combustion atmosphere is weaker than that in oxy-combustion atmospheres, which is mainly due to the initial addition of a large amount of CO2 in case 2 to Case 4, for radiation intensity, is mainly related to the specie concentration and flame temperature. Similarly, the CO2 thermal radiation increases first and then decreases with the increase of the flame height in each case, but the decreasing trends are smaller than that of soot thermal radiation. There is still strong CO2 thermal radiation at the top part of the flame, especially in oxy-combustion. It is more conducive to the radiation heat transfer between the flame and the external.
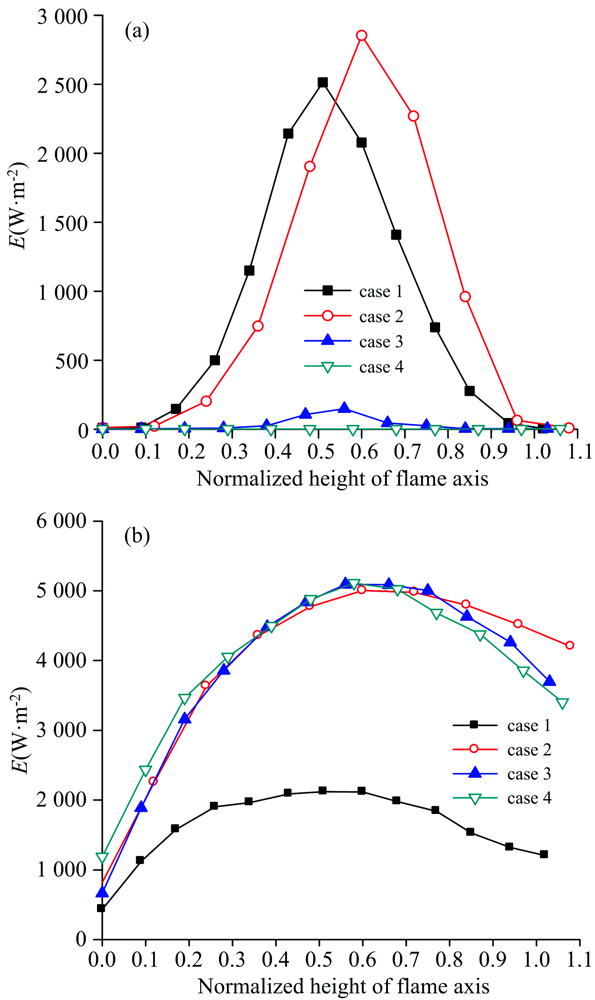 | Fig.6 Band emissive power of species at different normalized height of flame axis for case 1 to case 4 (a): Soot; (b): CO2 |
Compared Fig.6(a) with Fig.6(b), it can be found that in case 1, soot thermal radiation is very strong while CO2 radiation is relatively weak. That is, soot plays an important role in flame thermal radiation. For case 2, both soot and CO2 thermal radiation are very strong, and both of them contribute greatly to flame thermal radiation. For case 3 and case 4, the thermal radiation of soot is basically zero, while the thermal radiation of CO2 is very strong, especially in case 4, gases mainly contribute the thermal radiation of the flame. With the changing of Zst, thermal radiation of soot has a more obvious change than CO2. This is because the Zst has a higher effect on soot formation than the effect on CO2. With the change of Zst, the internal structure of the flame changed, and the thermal radiation of different species also changed significantly. In oxy-combustion, the larger the Zst, which means the higher oxygen concentration and the more diluent added, the thermal radiation decreases gradually while the gas thermal radiation begins to play a major role. The radiation powers of soot and gases were also calculated and shown in Table 2. The range of wavelengths involved in the calculation includes 200~1 700 and 2 500~5 000 nm. In the air combustion atmosphere, soot's radiation power accounts for about half of flame total radiation power and is the highest proportion in four cases. In three oxy-combustion cases, the percentage of soot radiation power decreases quickly. In case 3 and case 4, soot radiation account for zero. The vast majority of flame radiation heat transfer was contributed by gases. In the oxy-combustion atmosphere, the effect of gas radiation becomes more important as Zst increases.
| Table 2 Radiation power in four cases (Unit: W) |
The paper experimentally measured flames' spectral distribution and temperature distribution under different Zst. The result shows that flame structure and spectral characteristics have obvious changes in the air and oxy-combustion atmospheres. In-band of visible and near-infrared, the spectral curve shows good continuity due to the radiation from soot particles in air combustion. There is only weak spectral radiation in the middle of the flame in oxy-combustion. The band emissive power of the flame in air-atmospheres is higher than that in oxy-atmospheres. In-band of mid-infrared (2 500~5 000 nm), CO2 and H2O have strong radiation in this wave range. There is an obvious wave peak in the spectral curve near 2 700 and 4 340 nm. Gas radiation of air combustion is weaker than that of oxy-combustion. The total radiation power of air combustion is higher than oxy-combustion. The temperature measurement results suggested that flame temperature in air combustion is lower than that in oxy-combustion.
| [1] |
|
| [2] |
|
| [3] |
|
| [4] |
|
| [5] |
|
| [6] |
|
| [7] |
|
| [8] |
|
| [9] |
|
| [10] |
|