


基于目标与环境FD模型的多特征检测算法适应性评估
[邓贤明1  , 张天才
, 张天才1, 3 , 刘增灿1 , 李忠盛1 , 熊杰1 , 张翼翔1 , 刘朋浩1 , 岑奕2, * , 吴法霖1 ]
, 张天才, 刘增灿, 吴法霖|
|


作者简介: 邓贤明, 1990年生, 中国兵器工业第五九研究所工程师 e-mail: 15198121267@163.com; 张天才, 1979年生, 中国兵器工业第五九研究所研究员 e-mail: 756924380@qq.com; 邓贤明, 张天才: 并列第一作者
智能变形、 变色、 变温、 变谱技术发展趋势下, 低特征目标加速实现与自然地物背景的特征融合, 导致复杂自然背景环境下低散射、 微反射、 弱辐射目标的检测与评估愈发困难, 特定场景下潜在威胁目标的检测方法快速决策与准确评估成为了难题。 为了提升离散目标、 伪装目标、 弱小目标、 异常目标等低特征目标与复杂自然背景环境融合场景下的多特征检测算法的选择效率及其检测准确度, 提出了目标与背景环境融合度(FD)参数模型, 并设计了植被伪装目标嵌入草地背景、 植被伪装目标嵌入土壤背景、 植被及水泥路伪装目标嵌入土壤背景以及植被、 水泥路、 土壤伪装目标分别嵌入草地、 水泥路、 土壤背景等4种不同波谱特征分布场景的模拟图像数据, 以及信噪比为200, 400与800的高斯白噪声分别加入场景一的3种不同级别噪声比例的模拟图像数据。 通过综合目标波谱信息、 背景波谱信息、 数据噪声比例等多种因素的综合试验分析, 开展了基于目标与环境FD模型的多特征检测算法适应性评估研究。 结果表明, 在标准差均小于0.08的条件下, MtACE, MtAMF, MtCEM, SumACE, SumAMF, SumCEM, WtaACE, WtaAMF, WtaCEM等9大经典多特征检测算法对于4种波谱分布场景检测结果的FD参数平均值分别为0.320 0, 0.350 2, 0.862 4, 0.365 8, 0.365 8, 0.846 1, 0.680 0, 0.680 0和0.948 2; 在标准差均小于0.07的条件下, 9大经典多特征检测算法对于3种不同级别噪声比例数据检测结果的FD参数平均值分别为0.313 5, 0.320 9, 0.774 7, 0.369 6, 0.369 6, 0.847 5, 0.695 6, 0.695 6和0.960 3。 通过不同波谱分布场景及不同噪声级别条件下的检测与融合度评估试验分析, 实现了多特征检测算法的适应性能排序, 大幅提升复杂场景下多种低特征目标的检测效率。 综合波谱与噪声因素, 对于复杂场景下离散分布的低特征目标检测, 9大经典多特征检测算法的优先级顺序为: MtACE>MtAMF>SumACE=SumAMF>>WtaACE=WtaAMF>MtCEM>SumCEM>WtaCEM。
, ZHANG Tian-cai, LIU Zeng-can, WU Fa-linUnder the development trend of intelligent deformation, color change, temperature change, and spectrum change technology, low-feature targets accelerate the realization of feature fusion with the background of natural features, which makes the detection and evaluation of low-scattering, micro-reflection, and weak-radiation targets under complex natural backgrounds more and more difficult . Furthermore, the detection method, rapid decision-making and accurate evaluation of potential threat targets in certain situations have become difficult problems. This paper has proposed a parameter model for Fusion Degree(FD) between targets and background environments to improve the selection efficiency of multi-feature detection algorithms and the accuracy of the detection effect evaluation under the fusion scene of complex natural background environment with low-feature targets, such as discrete targets, camouflage targets, small targets, abnormal targets and so on. At the same time, simulated image data of 4 different spectral feature distribution scenes were designed, including vegetation camouflage targets embedded in the grass background, vegetation camouflage targets embedded in the soil background, vegetation and cement road camouflage targets embedded in the soil background, and vegetation, cement road, and soil camouflage targets embedded in the grass, cement road, and soil background respectively. Furthermore, signal noise ratio(SNR) of 200, 400 and 800 were applied to the spectral feature distribution scenes in which vegetation camouflage targets were embedded in the grass background. Through comprehensive Testal analysis of multiple factors such as spectrum information of targets, spectrum information of background, data noise ratio, etc., the research on threat evaluation of multi-feature detection algorithm was carried out, which was based on FD model between target and environment. Under the condition that the standard deviation is less than 0.08, the average values of FD parameters of the 9 classic multi-feature detection algorithms such as MtACE, MtAMF, MtCEM, SumACE, SumAMF, SumCEM, WtaACE, WtaAMF, and WtaCEM for the detection results of the 4 spectrum distribution scenes are 0.320 0, 0.350 2, 0.862 4, 0.365 8, 0.365 8, 0.846 1, 0.680 0, 0.680 0, 0.948 2, respectively. Meanwhile on the condition that the standard deviation is less than 0.07, the average values of FD parameters of the 9 classic multi-feature detection algorithms for detection results of 3 different levels of noise ratio data are 0.313 5, 0.320 9, 0.774 7, 0.369 6, 0.369 6, 0.847 5, 0.695 6, 0.695 6, 0.960 3, respectively. In this paper, through the analysis of detection and fusion evaluation tests under different spectrum distribution scenarios and different noise levels, the threat level ranking of multi-feature detection algorithms is realized, and the detection efficiency of multiple low-feature targets in complex scenarios is greatly improved. Considering spectrum and noise factors, for the detection of discretely distributed low-feature targets in complex scenes, the priority order of the 9 classic multi-feature detection algorithms is: MtACE>MtAMF>SumACE=SumAMF>>WtaACE=WtaAMF>MtCEM>SumCEM>WtaCEM.
复杂背景环境下目标特征检测分析是军事对抗应用及诸多民用领域的研究热点, 检测的方法主要有基于空间域、 波谱域、 偏振域的方法, 其中基于波谱域的检测方法利用目标及背景地物表面材质的波谱特征差异, 构建目标检测数学模型, 实现目标及背景地物的高精度分离[1, 2, 3], 对于与背景环境融合的离散目标、 弱小目标等低散射弱辐射特征检测, 比基于空间域、 偏振域的方法具备更大的优势[4, 5, 6]。 波谱域目标检测技术主要起源于RXD及其改进的异常特征检测算法[7, 8], 之后, 为了克服噪声和弱小特征的非目标干扰, Chein-I Chang等分别基于信号理论与正交子空间模型先后提出了CEM(constrained energy minimization)/TCIMF(target-constrained interference-minimized filter)、 OSP(orthogonal subspace projection)等实用性较强的经典算法, 由于加入了目标或背景环境的先验波谱信息, 特征检测准确度有了较大提升[9]; 为了提高基于多维正态分布的波谱数据特征检测精度, Kraut等提出了 ACE(adaptive coherence/cosine estimator) 算法、 Fuhrmann 提出了AMF(adaptive matched filter)算法; 为了克服多种特征逐步检测的缺陷, Chein-I Chang提出了SumCEM(sum-CEM)、 WtaCEM(winner take all-CEM)、 MtCEM(multiple target-CEM)三种多特征检测算法[10, 11], 极大提升了多特征检测效率。 为了摸清各种算法对于特定场景下特征检测的准确度, 国内外发展了一系列高置信度理论模型, 如基于层次分析法的评价方法、 基于决策树与随机森林的评价方法、 基于混淆矩阵的评价方法、 基于受试者操作特征曲线[12, 13]的评价方法、 基于准确率/召回率与F1-Score的评价方法、 基于K折交叉验证技术的评价方法等, 但是这些方法对于低特征目标与背景环境的融合度估计能力不足, 难以准确评估复杂环境下多特征检测算法的适应性, 导致特定场景下算法选择效率较低。 本工作首先将基于CEM算法的多特征检测思想拓展至ACE与AMF算法中, 然后基于多特征检测结果, 提出目标与环境融合度(fusion degree, FD)参数模型, 通过综合目标波谱信息、 背景波谱信息、 数据噪声比例等因素的综合试验分析, 实现基于FD模型的9种多特征检测算法适应性准确评估。
特征检测结果灰度图中, 像元的灰度值大小与该像元属于目标的概率大小正相关, 通过将灰度阶级细分并分别计算每一细分灰度阈值下的检测率与虚警率, 获得特征检测的检测率向量与虚警率向量, 分别如式(1)和式(2)所示。
式(1)和式(2)中, Pdn× 1和Pfn× 1分别表示特征检测概率、 虚警率向量, Ndi为第i个分割灰度值下被正确判断为目标的像元数量, Nture表示目标像元总数, Nfi为第i个分割灰度值下被误判为目标的背景地物像元数量, Nmiss表示背景地物像元总数, n为灰度阈值的数量, n一般取大于2 000的整数且保证灰度阈值能够覆盖图像中所有灰度值。
特征检测精度采用传统的ROC(receiver operation characteristics)面积, 即检测率与虚警率关系函数与坐标横轴围成面积, 如式(3)所示。
式(3)中, f(pf, pd)为虚警率与检测率之间的关系函数, pd(2)为倒数第二大阈值下的检测率, Δ pf为虚警率向量元素之间的增长步长。 但是ROC对于性能较为接近的算法优劣评估效果较差、 灰度阈值分割的数量对评估结果影响较大, 基于此, 提出如式(4)所示的目标与环境融合度(fusion degree, FD)参数模型, 结合ROC面积实现算法检测性能综合评判。
式(4)中, Δ τ 为阈值向量的元素之间步长,
基于Chein-I Chang提出的MtCEM, SumCEM和WtaCEM多特征检测算法, 将基于CEM算法的多特征检测思想拓展至ACE与AMF算法中, 即MtACE, MtAMF, SumACE, SumAMF, WtaACE和WtaAMF, 开展9种多特征检测算法的检测适应性评估研究。 9种算法的原理如式(5)-式(13)所示。
式中, P为图像中的某个像元, x为波谱图像, xi为波谱图像的某一个像元, D为多特征矩阵, W为滤波器参数, {CEMi(p)
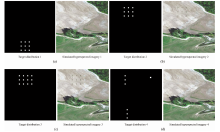
设计了图1所示的4种模拟图像数据, 分别为植被伪装目标嵌入草地背景、 植被伪装目标嵌入土壤背景、 植被及水泥路伪装目标嵌入土壤背景以及植被、 水泥路、 土壤伪装目标分别嵌入草地、 水泥路、 土壤背景4种不同波谱特征分布场景。 模拟所用的真实背景数据共360个波段, 波长范围为413.9~2 452.8 nm, 光谱分辨率为5 nm, 空间分辨率为1 m[14]。
 | 图1 试验场景 (a): 草地背景及植被伪装目标; (b): 土壤背景及植被伪装目标; (c): 土壤背景及植被与水泥路伪装目标; (d): 草地/水泥路/土壤背景及其相应伪装目标Fig.1 Test scenarios (a): Grassland background and vegetation camouflage target; (b): Soil background and vegetation camouflage target; (c): Soil background and vegetation and cement road camouflage targets; (d): Grassland/cement road/soil background and its corresponding camouflage targets |
首先, 设计了表1所示的4种试验方案, 即分别开展目标之间及目标与背景之间波谱相似性大、 目标之间波谱相似性大而目标与背景之间波谱相似性小、 目标之间及目标与背景之间波谱相似性小、 目标之间波谱相似性小而目标与背景之间波谱相似性大等4种条件下的伪装目标检测试验, 获取上述4种场景下9种多特征检测算法的检测结果; 其次, 分别将图1(a)所示的原始数据加入信噪比(signal noise ratio, SNR)为200, 400与800的高斯白噪声, 获取3种信噪比情况下9种多特征检测算法的检测结果; 然后, 对所有检测结果用本文提出的FD模型建模以及检测精度解析; 最后, 通过多种条件下FD参数及检测精度的综合比对分析, 实现综合目标波谱信息、 背景波谱信息、 数据噪声比例等因素的算法适应性评估。
| 表1 试验方案 Table 1 Test scheme |
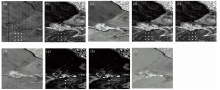
 | 图2 草地背景下植被伪装目标不同算法检测结果 (a): MtACE; (b): MtAMF; (c): MtCEM; (d): SumACE; (e): SumAMF; (f): SumCEM; (g): WtaACE; (h): WtaAMF; (i): WtaCEMFig.2 Detection results of vegetation camouflage targets under grassland background using different algorithms (a): MtACE; (b): MtAMF; (c): MtCEM; (d): SumACE; (e): SumAMF; (f): SumCEM; (g): WtaACE; (h): WtaAMF; (i): WtaCEM |
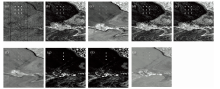
 | 图3 土壤背景下植被伪装目标不同算法检测结果 (a): MtACE; (b): MtAMF; (c): MtCEM; (d): SumACE; (e): SumAMF; (f): SumCEM; (g): WtaACE; (h): WtaAMF; (i): WtaCEMFig.3 Detection results of vegetation camouflage targets under soil background using different algorithms (a): MtACE; (b): MtAMF; (c): MtCEM; (d): SumACE; (e): SumAMF; (f): SumCEM; (g): WtaACE; (h): WtaAMF; (i): WtaCEM |
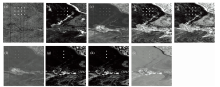
 | 图4 土壤背景下植被及土壤伪装目标不同算法检测结果 (a): MtACE; (b): MtAMF; (c): MtCEM; (d): SumACE; (e): SumAMF; (f): SumCEM; (g): WtaACE; (h): WtaAMF; (i): WtaCEMFig.4 Detection results of vegetation and soil camouflage targets under soil background using different algorithms (a): MtACE; (b): MtAMF; (c): MtCEM; (d): SumACE; (e): SumAMF; (f): SumCEM; (g): WtaACE; (h): WtaAMF; (i): WtaCEM |
 | 图5 草地/水泥路/土壤背景下植被/水泥路/土壤伪装目标不同算法检测结果 (a): MtACE; (b): MtAMF; (c): MtCEM; (d): SumACE; (e): SumAMF; (f): SumCEM; (g): WtaACE; (h): WtaAMF; (i): WtaCEMFig.5 Detection results of vegetation/cement road/soil camouflage targets under grassland/cement road/soil background using different algorithms (a): MtACE; (b): MtAMF; (c): MtCEM; (d): SumACE; (e): SumAMF; (f): SumCEM; (g): WtaACE; (h): WtaAMF; (i): WtaCEM |
| 表2 试验1融合度与精度参数统计 Table 2 FD and accuracy parameter of test 1 |
| 表3 试验2融合度与精度参数统计 Table 3 FD and accuracy parameter of test 2 |
| 表4 试验3融合度与精度参数统计 Table 4 FD and accuracy parameter of test 3 |
| 表5 试验4融合度与精度参数统计 Table 5 FD and accuracy parameter of test 4 |
| 表6 不同信噪比图像检测结果 Table 6 Detection results under different signal-to-noise ratios |
图6、 图7分别展示了九种多特征检测算法对四种试验场景、 三种不同信噪比场景检测结果的融合度分布特征, 检测均值及标准差统计如表7所示。
 | 图6 九种多特征检测算法对四种试验场景的检测结果Fig.6 Detection results of four scenarios by nine multiple features detection algorithms |
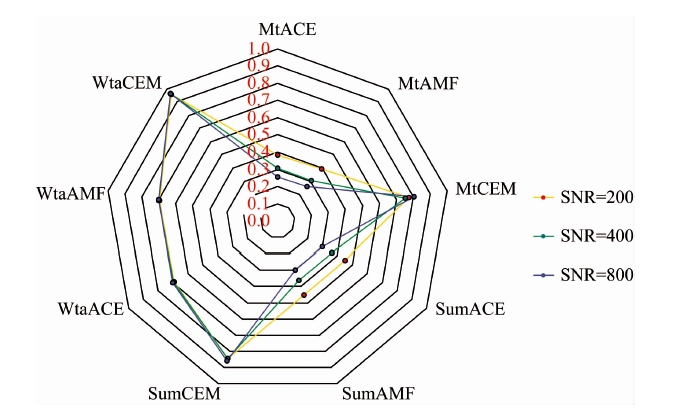 | 图7 九种多特征检测算法对三种不同信噪比场景的检测结果Fig.7 Detection results of three SNR scenarios by nine multiple features detection algorithms |
| 表7 不同场景下多特征检测算法的检测均值及标准差统计 Table 7 Statistics of detection mean and standard deviation of multi-feature detection algorithms in different scenarios |
从图6、 图7以及表7的统计分析结果可以看出, MtCEM以及基于Wta思想的多特征检测算法WtaCEM, WtaACE和WtaAMF在不同级别噪声下的FD参数变化最微弱, 说明该四种算法对于噪声的适应能力较强, 但是其对不同场景下多特征同步检测的精度均较差, 融合度参数也较高, 综合来讲适应性偏低; CEM算法的三种多特征检测版本MtCEM, SumCEM和WtaCEM对波谱信息的变化较为敏感, 对于不同目标及背景波谱分布的场景检测效果较差, 融合度参数偏高, 为适应性最低的前三种算法; MtACE, MtAMF, SumACE和SumAMF四种算法对于不同场景的适应能力强, 对于噪声的敏感性也较低, 为适应性最高的前四种算法。 此外, 从各大算法的检测精度可以看出, CEM的三种多特征检测算法高于WtaACE、 WtaAMF, 但是从检测效果来看, 后者的效果明显更优, 此时本文提出的FD参数则与检测效果的优劣保持一致, 说明了FD模型的正确性。
(1)提出了目标与环境FD模型, 极大提升了弱特征目标检测结果的评价准确性, 可支撑多种场景下的检测算法执行决策。
(2)开展了四种不同波谱分布场景的检测试验, 结果表明在标准差均小于0.08的条件下, 9大算法对于波谱变化的适应能力由强到低排序为: MtACE> MtAMF> SumACE=SumAMF> WtaACE=WtaAMF> MtCEM> SumCEM> WtaCEM。
(3)对波谱数据加入不同级别噪声, 检测结果表明在标准差均小于0.07的条件下, 9大算法对于噪声的适应能力由强到低排序为: MtACE> MtAMF> SumACE=SumAMF> WtaACE=WtaAMF> MtCEM> SumCEM> WtaCEM。
(4)综合不同试验场景及不同级别噪声条件下的检测结果, MtCEM, SumCEM和WtaCEM三种算法对于多特征检测的准确度以及自身泛化能力均较差, WtaACE和WtaAMF算法对于多种特征的检测不全面, 往往突出某一类特征而丢失其他大部分特征, 因此, 复杂场景下离散分布的多特征检测, 建议考虑算法的优先级顺序为MtACE> MtAMF> SumACE=SumAMF。
| [1] |
|
| [2] |
|
| [3] |
|
| [4] |
|
| [5] |
|
| [6] |
|
| [7] |
|
| [8] |
|
| [9] |
|
| [10] |
|
| [11] |
|
| [12] |
|
| [13] |
|
| [14] |
|