
近红外光谱的海水微塑料快速识别
[吴雪1, 2  , 冯巍巍
, 冯巍巍2, 3, 4, * , 蔡宗岐2, 3 , 王清2, 3 ]
, 冯巍巍, 蔡宗岐|
|


作者简介: 吴 雪, 1995年生, 哈尔滨工业大学(威海)与中国科学院烟台海岸带研究所联合培养硕士研究生 e-mail: 20S030091@stu.hit.edu.cn
光谱技术与机器学习算法结合快速识别微塑料, 为微塑料的现场检测提供了极大的技术支持, 是一个得到极大关注的新领域。 近红外光谱检测技术具有检测速度快、 灵敏度高、 不损坏样品, 且可以在不对样品进行预处理的情况下直接检测等特点, 在化学分析、 质量检测等领域广泛应用。 本文基于近红外光谱检测技术, 研究比较了结合Support Vector Machine(SVM)和Extreme Gradient Boosting(XGBoost)两种机器学习分类算法, 构建微塑料的高速有效识别分类模型。 采用微型近红外光谱仪采集了20种常见的微塑料标准样品的光谱数据, 为了防止过拟合, 对每种样品多次采样, 共收集了1 260个微塑料样本, 每个样本包含512个数据点。 利用XGBoost算法进行特征重要性排序, 共提取了对识别准确率影响较大的65个数据点。 分别采用SVM算法和XGBoost算法对数据降维后提取的65个数据点建立微塑料快速识别模型, 并运用网格搜索(GridSearchCV)对XGBoost算法影响较大的超参数进行选取, 确定n_estimators, learning_rate, min_child_weigh, max_depth, gamma的最佳超参数分别为700, 0.07, 1, 1, 0.0。 为了提高模型的稳定性, 识别速率和泛化能力, 对模型采用10折交叉验证和混淆矩阵评估; 研究结果表明, XGBoost模型对微塑料的识别准确率为97%, 而SVM模型对微塑料的识别准确率为95%; XGBoost模型对微塑料识别的正确率优于SVM模型。 综上所述, XGBoost模型微塑料识别整体性能优于SVM模型, 为实际微塑料快速识别提供技术支撑。
The combination of spectroscopic technology and machine learning algorithm for rapid identification of microplastics provides great technical support for microplastics' field detection, a new field that has attracted great attention. Nirs detection technology has the characteristics of fast detection speediness, highly sensitization, damage less, and can be directly detected without sample pretreatment, widely used in chemical analysis quality detection and other fields.This paper compares support vector machine (SVM) and Extreme Gradient Boosting (XGBoost), two machine learning classification algorithms based on the infrared spectrum, to build a classification model for high-speed and effective recognition of microplastics. Acrylonitrile butadiene styrene(ABS), Polyacrylonitrile (PAN), Polycarbonate (PC), Polyethylene glycol terephthalate(PET), Polymethyl methacrylate (PMMA), Polypropylene (PP), Polystyrene(PS), Polyvinyl chloride (PVC), Thermoplastic polyurethane (TPU), Ethylene-vinyl acetate copolymer (EVA), Polybutylene terephthalate (PBT), Polycaprolactone (PCL), Polyethersulfone (PES), Polylactic acid (PLA), Polyoxymethylene (POM), Polyphenylene Oxide (PPO), Polyphenylene sulfide (PPS), Poly tetra fluoroethylene (PTFE), polyvinyl alcohol (PVA), Styrenic Block Copolymers(SBS)20 standard samples of microplastics were collected by using A miniature near-infrared spectrum. In order to prevent overfitting, 1 260 microplastic samples were collected, each sample containing 512 data points. The XGBoost algorithm was used to rank the importance of the logarithmic data points, and a total of 65 data points which greatly influenced the recognition accuracy were extracted. SVM algorithm and XGBoost algorithm are respectively used to establish a microplastic fast recognition model for 65 data points extracted after dimensionality reduction, and GridSearchCV is used to select the hyperparameters that have a great influence on XGBoost algorithm to determine n_estimators, learning_rate, The optimal hyperparameters for min_child_weigh, max_depth, and gamma are 700, 0.07, 1,1, 0.0, respectively. In order to improve the model's stability, recognition rate and generalization ability, a 10-fold cross-validation and confusion matrix were used to evaluate the model. The results show that the recognition accuracy of the XGBoost model is 97%, while that of the SVM model is 95%. The accuracy of the XGBoost model is better than the SVM model. In conclusion, the overall performance of the XGBoost model was better than that of the SVM model, which provides technical support for rapid identification of actual microplastics.
塑料制品在日常生活中随处可见, 迄今为止全球生产的83亿吨塑料中, 有10%以塑料碎片的形式积累在海洋和淡水系统中, 使塑料污染成为快速增长的环境问题[1]。 塑料经过降解, 变为微塑料, 微塑料可能作为吸附污染物、 病毒等的载体对人类和其他生命形式具有潜在的危害。 为了研究微塑料在环境中的运输过程以及对环境的污染情况, 在现场对微塑料进行识别检测是非常有必要的[2]。
现阶段, 微塑料的识别检测方法大部分为目视法, 光谱法和热分析法[3], 然而目视法具有很大的主观性, 热分析法在检测过程容易损坏样品, 光谱法包括拉曼光谱法和近红外吸收光谱法, 拉曼光谱不仅需要大量的数据预处理[4], 而且由于荧光作用的影响, 需要对样品进行前处理[5]。 近红外光谱检测技术利用近红外吸收带探测聚合物官能团的拉伸和弯曲模式, 通过微塑料独特的化学成分和成键模式识别微塑料[2]。 机器学习算法在数据处理方面表现出强大的性能, 利用机器学习算法与近红外光谱结合, 可以实现现场实时快速检测, 具有快速, 高效, 无损等特点。
采用近红外光谱检测结合XGBoost机器学习分类算法可快速识别海水中的微塑料, 不仅操作简单, 适用范围广, 而且携带方便, 可以实现现场实时快速检测[6]。
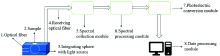
近红外光谱检测系统由照明系统、 分光系统以及接收系统组成, 图1为微型近红外光谱检测系统结构示意图。 首先利用带光源的积分球测得未放置样品时的光通量, 然后放置样品进行测量; 测得的样品光谱数据通过接收光纤经光谱收集模块和光谱处理模块进行处理, 处理后的光谱数据经光电转换模块进行光电转换后进入数据处理模块进行数据处理。
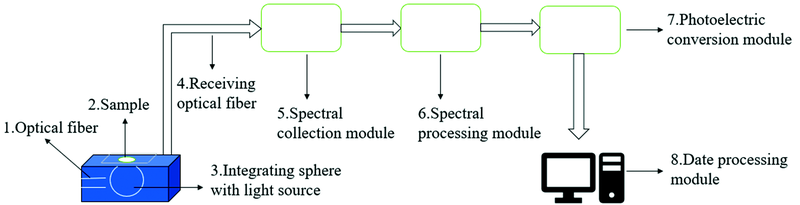 | 图1 近红外光谱检测系统 1: 光纤; 2: 样品; 3: 带光源的积分球; 4: 接收光纤; 5: 光谱收集模块; 6: 光谱处理模块; 7: 光电转化模块; 8: 数据处理模块Fig.1 Near Infrared microplastic measuring system 1: Optical fiber; 2: Sample; 3: Integrating sphere with light source; 4: Receiving optical fiber; 5: Spectral collection module; 6: Spectral processing module; 7: Photoelectric conversion module; 8: Date processing module |
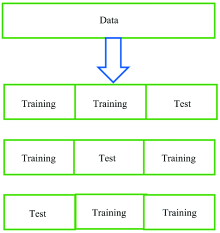
 | 图2 K折交叉验证结构示意图Fig.2 K-fold cross-validation structure |
K折交叉验证将原始数据集划分为相等的K份(“ 折” ), 选取其中的一份作为测试集, 其他部分作为训练集, 重复K次, 通过训练集来计算模型的准确率, 取平均准确率为模型的最终准确率[4]。 其中10折交叉验证不仅能准确描述模型的泛化能力, 而且具有较好的稳定性和识别速率[7]。 本工作采用10折交叉验证。
混淆矩阵(confusion matrix)又称误差矩阵, 一种特定的矩阵呈现算法性能的可视化效果, 每一列代表预测值, 每一行代表实际的类别, 混淆矩阵能够全面的反映模型的性能[8]。
1.3.1 数据降维
原始的近红外光谱在900~1 750 nm范围内具有512个数据波段, 不同的近红外光谱数据波段对模型识别的准确率的重要性程度不同, XGBoost算法属于集成算法, 在特征考虑方面相对全面。 因此利用XGBoost算法对近红外光谱数据波段的重要性程度进行评估, 筛选出重要性程度高的特征波段, 达到提高模型识别准确率和速度的目的[9]。
1.3.2 SVM, XGBoost模型的构建
支持向量机算法利用超平面分离数据点, 通过最大化超平面到两个子类中两个最近数据点的距离(即边距m)[10], 达到分类的目的。
XGBoost是一种基于树的集成算法, 内部决策树采用回归树[11], 该算法已被证明是一种可靠、 高效的机器学习问题解决器[12]。 XGBoost算法不断通过误差添加回归树进行拟合, 然后把这些回归树进行集成划分进行分类。
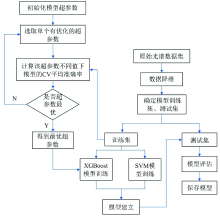
图3为XGBoost算法和SVM算法识别微塑料模型建立的流程, 数据集输入后利用XGBoost算法进行特征提取, 然后进行重组, 将预处理后的数据集分为测试集和训练集两部分, 利用SVM算法和XGBoost算法对训练集进行学习建模[13], 利用测试集评估模型的整体性能。
 | 图3 XGBoost和SVM算法识别微塑料Fig.3 XGBoost and SVM for microplastic detection |
1.3.3 模型参数的选择
XGBoost包含较多的超参数, 目前对超参数的调整选择并没有明确的规则[11], 本文运用网格搜索(GridSearchCV)对模型影响较大的超参数n_estimators即迭代次数、 learning_rate即学习率、 min_child_weigh即最小的叶子节点权重、 max_depth即树的最大深度、 gamma即叶子节点分裂时所需要的最小的损失减小量进行选取。
GridSearchCV不仅可以遍历每一种参数的可能性, 找到最佳参数, 而且可以利用交叉验证有效的避免偶然性[14]。
采用微型近红外光谱仪对丙烯腈、 丁二烯、 苯乙烯的三元共聚物(acrylonitrile butadiene styrene, ABS), 聚丙烯腈(polyacrylonitrile, PAN), 聚碳酸酯(polycarbonate, PC), 聚对苯二甲酸乙二醇酯(polyethylene glycol terephthalate, PET), 聚甲基丙烯酸甲酯(polymethyl methacrylate, PMMA), 聚丙烯(polypropylene, PP), 聚苯乙烯(polystyrene, PS), 聚氯乙烯(polyvinyl chloride, PVC), 热塑性聚氨酯(thermoplastic polyurethane, TPU), 乙烯-醋酸乙烯酯共聚物(ethylene-vinyl acetate copolymer, EVA), 聚对苯二甲酸丁二醇酯(polybutylene terephthalate, PBT), 聚己内酯(polycaprolactone, PCL), 聚醚砜(polyethersulfone, PES), 聚乳酸(polylactic acid, PLA), 聚甲醛(polyoxymethylene, POM), 聚苯醚(polyphenylene oxide, PPO), 聚苯硫醚(polyphenylene sulfide, PPS), 聚四氟乙烯(poly tetra fluoro-ethylene, PTFE), 聚乙烯醇(polyvinyl alcohol, PVA), 苯乙烯-丁二烯-苯乙烯嵌段共聚物(styrenic block copolymers, SBS)20种常见的微塑料样品采集近红外光谱数据。 选取900~1 750 nm近红外光谱波段, 可准确地检测出PC, PET, PS, TPU, PBT, PES, PPO, PPS和SBS的苯环吸收振动峰以及PC, PET, PMMA, TPU, EVA, PBT, PCL和PLA的酮羰基吸收振动峰。 积分时间150 ms, 对20种微塑料测取了1 260个样本数据。 每种微塑料样品的部分近红外光谱图如图4所示。
 | 图4 微塑料样品原始近红外光谱Fig.4 Original Near Infrared spectra of microplastics |
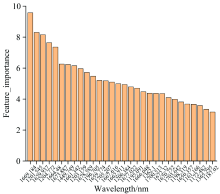
利用XGBoost算法对近红外光谱512个特征波段的重要性进行评估, 筛选出了重要性程度高的65个特征波段[4], 对数据进行降维, 图5为XGBoost筛选出的重要性程度位于前30的数据点。
 | 图5 重要程度位于前30的光谱变量Fig.5 The 30 most important spectral variables |
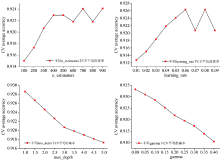
运用GridSearchCV对n_estimators, learning_rate, gamma分别在100~900, 0.01~0.09, 0.00~0.40中网格搜索选取最佳超参数, 其中min_child_weigh和max_depth一起调参, 在1, 3, 5中进行最佳超参数选择。 如图6所示, 确定n_estimators取700, learning_rate取0.07, min_child_weigh=1和max_depth=1, gamma取0.0为最佳超参数。
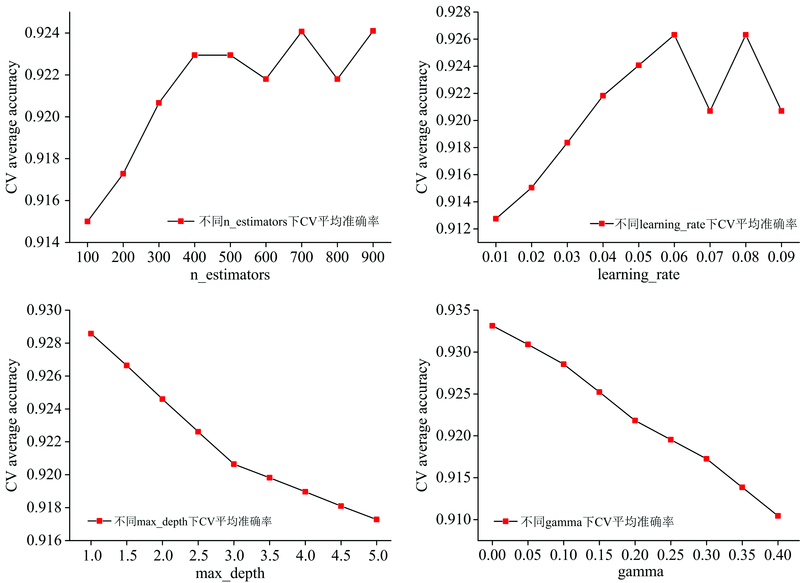 | 图6 不同n_estimators, leasning_rate, max_depth, gamma下CV平均准确率Fig.6 CV average accuracy of n_estimators, learning_rate, max_depth, gamma |
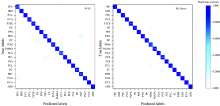
使用已进行降维操作后的测试集样本对已建立的SVM和XGBoost模型进行评估。 由图7的SVM混淆矩阵可以看出, SVM模型对11种微塑料的识别准确率达到100%, 有4种微塑料的识别准确率达到90%以上, 有4种微塑料的识别准确率达到80%以上, 1种微塑料的识别准确率为76%。 由图7的XGBoost混淆矩阵可以看出, XGBoost模型对15种微塑料的识别准确率达到100%, 识别准确率达到90%以上的有3种, 2种微塑料的识别准确率达到83%以上。
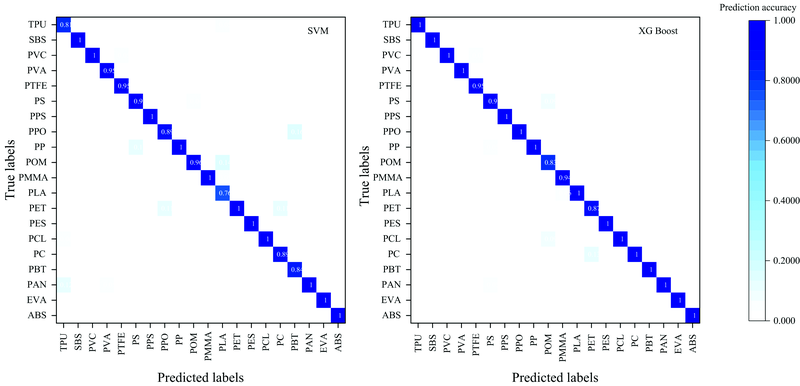 | 图7 SVM和XGBoost混淆矩阵Fig.7 SVM and XGBoost confusion matrixes |
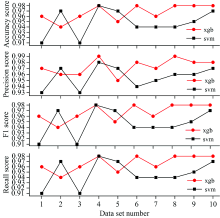
由表1和图8可以看出, 在同等条件下, XGBoost模型的识别准确率为97%, 而SVM模型的识别准确率为95%; 且XGBoost模型的Accuracy score, Precision score, Recall和F1-score的平均准确率均高于SVM模型。 综上所述, SVM模型的整体性能低于XGBoost模型。
| 表1 XGBoost和SVM算法运行结果对比 Table 1 Comparison of operation results between XGBoost and SVM algorithms |
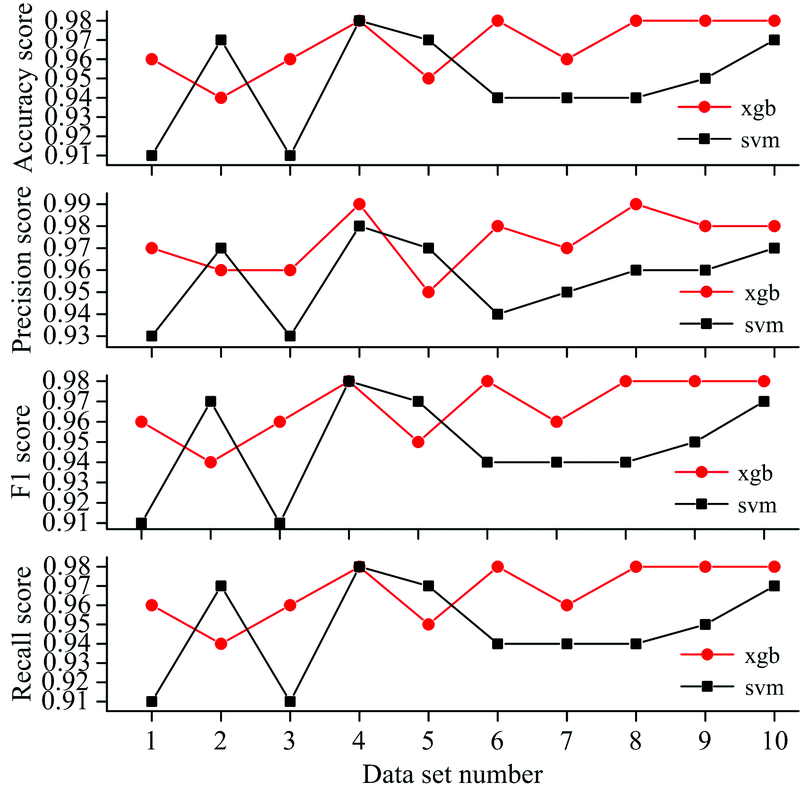 | 图8 XGBoost和SVM10折交叉验证下准确率, 精准率, 召回率, F值Fig.8 Accuracy score, precision score, recall and F1-score of 10-fold cross validations of XGBoost and SVM |
微塑料可能作为吸附污染物、 病毒等的载体对人类和其他生命形式具有潜在的危害, 为了研究微塑料在环境中的运输过程以及对环境的污染情况, 在现场对微塑料进行识别检测是非常有必要的。 通过近红外光谱检测系统测得环境中常见的20种微塑料标准样品的光谱数据, 利用XGBoost特征重要性排序, 提取65个光谱数据点, 对数据降维。 运用GridSearchCV对影响XGBoost模型较大的超参数进行选取, 确定n_estimators, learning_rate, min_child_weigh, max_depth, gamma的最佳超参数分别为700, 0.07, 1, 1, 0.0。 对XGBoost模型和SVM模型进行10折交叉验证评估和混淆矩阵评估, 确定XGBoost模型、 SVM模型对20种微塑料的识别准确率分别为97%和95%; 通过混淆矩阵可以看出XGBoost模型对微塑料识别的准确率优于SVM模型。 综上所述, XGBoost模型微塑料识别整体性能优于SVM模型, 为实际微塑料快速识别提供技术支撑。
| [1] |
|
| [2] |
|
| [3] |
|
| [4] |
|
| [5] |
|
| [6] |
|
| [7] |
|
| [8] |
|
| [9] |
|
| [10] |
|
| [11] |
|
| [12] |
|
| [13] |
|
| [14] |
|