


利用单油包裹体的显微荧光和红外光光谱联合识别原油的气洗和水洗作用
[苏奥1  , 李培军
, 李培军2, * , 雷明珠3 , 刘强4 , 张鑫5 ]
, 李培军, 雷明珠|
|


采集已报道具有规模气洗作用和水洗作用的油气田岩样制成流体包裹体薄片, 进行单油包裹体的显微荧光光谱和傅里叶红外光光谱测试, 分别研究了遭受气洗作用和水洗作用后捕获的油包裹体的显微荧光和红外光光谱的变化规律特征, 总结了两者的变化差异性。 气洗导致原油光谱参数QF535值向减值和增值方向分别扩大, CH2/CH3分布值范围未发生明显扩大, 而峰值被平均化, H2O/Alkanes比值分布无变化。 水洗导致原油的QF535值向增值方向扩大, CH2/CH3分布范围发生了明显的增移, H2O/Alkanes明显增加。 针对轻质油藏气洗后QF535变化不明显以及中重质油藏水洗后CH2/CH3变化不明显的特点, 首次总结出针对轻质油藏和中重质油藏的水洗和气洗作用的油包裹体光谱参数分布趋势鉴别图版。 该研究对利用流体包裹体进行成藏期次精细划分和油气成藏过程恢复具有重要实际意义。
Biography: SU Ao, (1989—), Lecturer at Yangtze University e-mail: suao446@163.com
Samples in the two oil fields with reported gas-washing and water-washing were collected for fluid inclusion analysis. Micro-fluorescence and Fourier infrared spectra of single oil inclusions were measured to study the different effects of gas-washing and water-washing on oil compositions. The results show that spectral parameter QF535 values of the oils altered by gas-washing were expanded toward decreasing and increasing, respectively. The CH2/CH3 distribution range ratio does not expand significantly, but the peak values are averaged. And the distribution of H2O/Alkanes has no change. The QF535 values of the oils affected by water-washing increased towards the increase direction, and the distribution ranges of both CH2/CH3 and H2O/Alkanes increase significantly. The changes of QF535 in light oil reservoirs altered by gas-washing and CH2/CH3 in heavy oil reservoirs by water-washing are not obvious. Therefore, two spectral parameter distribution trend charts of light and heavy oil reservoirs are summarized to discriminate the gas-washing and water-washing processes. This study is of great practical significance to utilize fluid inclusion analysis to restructure stages and processes of petroleum accumulation.
Micro-fluorescence spectroscopy (UV) and Fourier transform infrared spectroscopy (FTIR), as in-situ nondestructive detection techniques have been widely used to determine stages of hydrocarbon accumulation in sedimentary basins[1, 2, 3, 4]. The fluorescence spectra parameters of single oil inclusion include maximum main peak wavelength (λ max), red-green entropy (Q650/500) and QF535. The infrared spectra can be used to calculate the CH2/CH3 ratio. These parameters can assess hydrocarbon maturity, thereby identifying different generations of hydrocarbon fluids.
In some sedimentary basins, there is only one episode of hydrocarbon charge. Subsequently, these hydrocarbons are also subjected to secondary alterations such as water-washing, gas-washing, thermal cracking, microbial oxidation, and capture fractionation, which results in an obvious change of hydrocarbon components[7, 8]. Therefore, the diversity of micro-fluorescence and infrared spectra easily leads to the wrong conclusion of multi-stage hydrocarbon charging. It is difficult to distinguish whether the reservoir has been affected by water-washing or gas-washing, as both can result in asphalt precipitation. At present, there is little report on the spectral identification of the two secondary alterations in China.
This study collected some oil samples from two oil fields that have undergone gas-washing and water-washing to measure their fluorescence and infrared spectra. Differences in spectral characteristics can be utilized to distinguish the two types of secondary processes. It can also help explain why multiple fluorescent colors of oil inclusions may not directly correspond to multi-stage hydrocarbon charge. It is of great significance to the reconstruction of the evolution history of petroleum systems.
The Xihu Sag in the East China Sea Basin is rich in natural gas and condensate resources. Previous geological and geochemical studies have confirmed that large-scale gas washing and component fractionation have occurred in this area. Gas washing resulted in the development of oil inclusions with multiple fluorescences in the area. Based on the history of hydrocarbon generation and expulsion, it can be concluded that a large number of blue-green fluorescent oil inclusions contain mature oils that have not been secondarily altered. Therefore, the oil inclusions with other fluorescent colors should have recorded the oils suffering from gas washing.
The location of paleo oil-water contact was obtained using the Grains containing Oil Inclusions (GOITM) technique where as the well-logging curves determined the present-day oil-water contact in the Dongying Sag. It was found that the oil reservoir has been adjusted. Therefore the oil-water contact has changed and moves upward about 60 m. It means that the formation waters have entered the residual paleo oil zone, and the water-washing has also occurred. The oil inclusions in rock samples above the present oil-water interface were selected as the captured oil inclusions without being washed, and the oil inclusions in rock samples below the present oil-water interface to above the ancient oil-water interface were selected as the captured oil inclusions after being washed.
1.2.1 Micro-fluorescence spectrum
Crude oil contains unsaturated hydrocarbon compounds and therefore can emit fluorescence wavelength due to π electron transition under ultraviolet light irradiation. The fluorescence spectrum (UV-visible absorption spectrum) can be recorded by a spectrometer, which can semi-quantitatively evaluate oil components[9].
In this study, hydrocarbon inclusions were observed using a Nikon 80I dual-channel fluorescence microscope, with an ultraviolet excitation wavelength of 330~380 nm. Maya 2000 Pro spectrometer was used to record the fluorescence spectrum. Finally, the Yuanao micro-spectral analysis system was used to process the spectral data. Some results are shown in Table 1.
| Table 1 Fluorescence and infrared spectral parameters of single oil inclusions |
1.2.2 Fourier transform infrared spectrum
The relationship between fluorescence spectral parameters and thermal maturity of hydrocarbon exists controversial. Moreover, fluorescence characteristics (color, wavelength, and spectral parameters) can not be correlated with the complex chemical structures of oil. After fluorescence spectrum measurement, the fluid inclusion thin section was immersed in acetone to remove the glue.
Generally, oil maturity correlates with the spectral wavelength λ max, QF535 and CIE-XY of fluorescence spectrum. If the oil maturity is high, the fluorescence wavelength can shift from blue, white, yellow to orange. Both QF535 and CIE-XY values will increase[10, 11].
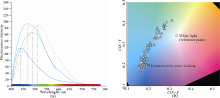
According to the results (Table 1 and Fig.1), gas-liquid two-phase oil inclusions with various fluorescence colors (bright blue, blue-green and yellow-white) occur in the reservoirs of the Xihu Sag, East China Sea Basin. The main peak wavelength λ max in the corresponding fluorescence spectrum is about 460, 490 and 515 nm, and the QF535 has a wide distribution ranging from 0.3 to 1.78. In addition to the maximum main peak, suggesting the heterogeneity of incmusion oil components. Human observation error can be eliminated by CIE-XY chromatogram, which therefore depicts accurate fluorescence color of oil inclusions. As shown in Fig.1, it can be found that from that the fluorescence color of oil inclusions displays a dispersive distribution, ranging from blue, white, to yellow white, while both bubble size and color of oil inclusions do not covary.
 | Fig.1 Fluorescence spectra and CIE chromaticity of oil inclusions in reservoirs altered by gas-washing |
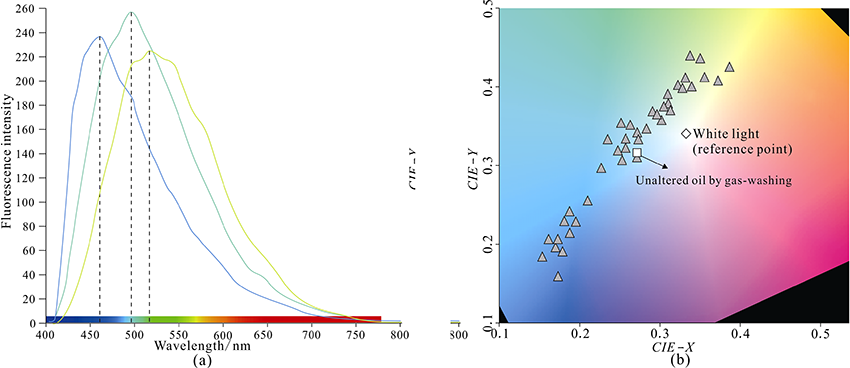
Table 1 and Fig.2 show that the wide fluorescence color range of oil inclusions is also observed in the reservoirs of the Dongying Depression. There are four types of maximum main peak wavelength (λ max) in the fluorescence spectrum, including 440, 475, 490 and 520 nm. The corresponding CIE-XY chromaticity diagram also shows that the fluorescence color of oil inclusions vary from blue white, white to yellow. The yellow fluorescent oil inclusions have small bubbles, with a wide QF535 ranging from 0.22 to 1.8.
 | Fig.2 Fluorescence spectra and CIE chromaticity of oil inclusions in reservoirs altered by water-washing |
Overall, from the perspective of fluorescence color alone, both water-washing and gas-washing can lead to various fluorescence colors of oil inclusions. Hence it is difficult to distinguish the two types of secondary alteration processes.
FTIR spectra of hydrocarbon inclusions show an obvious stretching vibration in the absorption peak position of 2 800~3 000 cm-1 that indicates the aliphatic structure of the organic compounds in the inclusions[9]. This peak segment generally includes four types: CH3 and CH2 asymmetric stretching vibrations and CH3 and CH2 symmetric stretching vibrations. The intensity ratio of CH2/CH3 absorption peak can represent the chaio length of alkanes and thus is used to evaluate the thermal maturity of organic matter. Generally, a negative correlation between CH2/CH3 ratio and thermal maturity occurs. In addition, the absorption peak position of 3 700~3 200 cm-1 represents the existence of H2O, hence H2O/Alkanes (water/oil ratio) can be used to evaluate the relative abundance of water and oil within the inclusions.
As shown in Fig.3(a), the infrared spectrum pattern of trapped oils suffering from gas washing shows an obvious alteration of the relative peak intensity of CH3 and CH2, whereas the absorption peak intensity of water has not changed significantly. The infrared spectra of trapped oils that underwent water-washing are also different [Fig.3(b)]. Besides, the relative peak intensity of CH3 and CH2, the absorption peak intensity of water increases obviously. Overall, the CH2/CH3 and H2O/Alkanes of the oil inclusions changed before and after gas-washing and water-washing.
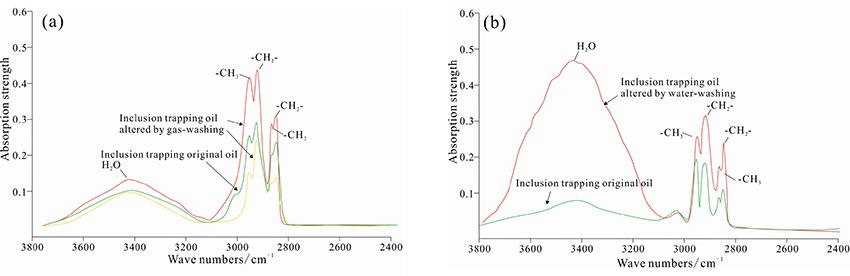 | Fig.3 (a) Fourier infrared spectra of inclusion trapping oil altered by gas-washing; (b) Fourier infrared spectra of inclusion trapping oil altered by water-washing |
Gas-washing refers to the geological process in which external natural gas or condensate enters the oil reservoirs and then interacts with oils, leading to oil compositions[12]. The fluorescence characteristics of oil inclusions can be related to gas-washing fractionation in the Xihu Sag of the East China Sea Basin. The original oils have been recorded by the blue-white fluorescent oil inclusions, with the main peak wavelength of 490 nm. Due to the effect of later gas-washing, the short-chain alkanes in the original oils were gasified into the natural gas while the residual oils are rich in heavy components because of the loss of light components. As a result, the fluorescence λ max of residual oils is gradually shifted to about 515 nm (Fig.1). The light hydrocarbon components are mixed with natural gas, forming gas condensate. It leads to a blue shift of fluorescence color relative to the original oils. The corresponding λ max is altered into about 460 nm. Therefore, the fluorescent color of oil inclusions in the CIE chromaticity diagram appears a gradual distribution.
The fluorescence spectral parameters of oil inclusions also change concerning the oils before gas-washing. Based on the histograms of fluorescence and infrared spectral parameters (Fig.4), it can be found that the QF535 range of oils altered by gas-washing expand toward decrease and increase directions, reflecting a component fractionation related to gas-washing. In addition, the histogram distribution of CH2/CH3 ratio of oils that suffered from gas-washing has been altered to some extent. The distribution range of CH2/CH3 was not significantly expanded while the difference of histogram peaks becomes small.
 | Fig.4 Histogram of spectral parameters QF-535, CH2/CH3, and H2O/Alkanes for inclusions trapping oil altered by gas-washing and original oil |
Water-washing is a process in which reservoir oils are washed by formation waters and thus causes the change of oil composition. In fact, water washing is a common phenomenon and mainly occurs near the oil-water contact. Because of physical adjustment or chemical modification of the oil reservoirs, the oil-water contact surface often changes. The present oil-water contact location can be obtained by well-logging, but the paleo oil-water contact is not easy to identify. When the fluid inclusion technology is used to analyze the reservoir filling stages, it is easy to ignore this type of secondary alteration. Therefore, various fluorescent oil inclusions may be considered as the result of multi-stage charge.
Some scholars observed that the effect of water-washing on oil mainly lies in the dissolution of methane, small molecular n-alkanes and small molecular aromatic compounds in crude oil into waters, while medium to large molecular compounds is almost unaffected[13, 14]. In other words, water-washing causes a loss of light end and an enrichment of heavy components in residual oils, resulting in the shift of fluorescence color toward the red region. The local formation waters enter into the paleo oil zone and interact with the oils. The oil components were gradually changed, resulting in oil inclusions with multiple main peak wavelengths of fluorescence spectra. Moreover, the fluorescence color in the CIE chromaticity diagram also showed a gradual change. In Fig.5, it can be seen that the distribution range of microscopic fluorescence spectrum parameter QF535 of oil altered by water-washing expands to the increasing direction, which indicates a gradual enrichment of heavy components. It can also be observed that the two types of oils altered by water-washing and gas-washing show an different change trend of CH2/CH3. The distribution range of CH2/CH3 of oils altered by water-washing increases obviously, which may be because water-washing leads to a more strong enrichment in the large molecular chain hydrocarbons. The H2O/alkanes ratios in the inclusions that contain oils altered by water-washing determined by infrared spectroscopy are significantly higher than those of the unaltered oils. The formation waters are displaced during hydrocarbon filling, but a small amount of water remains at the capillary ends among the grain pores. Hence, sometimes the trapped oil inclusions may contain a small number of water. If the oil is subject to large-scale water-washing, the water content of the trapped oil inclusions may increase. Also, the H2O/alkanes ratio would be elevated significantly.
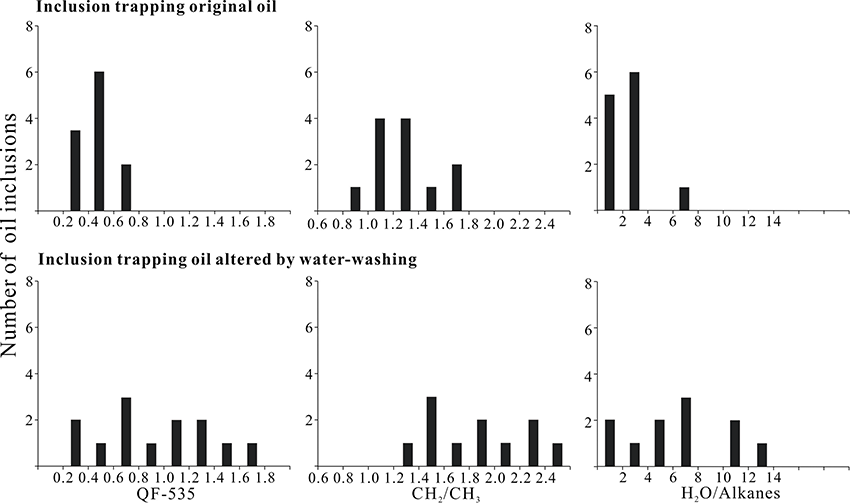 | Fig.5 Histogram of spectral parameters QF-535, CH2/CH3 and H2O/Alkanes for inclusions trapping oil altered by water-washing and original oil |
Regardless of water-washing or gas-washing, the fluorescence color of the oil inclusions trapped in the reservoirs is various, with a wide distribution range. Therefore, it is difficult to distinguish the two alteration types of the oils accurately. However, based on the characteristics of fluorescence and infrared spectra of single oil inclusions in the oil reservoirs that experienced gas-washing and water-washing, the two different change trends mentioned above can be used to identify them.
(1) Distribution trend of fluorescence spectral parameter QF535
Compared with the unaltered oils, the minimum and maximum fluorescence spectral QF535 values of those altered by gas-washing decrease and increase, respectively. Hence, they have a wider QF535 distribution. The QF535 values of water-washing-altered oils also have a broader range, but almost all of them change toward increased direction. However, it should be noted that due to large amounts of light hydrocarbon components in the light oil reservoirs, the fluorescence color of evaporated oils caused by gas-washing hardly has an obvious blue shift.
(2) Distribution trend of infrared spectral parameter CH2/CH3
The distribution range of CH2/CH3 histogram of oils altered by gas-washing does not expand significantly, but its peak value is averaged. However, the distribution range of CH2/CH3 histogram of those altered by water-washing obviously increases. For heavy reservoirs, however, the heavy oil itself contains less light hydrocarbon components. Therefore oil compositions may not change much after water-washing. It is difficult to distinguish by the CH2/CH3 ratio.
(3) Infrared spectral parameters H2O/Alkanes
Due to the involvement of waters, the H2O/Alkanes distribution of inclusion oils altered by water-washing increases significantly, while that of the oils altered by gas-washing has no obvious change.
To sum up, the variation characteristics of the spectra of oils altered by gas-washing and waters-washing can be summarized as the two charts to distinguish them (Fig.6).
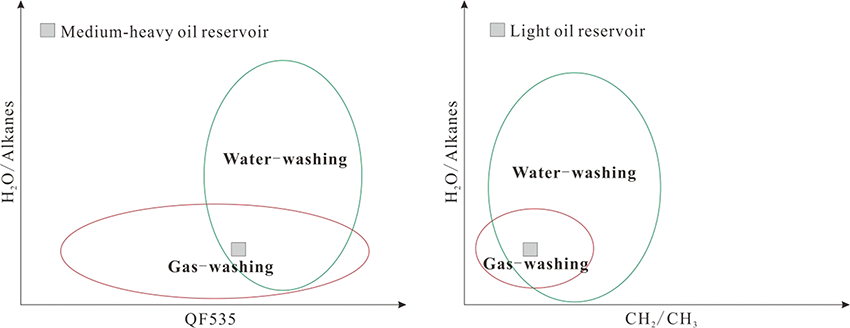 | Fig.6 Two spectral parameter distribution trend pattern diagrams to identify oil reservoirs subjected to water-washing and gas-washing |
If the paleo-oil reservoir is a medium-heavy oil reservoir in this area, a combination of QF535 and H2O/Alkanes can effectively distinguish between these two secondary alterations. The QF535 value of oil altered by gas-washing increases obviously, whereas the H2O/Alkanes ratio exhibits little change. Thus, the datasets (QF535 and H2O/Alkanes) show a flat ellipsoid distribution in the chart. After water-washing, the QF535 value of oil would expand toward the increasing area while H2O/Alkanes ratio is significantly elevated. Their datasets would show a spherical distribution in the chart.
If the paleo-oil reservoir is a light oil reservoir in this area, the combination of spectral parameters CH2/CH3 and H2O/alkanes in single oil inclusions is effective. Both CH2/CH3 and H2O/alkanes ratios of the oils altered by gas-washing have no distinct changes, while those of the oils altered by water-washing increase significantly. The completely different distribution trend leads to a good identification effect for the two secondary processes.
When the oil reservoirs suffer from gas-washing or water-washing, the fluorescence colors of the trapped oil inclusions are often diverse and widely distributed. Observed multiple fluorescent colors are likely explained as multi-stage oil-gas filling. The fluorescence and infrared spectra of the single oil inclusions are combined to study the effect of gas-washing and water-washing on spectral parameters. Gas-washing gives rise to the QF535 expansion in the direction of decrease and increases, respectively. The distribution range of CH2/CH3 is not significantly expanded but the peak becomes average. Moreover, H2O/Alkanes has no obvious change. Water washing leads to QF535 expansion in the direction of increase. Furthermore, both CH2/CH3 and H2O/Alkanes increase significantly. These features are summarized as the identification charts of gas-washing and water-washing processes.
| [1] |
|
| [2] |
|
| [3] |
|
| [4] |
|
| [5] |
|
| [6] |
|
| [7] |
|
| [8] |
|
| [9] |
|
| [10] |
|
| [11] |
|
| [12] |
|
| [13] |
|
| [14] |
|