

Synthesis and Structural Characterizations of Ternary Iron(Ⅱ) Mixed Ligand Complex: Low Cost Materialsas a Precursor for Preparation of Nanometric Fe2O3 Oxide
引用本文
Khaled Althubeiti. Synthesis and Structural Characterizations of Ternary Iron(Ⅱ) Mixed Ligand Complex: Low Cost Materialsas a Precursor for Preparation of Nanometric Fe2O3 Oxide [J]. Spectroscopy and Spectral Analysis, 2021,41(6): 1988-1992.
Doi:10.3964/j.issn.1000-0593(2021)06-1988-05
Permissions
Doi:10.3964/j.issn.1000-0593(2021)06-1988-05
Copyright©2021, 《光谱学与光谱分析》期刊社
《光谱学与光谱分析》期刊社 所有
Synthesis and Structural Characterizations of Ternary Iron(Ⅱ) Mixed Ligand Complex: Low Cost Materialsas a Precursor for Preparation of Nanometric Fe2O3 Oxide
e-mail: k.althubeiti@tu.edu.sa; Km5599@hotmail.com
Abstract
The reaction of the ligands, ethylenediaminetetraacetic acid terasodium salt (Na4EDTA) and N—N heterocyclic diamines like2,2’-bipyridine (bipy) with iron(Ⅱ) sulfate with 1∶2∶2 stoichiometric ratios form the mononuclear ternary complex of formulae, [Fe2(EDTA)(bipy)2] at pH~7. The FTIR and Raman laser spectra of the iron(Ⅱ) complex show that 2,2’-bipyridine is present asa bidentate ligand and the ethylenediaminetetraacetic acid terasodium salt as monodentate carboxylate anion. The electronic spectra and magnetic moments data suggest the six coordination number. It has two iron(Ⅱ) centers in octahedral environments, which are interlinked by carboxylato-O atoms of ethylenediaminetetraacetate and by nitrogen atoms of the two 2,2-bipyridine ligands in a chelating mode. Thermal analysis study show thatiron(Ⅱ) complex containing EDTA and 2,2’-bipyridine on its thermalde composition form the corresponding Fe2O3 oxide in nano size at the temperature range ~475 ℃. The iron(Ⅱ) complex was performed as a convenient low cost precursor for the preparation of Fe2O3 nanoparticles by the the thermal decomposition method. The iron(Ⅲ) oxide composition has been discussedusing FTIR, X-ray diffraction (XRD), transmission electron microscopy (TEM) and energy-dispersive X-ray spectroscopy (EDX).
Keyword:
Na4EDTA; 2,2’-bipyridine; Chelation; Fe2O3 NPs; Calcination; EDX; XRD
中图分类号:O433.4
文献标志码:A
Introduction
The synthesis of controlled-magnetite nanoparticles has always been of scientific and technological importance. However, the unified physical and chemical properties of magnetite nanoparticles are highly dependent on the synthesis pathway, and how to develop a simplified and effective method of grouping magnetite particles with high dispersion and a narrow size distribution remains a challenge[1]. In the last decades, nanotechnology has a great attention in the trends of biomedicine, drug delivery[2], biosensors[3], magnetic resonance imaging[4], catalyst[5] and biomedical applications, such as magnetic carriers for bioseparation[6], enzyme and protein immobilization[7] and contrast-enhancing media. Hematite (α -Fe2O3) is the most stable iron oxide and the most environmentally friendly semiconductor with band gap energy of Eg=2.1 eV[8]. It is traditionally used for red pigment[9], catalysts[10], electrodes[11], gas sensors[12], magnetic materials[13], photocatalytic[14] and anticorrosion protective paints. The properties of nanopowders greatly depend on their phase, microstructure and surface characteristics. The importance of iron oxide cannot be ignored as it is crucial for the accurate measurement of electricity and magnetism. In order to prepare homogenous nano-particles of iron oxide, researchers have employed in different routes to iron oxide nano-particles such as sol-gel processes[15], combustion[16], solvothermal[17] and hydrothermal[18]. There are two well-known crystalline types of Fe2O3: maghemite (the γ -phase) with cubic structure and hematite (α -phase) with rhombohedral structure. The phase transition of γ -phaseto α -Fe2O3 takes place during calcination at about 400 ℃[19]. The phase transformation which occurs during calcination gives rise to transform α -Fe2O3 powder which has undergone considerable aggregation and grain growth[20]. The main goal of this study is to synthesized ferric oxide nanoparticles by thermal decomposition route using ternary iron(Ⅱ ) complex of EDTA and 2, 2’ -bipyridine molecules. To attain this goal the present study was carried out with the following objectives: ① synthesis of iron(Ⅱ ) complex with EDTA incorporating 2, 2’ -bipyridine diamines. ② characterization of the iron(Ⅱ ) complex by elemental analysis (CHN), UV-visible, conductivity, magnetic measurement, and (FTIR & Raman) spectroscopic methods. ③ characterization of the iron(Ⅱ ) complex by thermal (TGA/DSC) analyses. ④ structural and surface morphological properties of as-prepared Fe2O3 are discussed by XRD, TEM, FTIR, UV-Vis and EDX analyses.
1 Experimental
1.1 Chemicals
All the used chemicals were purchased from Aldrich Chemical Company and were used without further purifications.
1.1.1 Synthesis of ternary iron(Ⅱ ) complex, [Fe2(EDTA)(bipy)2]
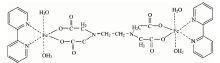
The iron(Ⅱ ) complex was synthesized as follows: To a solution of (2.00 mmole) FeSO4 in 20 mL of H2O, a solution of (2.00 mmole) 2, 2’ -bipyridine in 20mL methanol was slowly added with continuous stirring. The light green solution thus obtained, was stirred for half an hour. Later, (1 mmole) of ethylenediaminetetraacetic acid dissolved in 20 mL of methanol containing few drops of NaOH solution (1 mol· L-1) was added to the above solution, while stirring. The mixture was stirred further for 2 h at room temperature. The resulting greenish brown solution was filtered. Slow evaporation of the solvent in air at room temperature afforded solid greenish brown powder appropriate for microanalytical and spectroscopic analyses. The solid precipitated were washed with cold methanol and then air dried. (m. p.≥ 250 ℃) Yield: 73%. Anal. Calc. C, 45.94; H, 4.63; N, 10.71; Fe, 14.24. Found: C, 45.88; H, 4.52; N, 10.67; Fe, 14.11%. Solubility: insoluble in water; soluble in DMSO and DMF. The proposed structure ofthe iron(Ⅱ ) complex isdisplayed in Fig.1.
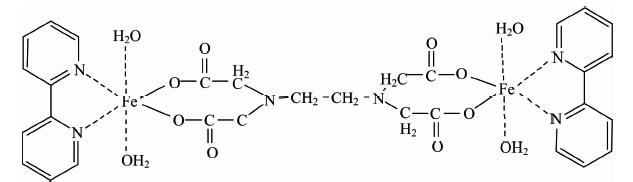 | Fig.1 Speculated structure of [Fe2(EDTA)(bipy)2] complex |
1.1.2 Preparation of Fe2O3NPs
The [Fe2(EDTA)(bipy)2]precursor complex was annealed at 600 ℃ in air. After 3 hr, itwas allowed to cool to room temperature toform red color Fe2O3 NPs.
1.2 Measurements
The elemental analyses of carbon, hydrogen and nitrogen contents were performed using a Perkin Elmer CHN 2400. The molar conductivity of freshly prepared 1.0× 10⁻³ mol· cm-3 dimethylsulfoxide (DMSO) solution was measured using Jenway 4010 conductivity meter. The electronic absorption spectrum was recorded in DMSO solventwithin 900~200 nm range using a UV2 Unicam UV/Vis Spectrophotometer fitted with a quartz cell of 1.0 cm path length. The infrared spectra were recorded on a Bruker FT-IR Spectrophotometer (4 000~400 cm-1). Magnetic data were calculated using Magnetic Susceptibility Balance, Sherwood Scientific, Cambridge Science Park Cambridge, England, at Temp 25 ℃. Transmission electron microscopy (TEM) images were taken in JEOL 100 s microscopyequipment. XRD patterns was scanned by X ’ Pert PRO PANanalytical, with copper target. Raman laser of samples were measured on the Bruker FT Raman with laser 50 mW. DSC thermograms of the new iron(Ⅱ ) complex was obtained on a SCINCO DSC 1500 STA, which was calibrated with indium metal. Sample in solid form were placed in aluminum pans with a pierced lid, and heated rate of 10 ℃· min-1 under a nitrogen flow. TGA was carried out on a SCINCO TGA 1500 STA apparatus at a heating rate of 10 ℃· min-1 under nitrogen atmosphere.
2 Results and Discussion
2.1 Molar conductance data of precursor Fe(Ⅱ ) complex
Mixed ligand iron(Ⅱ ) complex incorporating aromatic diamine bipy and EDTA carboxylates have been synthesized. In this research article, a newly synthesized iron(Ⅱ ) complex has sharp melting point. This complex is air stable and is soluble in two organic solvents as DMF and DMSO. This complex has been characterized by various analytical techniques including FT-IR, UV-Visible spectroscopy, magnetic measurement andthermal study. Both ethylenediaminetetraacetic acid sodium salt (Na4EDTA) and 2, 2’ -bipyridine (bipy) are bidentate chelating ligands that form a stable iron(Ⅱ ) complex. The molar conductivity was measured to recognize the octahedral geometrical structure of the mixed ligand iron(Ⅱ ) complex. Molarconductance (Λ M) of 10-3 mol· L-1 of the iron(Ⅱ ) complex which dissolved in dimethyl sulfoxide solution was determined. The conductance data of the iron(Ⅱ ) complex is 12 Ω -1· cm2· mol-1 which agreement with a non-electrolyte properties[21].
2.2 UV-Vis spectra an magnetic susceptibility of iron(Ⅱ ) complex
The electronic spectrum of mixed ligand iron(Ⅱ ) complex has a distinguish band at 19 230 cm-1 attributed to 5T2g→ 5Eg transition indicating octahedral geometry around iron metal ions[22]. The magnetic moment value μ eff is 4.87 B.M. assigned to an octahedral geometry around the two iron central metal ions[22, 23].
2.3 Infrared and Raman spectra of iron(Ⅱ ) complex
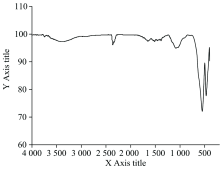
FT-IR spectrum of [Fe2(EDTA)(bipy)2] iron(Ⅱ ) complex is shown in Fig.2. The very strong band at 3 495 & 3 382 cm-1 corresponds to ν (O— H) stretch of coordinated water molecule[24]. The aromatic ν (C— H) stretching vibrations of 2, 2’ -bipyridineringspresence at (IR=3 085 cm-1 & Raman=3 091 cm-1) for iron(Ⅱ ) complex. The stretching vibrations of ν (C— H) stretches of CH2 groups of EDTA exhibited at (IR=2 895 cm-1 & Raman=2 927 cm-1), while δ (C— H) bending vibration of its CH2 groups appears at (IR=1 469 cm-1 & Raman=1 492 cm-1). These values show a shift from equivalent stretching values at 2 996, 2 953, 2 854 and 1 464 cm-1 for free EDTA, respectively. In the IR spectrum of free EDTA acid there is a strong vibration band at 1 697 cm-1 attributed to the carbonyl stretch for its carboxylic groups, this band is absent in the spectrum of iron(Ⅱ ) complex. The new absorption bands due to the asymmetric ν as(OCO) and symmetric ν s(OCO) stretching vibrations of the carboxylate group exhibit at (IR=1 633 cm-1 & 1 387 cm-1, Raman=1 605 cm-1 & 1 318 cm-1) respectively. The difference between asymmetric and symmetric stretching absorption bands of carboxylate group is (Δ ν )=246 cm-1, suggests monodentate coordination mode of the carboxylate group to the central iron metal ion[24]. When 2, 2’ -bipyridine is coordinated to iron metal ion, the changes in the IR and Raman spectra of the bipy ligand is observed, particularly in the regions 1 600~1 400 cm-1 which assigned to C& #61; N and C& #61; C ring stretching vibrations and the absorption bands within the range of 800~700 cm-1 are assigned to C— H; out of plane deformations[25, 26, 27, 28]. The iron(Ⅱ ) complex showed similar changes in these regions (Fig.2), which gave a conclusion that bipyridine is coordinated as a bidentate ligand and the iron(Ⅱ ) has a six coordination number. The characteristic peak at 834 cm-1 may be assigned to ν (O— H) bending vibrations of the coordinated water molecules present in the iron(Ⅱ ) complex[24].
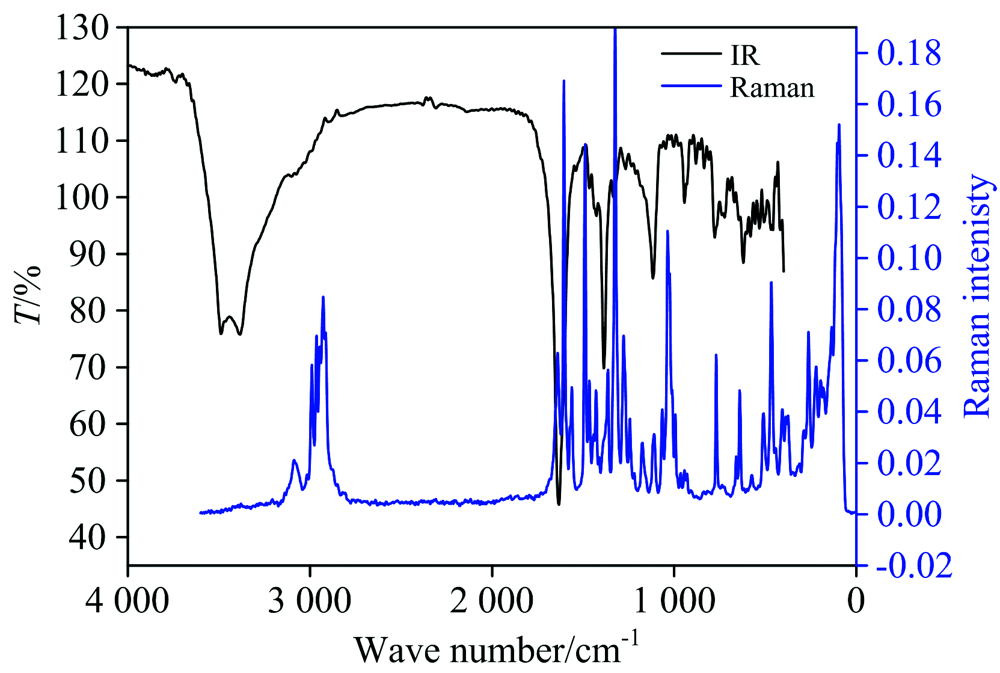 | Fig.2 FT-IR and Raman spectra of [Fe2(EDTA)(bipy)2] complex |
The ν (Fe— O) and ν (Fe— N) stretching band for EDTA and bipy moiety appear at (IR=537 & 466 cm-1 and Raman=467 & 405 cm-1) respectively. Due to the larger dipole moment change for Cu— O bond compared to Cu— N, ν (Cu— O) usually appears at higher frequency than ν (Cu— N)[24]. These features imply the coordination of both the ligands (EDTA & bipy) and water molecules to the iron(Ⅱ ) metal ions[24].
2.4 FT-IR spectra of Fe2O3 oxides
Infrared spectral analysis of iron(Ⅲ ) oxide presented from the thermal decomposition of [Fe2(EDTA)(bipy)2] complex precursor was employed to confirm the transformation of iron(Ⅱ ) chelate to iron(Ⅲ ) oxide during the thermal treatments. In order to confirm the type of iron oxide produced on thermal decomposition, the infrared spectra of prepared iron oxide in the range of 1 000~400 cm-1 was analyzed. The absorption bands in this range refer to Fe— O stretching vibration mode[24]. The iron oxide formed can exist mainly in different polymorphs, hametite (α -Fe2O3), magnetite (γ -Fe2O3), other polymorph designated as β -Fe2O3 which is very rarely found and Fe3O4. For Fe3O4 there is only one peak seen around 574 cm-1. For γ -Fe2O3 three peaks can be seen in range of 500~700 cm-1. For α -Fe2O3 two peaks are seen around in range of 700~400 c
 | Fig.3 FT-IR spectrum of Fe2O3 |
2.5 XRD patterns, EDX and TEMof Fe2O3 oxides
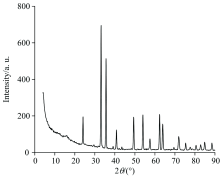
The X-ray powder diffraction (XRD) patterns was used to identify crystalline phases and to estimate the crystalline sizes. Figure 4 shows the XRD pattern of the precursor iron(Ⅱ ) complex after heat treatment. The α -Fe2O3 phase was the only phasepresent for the powder calcined above 500 ℃. The exhibited peaks at 24° , 33° , 35° , 41° , 49° , 54° , 57° , 62° and 62° are correspond to the (012), (104), (110), (113), (024), (116), (018), (214) and (300) of a rhombohedral structure of α -Fe2O3 is identified using the standard data. The mean size of the ordered Fe2O3 nanoparticles has been estimated from full width at half maximum (FWHM) and Debye-Sherrer formula[29] was ~27 nm.
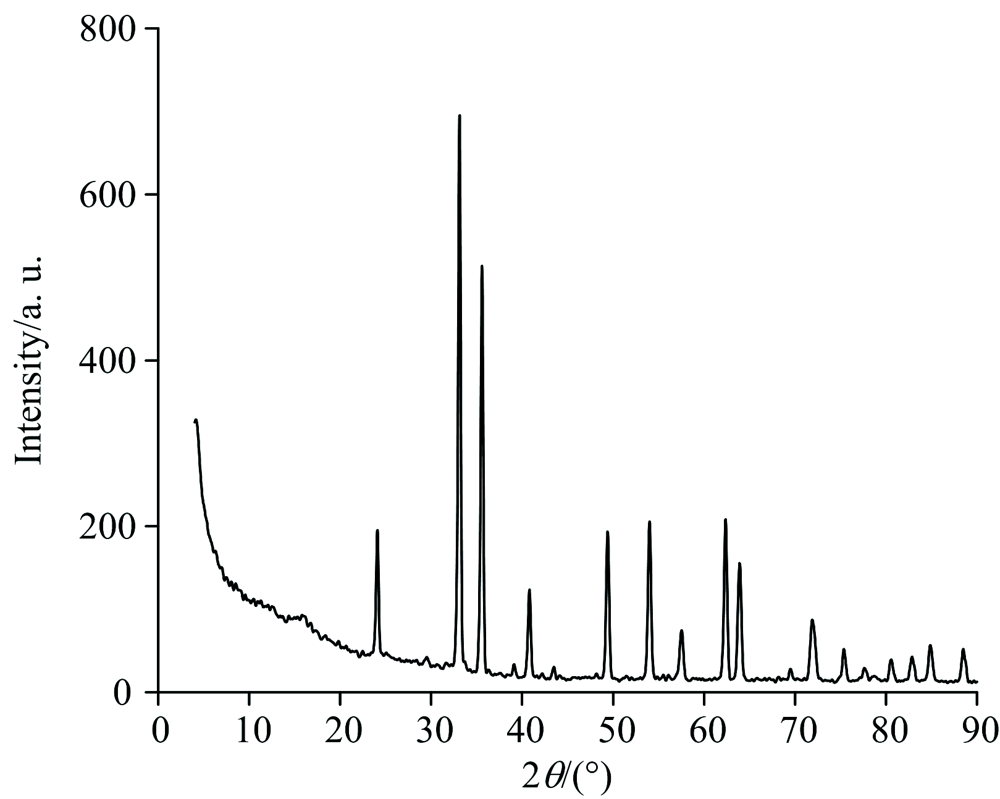 | Fig.4 XRD spectra of Fe2O3 as-synthesized |
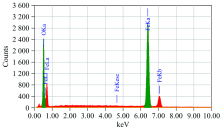
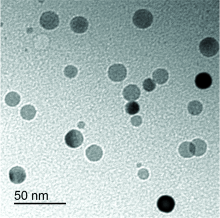
Energy dispersive spectroscopy (EDX) spectrum (Fig.5) shows the peaks only of iron and oxygen elements. TEM micrograph of the iron oxide obtained by thermal decomposition of [Fe2(EDTA)(bipy)2] heated at 800 ℃ shows nano particles having size in the range of 10~30 nm. The figure 6 shows sphere like particles with narrow size distribution.
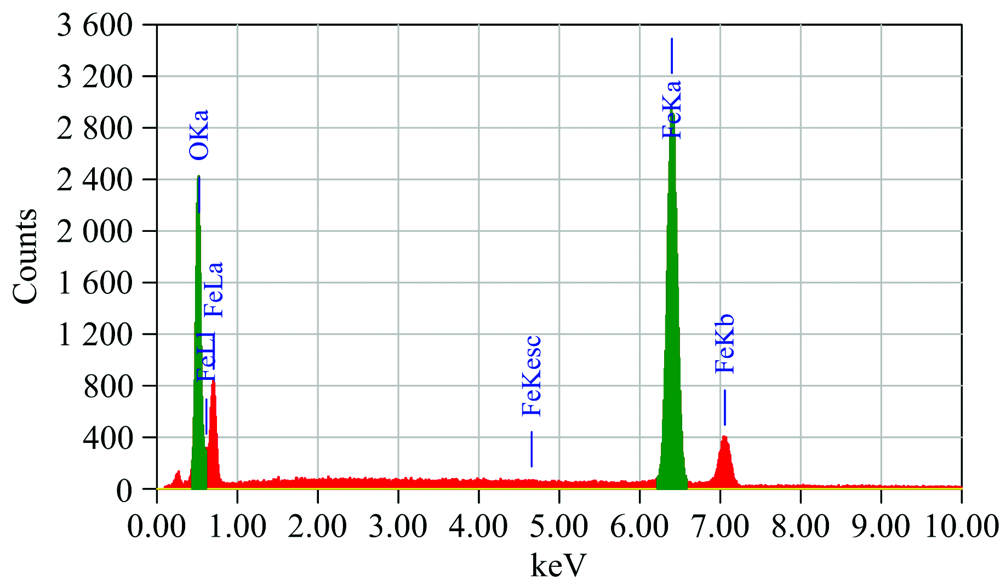 | Fig.5 EDX spectrum of Fe2O3 as-synthesized |
 | Fig.6 TEM image of Fe2O3 as-synthesized |
3 Conclusions
Simple thermal decomposition synthesis has been successfully carried out to synthesized ofα -Fe2O3 nanopowders at a relatively low temperature. XRD spectrum shows rhombohedral structure of α -Fe2O3. TEM image exhibits that the as-synthesized Fe2O3 spherical prepared by thermal decomposition route with an average diameter about 10~30 nm with less aggregation. EDS shows only peaks of iron and oxygen and indicates the absence of any impurities in prepared Fe2O3. FTIR data, showed the presence of Fe-Ostretching mode of Fe2O3.
参考文献
| [1] |
|
| [2] |
|
| [3] |
|
| [4] |
|
| [5] |
|
| [6] |
|
| [7] |
|
| [8] |
|
| [9] |
|
| [10] |
|
| [11] |
|
| [12] |
|
| [13] |
|
| [14] |
|
| [15] |
|
| [16] |
|
| [17] |
|
| [18] |
|
| [19] |
|
| [20] |
|
| [21] |
|
| [22] |
|
| [23] |
|
| [24] |
|
| [25] |
|
| [26] |
|
| [27] |
|
| [28] |
|
| [29] |
|