


Spectroscopic Characterizations of Metal-Complexes of 4-Hydroxybenzoic Acid With the Ni(Ⅱ), Mn(Ⅱ), and Cu(Ⅱ) Ions
引用本文
Samar O. Aljazzar. Spectroscopic Characterizations of Metal-Complexes of 4-Hydroxybenzoic Acid With the Ni(Ⅱ), Mn(Ⅱ), and Cu(Ⅱ) Ions[J]. Spectroscopy and Spectral Analysis, 2021,41(6): 1971-1975.
Doi:10.3964/j.issn.1000-0593(2021)06-1971-05
Permissions
Doi:10.3964/j.issn.1000-0593(2021)06-1971-05
Copyright©2021, 《光谱学与光谱分析》期刊社
《光谱学与光谱分析》期刊社 所有
Spectroscopic Characterizations of Metal-Complexes of 4-Hydroxybenzoic Acid With the Ni(Ⅱ), Mn(Ⅱ), and Cu(Ⅱ) Ions
e-mail: drsamaraljazzar2020@gmail.com
Abstract
One of the phenolic acids is 4-hydroxybenzoic acid (HBA) which takes the form of a white crystalline solid with a molecular formula of C7H6O3, a melting point of 214.5 ℃ and a molecular weight of 138.12 g·mol-1. It soluble in polar organic solvents like acetone and alcohols, and slightly soluble in chloroform and water. The reactions between the metal ions and the HBA were carried out under specific conditions like (molar reaction was 2∶2 (ligand to metal), reaction temperature was 60 ℃, media was neutral (pH 7), and solvent was H2O ∶MeOH (1∶1). Under these conditions, the HBA was deprotonated to form (HOC6H4C
Keyword:
4-hydroxybenzoic acid; Metal-complex; Spectral analysis; Nanostructure
中图分类号:O433.4
文献标志码:A
Introduction
Phenolic acids are bioactive compounds widely distributed in plant kingdom, and they consider as a group of secondary metabolites from plants and fungi. These acids are known to have antimicrobial, antioxidant, anti-inflammatory, and anti-collagenase activity[1, 2, 3, 4]. In the environment, HBA was identified in the fruit, leaves, straw, bark, wood, and humus[5, 6, 7]. Because they have chemical functional groups (phenolic and carboxylic groups) that are found in natural organic matter, HBA considered as the first step to describe these matter[8]. The esters of HBA which known as parabens are used as preservatives in ophthalmic solutions and cosmetics[9]. HBA and some of its derivatives are used to prepare synthetic high polymers for novel liquid crystals[10, 11]. The chemical interactions of HBA with Eu(Ⅲ )[8, 12], Co(Ⅱ )[13], and Zn(Ⅱ )[14] ions were reported. We aimed through this study to investigate the chemical interaction of HBA with the Ni(Ⅱ ), Mn(Ⅱ ), and Cu(Ⅱ ) ions under the following conditions: molar ratio; 2∶ 2 (Ligand∶ Metal), reaction temperature; 60 ℃, Media; neutral (pH 7), and solvent; MeOH∶ H2O (1∶ 1). The obtained complexes were characterized by elemental analysis, magnetic moment, UV(Vis, IR, and XRD.
1 Materials and Methods
1.1 Materials
All solvents and chemicals used in this investigation were of analytical reagent grade and obtained from Sigma-Aldrich Co., (St Louis, MO, USA). The ligand used in this investigation is 4-hydroxybenzoic acid (HOC6H4CO2H (HBA; Figure 1); 138.12 g· mol-1; purity ≥ 99%). The metal nitrates used in this investigation are nickel(Ⅱ ) nitrate hexahydrate (Ni(NO3)2· 6H2O; 290.79 g· mol-1; purity 99.99%), manganese(Ⅱ ) nitrate tetrahydrate (Mn(NO3)2· 4H2O; 251 g· mol-1; purity≥ 97%), and copper(Ⅱ ) nitrate trihydrate (Cu(NO3)2· 3H2O; 241.6 g· mol-1; purity≥ 99%).
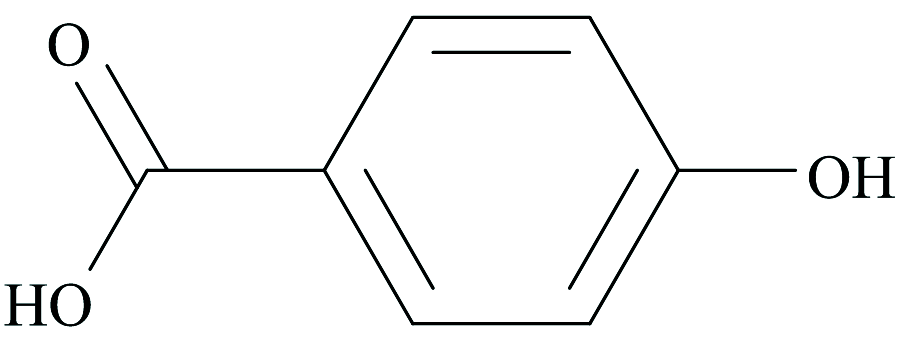 | Fig.1 Molecular structure of 4-hydroxybenzoic acid (HBA) |
1.2 Methods
1.2.1 Preparation method
A methanolic solution containing 2 mmol (20 mL) of HBA was added to a H2O solution containing 2 mol (20 mL) of a metal nitrate (Ni(NO3)2· 6H2O, Mn(NO3)2· 4H2O, or Cu(NO3)2· 3H2O) under continuous stirring. A colored precipitate was formed when the pH of the mixture reached 7 by adding a few drops of conc. ammonium (NH3). All the mixtures were stirred for 25 minutes at 60 ℃. After cooling, the colored precipitates were collected, filtered, washed, and dried in an oven at 70 ℃.
1.2.2 Characterization methods
An elemental analyzer (model PE 2400CHN) for collecting the elemental percentage (%) of carbon, nitrogen and hydrogen. A Sherwood magnetic susceptibility balance for collecting the magnetic susceptibilities. A UV-Vis spectrometer (model UV2(Unicam) for collecting the electronic spectra in DMSO solvent over the region 200~800 nm. IR spectrometer (model Bruker FT-IR) for collecting the infrared spectra over the region 400~4 000 cm-1. An X-ray diffractometer (model Panalytical’ s X’ Pert PRO) for collecting the XRD spectra over the 2θ range 5° ~80° (10 kV, λ =0.154 056 nm, CuKα 1 radiation source).
2 Results and discussion
2.1 Elemental analysis results
[Ni2L2(NO3)2(H2O)4] complex: oily green powder; C14H18N2O16Ni2 (587.62 g· mol-1). Elemental data (%): found (calculated) for C, 28.44 (28.59); H, 2.95 (3.06); N, 4.98(4.76); Ni, 20.16 (19.98). [Cu2L2(NO3)2(H2O)4] complex: greenish blue powder; C14H18N2O16Cu2 (597.34 g· mol-1). Elemental data (%): found (calculated) for C, 28.34 (28.12); H, 2.87 (3.01); N, 4.54 (4.69); Cu, 21.46 (21.28). [Mn2L2(NO3)2(H2O)4] complex: brown powder; C14H18N2O16Mn2 (580.12 g· mol-1). Elemental data (%): found (calculated) for C, 29.16 (28.96); H, 3.25 (3.10); N, 4.65 (4.83); Mn, 18.73 (18.94).
2.2 UV-Vis spectra
The Gouy’ s method was used to measure the magnetic moment (μ eff) values for the synthesized complexes[15]. The μ eff values for [Ni2L2(NO3)2(H2O)4], [Cu2L2(NO3)2(H2O)4], [Mn2L2(NO3)2(H2O)4] were 3.1, 1.9, and 4.4 B.M., respectively. These values suggest that these complexes possess an octahedral geometry with six-coordinate chelation modes for the metal ions[16, 17, 18].
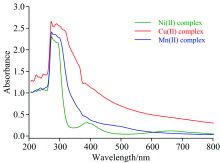
The electronic spectra of the complexes were collected over the wavelength range 200~800 nm in DMSO solvent at room temperature (Figure 2). The complexation of L- by the metal ions displayed a very strong broad band on their UV-Vis spectra. In all complexes, this band had two maximums at 290~300 nm and at 274 nm. That at 290~300 nm corresponds to the n→ π * transitions, while that at 274 nm corresponds to the π → π * transitions. Also, weak broad band was observed at 448 nm for [Ni2L2(NO3)2(H2O)4] complex, at 574 nm for [Cu2L2(NO3)2(H2O)4] complex, and at 402 nm for [Mn2L2(NO3)2(H2O)4] complex. These bands could be attributed to the ligand-to-metal charge transfer bands (LMCTs)[19].
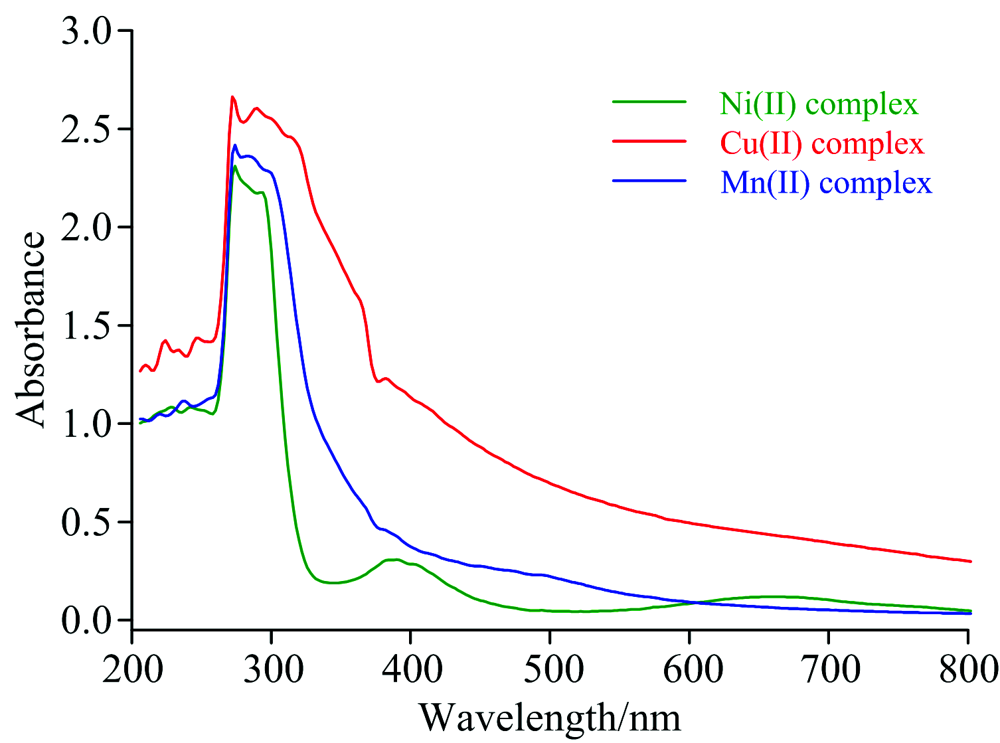 | Fig.2 The UV-Vis. spectra of the Ni(Ⅱ ), Cu(Ⅱ ) and Mn(Ⅱ ) complex |
2.3 FT-IR spectra
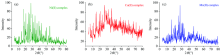
The measured IR spectra of the synthesized complexes are shown in Figure 3. Assignments of the main vibrational bands for the HBA[20], and the complexes are:
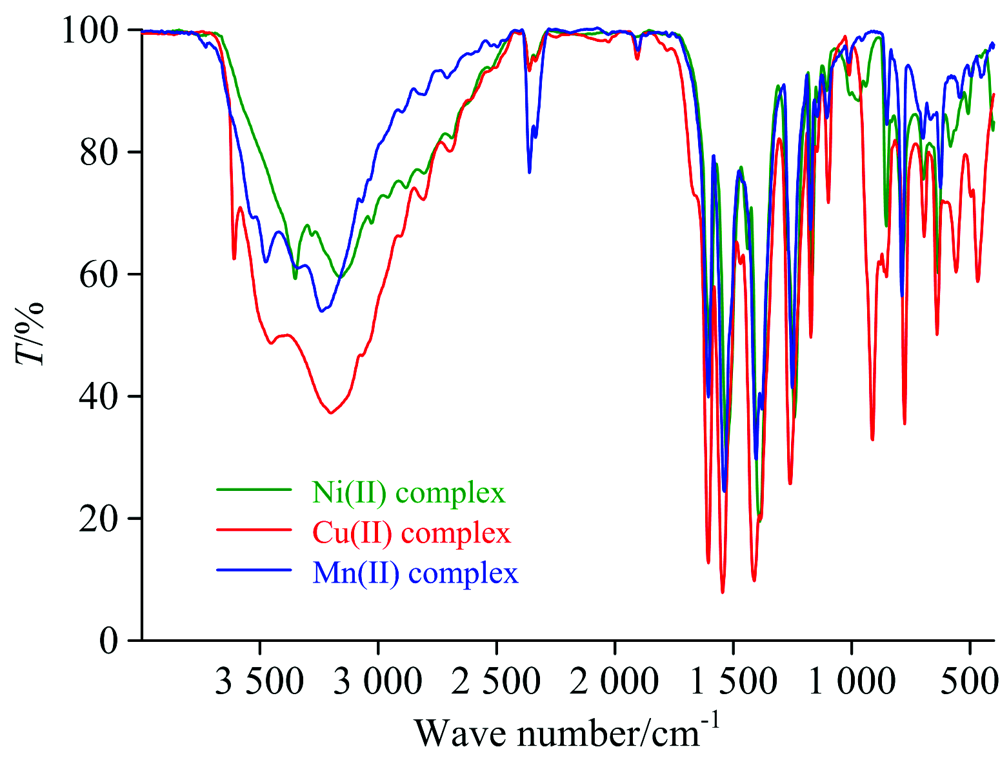 | Fig.3 IR spectra of the Ni(Ⅱ ), Cu(Ⅱ ) and Mn(Ⅱ ) complex |
This region (4 000~1 900 cm-1) is characteristic of the ν (C— H) of the aromatic ring, and the ν (O— H) of the acidic and phenolic groups. In the IR spectrum of HBA, the band observed at 3384 cm-1 was assigned to the ν (O— H) of phenolic group, and the band located at 3 100 cm-1 was assigned to the ν (O— H) of acidic group. The numerous bands observed at 3 054, 2 967 and 2 820 cm-1 were characteristic of the antisymmetric and symmetric C— H stretching vibrations. In the IR spectra of the Ni(Ⅱ ), Cu(Ⅱ ), and Mn(Ⅱ ) complexes, the band of 3 100 cm-1 is absent. A broad absorption bands ranged from 3 475 to 3 200 cm-1 were appeared and assigned to the OH group; ν (O— H) of latticed or coordinated water molecules. The (1 800~1 200 cm-1) region is characteristic of the ν (C& #61; C), ν (C— C), ν (C& #61; O), and ν (C— O) vibrations. Also, the ring deformations, and the OH deformation are expected in this region. In the IR spectrum of HBA, the intense band observed at 1 675 cm-1 with the shoulder at 1 685 cm-1 were assigned to the ν (C& #61; O) of COO group. These two bands were no longer found in the IR spectra of the Ni(Ⅱ ), Cu(Ⅱ ), and Mn(Ⅱ ) complexes. Two new bands were appeared at 1 408, 1 412 and 1 410 cm-1 for Ni(Ⅱ ), Cu(Ⅱ ), and Mn(Ⅱ ) complex, respectively due to the ν s(COO-) vibrations, and at 1 541, 1 546 and 1 540 cm-1, respectively due to the ν as(COO-) vibrations of the carboxylate group. In the IR spectrum of NaL slat (sodium 4-hydroxybenzoate), these bands were observed at 1 416 cm-1 for ν s(COO-) and at 1 547 cm-1 for ν as(COO-)[21, 22, 23]. The differences between the ν as(COO-) and ν s(COO-) values [Δ ν =ν as-ν s] of NaL is 131 cm-1. The Δ ν values for Ni(Ⅱ ), Cu(Ⅱ )and Mn(Ⅱ ) complex are 133, 134, and 130 cm-1, respectively. These values are remains like that of NaL, and according to the Nakamoto criterion[24], this suggests a bidentate bridging chelating for the carboxylate group (COO-) in all complexes. In the IR spectra of complexes, the bands resonating at 1 607~1 600, 1 384~1 377, and 1 256~1 242 cm-1 were due to the in the plane δ def(C— H), in the plane δ (O— H), and ν (C— O) vibrations, respectively. At (1 200~1 000 cm-1) region, several modes appear strongly coupled such as C— H in the plane and out-of-plane deformations, ν (C— C), ring deformation, and ring torsion. In the IR spectra of complexes, the bands resonating at 1 175~1 168, and 1 110~1 107 cm-1 were due to the ν (C— O), and ν (C— C) vibrations, respectively. The complexes displayed four characteristic bands in the region below 1 000 cm-1. These bands were observed at 970~920, 855~850, 784~777, and 585~542 cm-1 due to the out-of-plane δ (C— H), out-of-plane δ (O— H), ring stretching vibrations, and ν (M— O) vibrations. The stretching vibrations of Ni— O, Cu— O, and Mn— O bond were observed as a weak band at 585, 561, and 542 cm-1, respectively[25]. The bands of the coordinated nitrate: ① ν (N& #61; O) (ν 1) (~1 560 cm-1) was overlapped with that of the ν as(COO-) vibrations, ② ν as(NO2) (ν 5) (~1 385 cm-1) was overlapped with that of the in the plane δ (O— H) vibrations, and ③ ν s(NO2) (ν 2) (1 100 cm-1) was overlapped with that of the ν (C— C) vibrations[13].
2.4 XRD results
The XRD and SEM techniques were used to check phase purity, crystal structure of the synthesized complexes. Figure 4 displays the XRD patterns of Ni(Ⅱ ), Cu(Ⅱ ), and Mn(Ⅱ ) complexes collected over the 2θ range of 5° ~80° . [Ni2L2(NO3)2(H2O)4] complex had one very strong diffraction line at Bragg’ s angle 2θ =28.089° , and six strong lines at 17.529° , 20.606° , 24.814° , 25.707° , 29.915° and 34.084° . This complex had also eight medium strong lines at different Bragg’ s angles. The XRD diffractogram of [Cu2L2(NO3)2(H2O)4] complex showed a very strong diffraction line at Bragg’ s angle 2θ =26.440° , eight strong lines at 14.353° , 15.385° , 19.653° , 21.122° , 23.504° , 29.359° , 32.098° and 36.684° , and another eight medium strong lines at different Bragg’ s angles. Complex [Mn2L2(NO3)2(H2O)4] had on very strong difgraction line at 2θ =27.891° , and two medium strong lines at 16.298° and 25.508° . This complex had also ten medium lines at different Bragg’ s angles. The d-spacing and particle size for each complex were calculated based on the Bragg’ s diffraction angle (θ ) of the highest line detected in the complexes’ XRD diffractograms. For each complex, the inter-planar spacing between the atoms (d-spacing; Å ) was determined using the Bragg’ s law (d=λ /2sinθ )[26], where the average particle size (D; nm) was determined using the Debye-Scherrer’ s law (D=0.94λ /β cosθ )[27, 28]. The symbols in these two laws are: d is d-spacing in Å , D is average particle size in nm, 0.94 is Scherrer constant, λ is wavelength of the Kα 1 radiation (0.154 056 nm), θ is Bragg diffraction angle in ° , and β is the full-width at half-maximum of the highest line (FWHM) in rad. Table 1 tabulates the values of β , d, and D for the complexes. The D values were found to be ~20.8, 10.7 and 28.5 nm for Ni(Ⅱ ), Cu(Ⅱ ) and Mn(Ⅱ ) complex, respectively. These values indicate that the complexes were nanoscale sized.
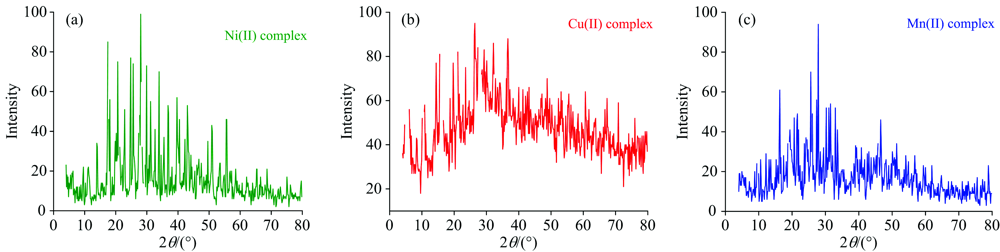 | Fig.4 XRD spectra of the Ni(Ⅱ ), Cu(Ⅱ ) and Mn(Ⅱ ) complex |
| Table 1 The XRD spectral data for the Ni(Ⅱ ), Cu(Ⅱ ), and Mn(Ⅱ ) complex |
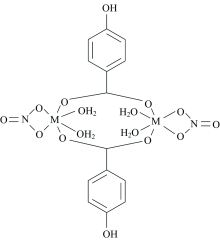
Elemental, magnetic, thermal and spectral results proposed that L- coordinate to the Ni(Ⅱ ), Cu(Ⅱ ) and Mn (Ⅱ ) ions in a bidentate bridging manner using the carboxylate group (COO-). These metal ions have six-coordinate modes, and the coordination sphere is complemented by water molecules. The synthesized complexes have the general proposed formulae [M2L2(NO3)2(H2O)4] (where M: Ni(Ⅱ ), Cu(Ⅱ ) or Mn(Ⅱ )) as given in Figure 5.
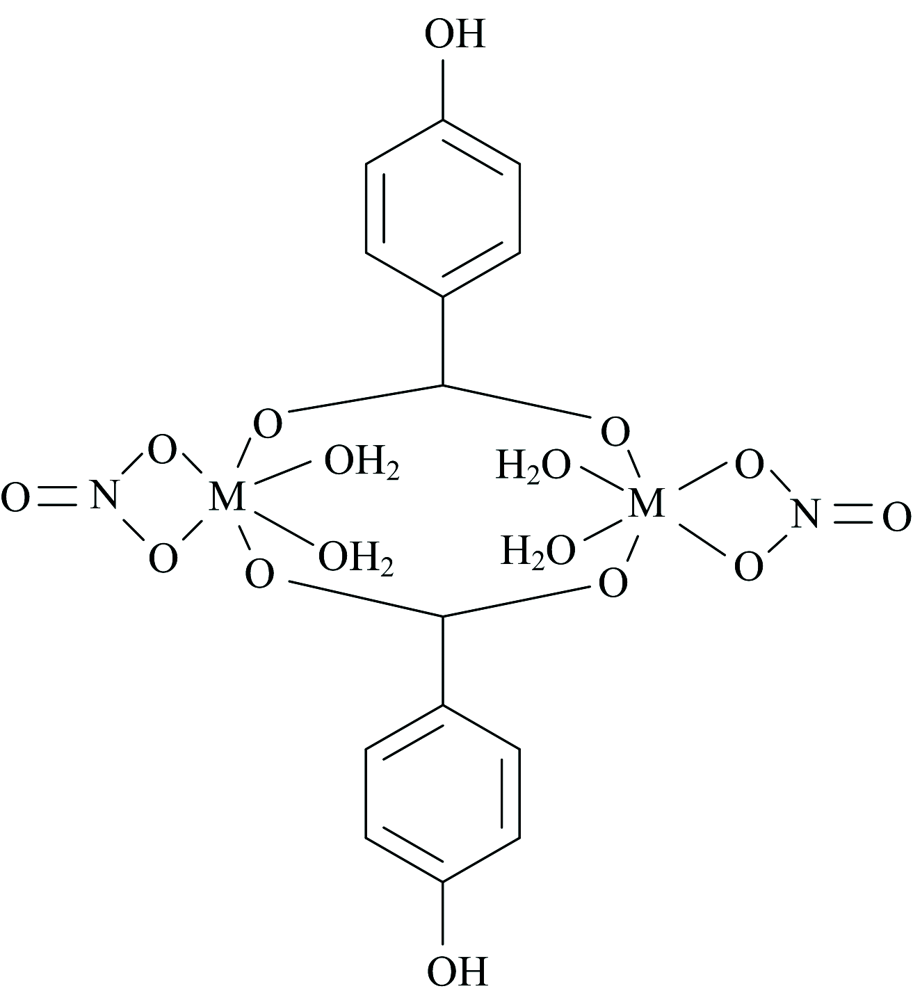 | Fig.5 Proposed structure of the synthesized complexes (where M: Ni(Ⅱ ), Cu(Ⅱ ) or Mn(Ⅱ )) |
3 Conclusion
Spectral and thermal properties of metal-complexes formed from the reaction of HBA with the Ni(Ⅱ ), Cu(Ⅱ ) and Mn(Ⅱ ) ions in neutral media were highlighted. The obtained complexes were characterized by elemental, magnetic, and spectral methods. Furthermore, the XRD technique was used to check phase purity, crystal structure of the formed complexes. The obtained results proposed that the ligand (L-) coordinated to the Ni(Ⅱ ), Cu(Ⅱ ) and Mn(Ⅱ ) ions in a bidentate bridging mode using the carboxylate group (COO-), and the formed complexes have the general proposed formulae [M2L2(NO3)2(H2O)4] (where M: Ni(Ⅱ ), Cu(Ⅱ ) or Mn(Ⅱ )) with an octahedral geometry.
参考文献
| [1] |
|
| [2] |
|
| [3] |
|
| [4] |
|
| [5] |
|
| [6] |
|
| [7] |
|
| [8] |
|
| [9] |
|
| [10] |
|
| [11] |
|
| [12] |
|
| [13] |
|
| [14] |
|
| [15] |
|
| [16] |
|
| [17] |
|
| [18] |
|
| [19] |
|
| [20] |
|
| [21] |
|
| [22] |
|
| [23] |
|
| [24] |
|
| [25] |
|
| [26] |
|
| [27] |
|
| [28] |
|