

LED照明系统的光谱组成对糖脂代谢的影响
[范晓静1, 2  , 陈德福
, 陈德福3 , 曾晶2 , 梁昕悦1, 2 , 徐轶煊1, 2 , 邱海霞2, * , 顾瑛2, 3, 4, * ]
, 陈德福, 顾瑛]
|
|


哺乳动物昼夜节律系统对不同光谱组成敏感性不同。 时差光照模式可导致昼夜节律紊乱进而增加患代谢性疾病的风险。 然而, 光谱组成是否影响时差光照模式的代谢效应尚不明确。 采用昼夜节律系统敏感性显著不同的窄带LED光照(蓝光和红光波段)和宽带LED白光, 分析光谱组成对时差光照模式下小鼠糖脂代谢功能的影响, 并与正常光照模式进行比较。 光照强度均采用120 μW·cm-2。 结果显示白光时差组小鼠体重增加最多。 红光时差组小鼠出现严重脂质代谢紊乱, 并伴有肝功能受损。 白光下时差光照会显著降低葡萄糖耐量和胰岛素敏感性, 而红光和蓝光能阻碍时差光照引起空腹血糖升高。 研究表明调整光谱组成可能改善时差光照模式对糖脂代谢的不良影响。
, CHEN De-fu, GU Ying
Biography: FAN Xiao-jing, female, (1992—), PhD student, Medical School of Chinese PLA e-mail: fanxiaojingmed@sina.com
The mammalian circadian system has a different sensitivity to various spectral components. The chronically alternating light-dark cyde (“jetlag”) has been shown to cause circadian disturbances and increase the risk of metabolic diseases. However, it remains unknown whether the spectral component affects the metabolic effects under “jetlag” light cycles. In this study, broadband white light-emitting diode (LED) and narrow-band LEDs [blue light (BL) and red light (RL) with significantly different sensitivity to circadian system] were used to analyze the effect of the spectral component on the metabolism under normal and aberrant light cycles in C57BL/6J mice. All the light intensities is 120 μW·cm-2. The results showed that jetlag white light (WL) mice exhibited the most body weight gain. Jetlag RL mice suffered from significant lipid metabolism disorders and impaired liver function. Jetlag WL significantly reduced glucose tolerance and insulin sensitivity, while RL and BL prevented jetlag mice from an increase in fasting serum glucose. This study shows that modulating the spectral component may improve the adverse effects of the “jetlag” light pattern on glucose and lipid metabolism.
Physically speaking, sunlight is composed of all colors of the rainbow. This combination of colors was called “ white” . In recent decades, the invention of white light-emitting diode (LED) triggers lighting technology innovation. Although this new lighting source appears white, it has a significant difference in spectral component compared with sunlight as white LED emits more light of short wavelength (465~485 nm) and has a pronounced blue peak[1]. In the past, the biological effects of spectra have been extensively studied, but only in plants. However, the discovery of a third class of photoreceptors in the animal retinas has improved the understanding of spectra’ s biological effects in mammals[2]. Photoreception in the mammalian retinas is not restricted to the rods and cones that form vision but extends to intrinsically photosensitive retinal ganglion cells (ipRGCs) that mediate non-visual effects, including the regulation of circadian rhythm[3]. The ipRGCs are most sensitive to a wavelength near 480 nm, suggesting that the blue portion of the visible spectrum was mainly responsible for regulating the circadian system[4]. In contrast, mice are less sensitive to red light (RL) due to the lack of cone opsins sensitive to long-wavelength light[5]. Therefore, it is necessary to evaluate the biological effects of different spectral components in white LEDs.
Organisms have evolved a circadian system to acclimate to light-dark cycles generated by the earth’ s 24-h rotation. The circadian system allows organisms to anticipate rhythmic environmental changes and optimize energy homeostasis by temporally segregating incompatible processes[6]. Metabolism is fundamentally controlled by the endogenous circadian system which depends on light stimuli to entrain to diurnal changes in the external environment[7]. Unfortunately, chronically alternating light-dark cycles (“ jetlag” ) have been linked with the increased risk of developing metabolic disorders, such as obesity and type 2 diabetes[8, 9]. Misalignment of internal circadian rhythms is considered responsible for metabolic dysfunctions under the “ jetlag” light cycles.
Interestingly, the study showed that apart from light intensity being highly variable, the spectral component of sunlight also exhibits diurnal changes, related to the solar elevation angle[10]. In 2015, Walmsley et al.[11] demonstrated for the first time that spectral changes during twilight also contribute to photoentrainment. Thus, a few studies have attempted to address the acute glucose response to different wavelengths of light. An animal study found that exposure to green light (GL) at night increased glucose intolerance in rats, but RL and blue light (BL) did not[12]. However, the other study showed that blue-cut light pulse ameliorates glucose metabolic abnormalities in mice and humans[13]. Although the previous research has elucidated how spectrum influences the acute blood glucose changes at night, surprisingly few studies have focused on the long-term metabolic effects of light wavelength under chronic jetlag. In this study, we examined the metabolic effects of broad-spectrum white LED and the narrow-band LEDs, including RL and BL near the two peak regions of the spectrum of white LED.
Forty 6-week-old male C57BL/6J mice, weighting 19~21 g at the beginning of the experiment, were purchased from the laboratory animal center of Chinese PLA general hospital. All mice had ad libitum access to high-fat diet (HFD, 60% of energy from lipid, D12492) to simulate unhealthy diet habit. Two mice were housed in each transparent polypropylene cage (34 cm× 15 cm× 16 cm). To prevent the interferences of other ambient cues (e.g., natural light and noise), every cage was placed in a customized, lightproof, soundproof, and ventilated cabinet (50 cm× 35 cm× 40 cm) with integrated, programmable LED lighting in a standard housing environment [(21± 1) ℃, 50%~60% humidity]. All irradiances of light in this study were 120 μ W· cm-2 at the level of 4 cm above the cage floor. Irradiance (μ W· cm-2) was measured with a spectral power densitometer (SPD-370), which also provided light intensity values in units of lux and photons cm-2· s-1. See Table 1 for light measurements.
| Table 1 Light measurement of LEDs used in the experiment |
During the accommodation, mice were maintained in a normal 12 h:12 h light-dark cycles for 2 weeks. Then the control mice were still housed in a the normal light-dark cycle with white light (control WL), while the other mice were subjected to “ jetlag” light cycles based on a weekly repeated schedule with an 8-h phase advance in light offset on Monday and an 8-h phase delay in light offset on Thursday to simulate shift work [Fig.1(a)]. Under “ jetlag” light cycles, mice were randomized into three subgroups and exposed to a different colors of LEDs (3535ALN), including white light (jetlag WL, 4 000 K), red light (jetlag RL, peak at 629 nm), and blue light (jetlag BL, peak at 471 nm). Spectral power distributions are shown in Fig.1(b). During the experiment, body weight, food and water intake were measured at least once a week. At 13 weeks of the experiment, all groups’ lights were recovered to the normal WL for 2 weeks to resynchronize the circadian systems. During the resynchronization, glucose (GTT) and insulin tolerance tests (ITT) were performed, and then mice were fasted overnight and sacrificed for the collection of serum, adipose, pancreas, and liver samples. The Laboratory animal center approved all animal procedures of Chinese PLA general hospital (Permit Number: 2020-X16-28).
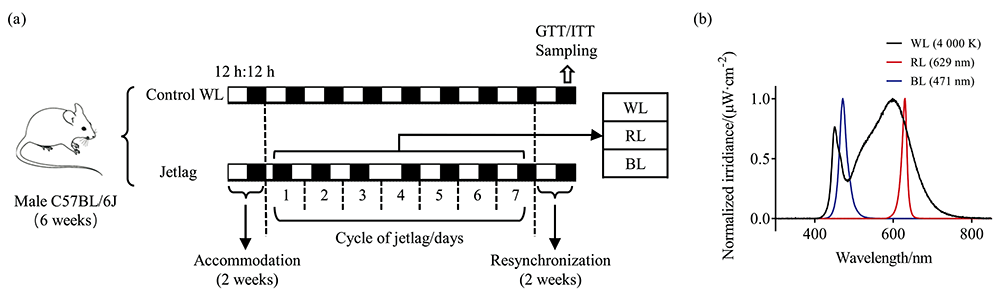 | Fig.1 Experimental schedule and spectral power distributions of light source (a): Zebra bar represents the lighting schedule in which white and black segments indicate “ lights on” and darkness, respectively. The length of the segment indicates the duration; (b): Spectral power distributions of white, red, and blue LEDs |
Mice were fasted for 14 or 6 h for intraperitoneal GTT (ipGTT) or ITT, respectively. The blood glucose was determined with a glucometer (Roche) before and at 15, 30, 60, and 120 min after intraperitoneal injection of D-glucose (1 g· kg-1 body weight) for ipGTT or after intraperitoneal injection of human insulin (1.0 U· kg-1 body weight) for ITT. The area under the curve (AUC) was calculated by GraphPad 9.0. Insulin sensitivity was assessed by the homeostatic model assessment of insulin resistance (HOMA-IR). HOMA-IR=fasting glucose (mg· dL-1)× fasting insulin (mU· L-1)/450.
Animals were anesthetized, and blood was collected through extirpation of the eyeball at the end of the 15-week experiment. Serum glucose, triglyceride, total cholesterol, alanine aminotransferase (ALT), and aspartate aminotransferase (AST) were measured with an automatic biochemistry analyzer (Chemray 800). Insulin was measured by Mouse Ultrasensitive Insulin ELISA Kit (ALPCO), and corticosterone was measured by Mouse and Rat Corticosterone ELISA (ALPCO) by the manufacturer’ s protocol. Hepatic triglyceride concentration was assayed using the Triglyceride Assay Kit (Nanjing Jiancheng) and normalized to liver protein content.
All animals were anesthetized and euthanized at 15 weeks of the experiment. Formalin-fixed liver tissues were stained with hematoxylin and eosin (H& E). Epididymal white adipose tissue (eWAT) was precisely dissected and weighed. Sections (3 μ m) of paraffin-embedded eWAT were stained with H& E. The adipocyte area was quantified by averaging counts from three random fields per section. Paraffin-embedded pancreatic sections were stained with H& E and stained for insulin (anti-insulin rabbit pAb, Servicebio). The mass of β -cells was calculated by the insulin-positive area ratio to the pancreatic cross-sectional area multiplied by the wet tissue weight. Image quantification of adipocyte area and β -cells mass was performed using ImageJ software.
Statistics were performed by using GraphPad Prism software version 9.0. Statistical analyses were performed using two-way repeated measured ANOVA with Tukey’ s post hoc tests for time series. For two independent groups, statistical differences were evaluated by Student’ s two-tailed t-test or nonparametric Mann-Whitney U-test. All data are presented as mean ± SE. Statistical significance was considered at p< 0.05.
Under WL, chronically alternating light-dark cycles significantly promoted body weight gain from 9 weeks of the experiment compared with the control WL group (103.3%± 3.9% vs. 86.5± 6.1%, p< 0.05)[Fig.2(a)]. Remarkably, BL prevented jetlag mice from body weight gain as no difference was observed in body weight gain between jetlag BL mice and control WL mice throughout the experiment [Fig.2(a)]. Moreover, jetlag BL mice gain much less body weight than jetlag WL mice (113.3%± 10.3% vs. 138.0%± 3.9%, p< 0.01)[Fig.2(b)]. At 15 weeks of the experiment, we evaluated the visceral fat mass. Although there was no significant difference between the groups in left eWAT mass [Fig.2(c)], jetlag RL mice gained more fat accumulation in right eWAT compared with control WL mice [(1.12± 0.08) g vs. (0.91± 0.04) g, p< 0.05] [Fig.2(d)].
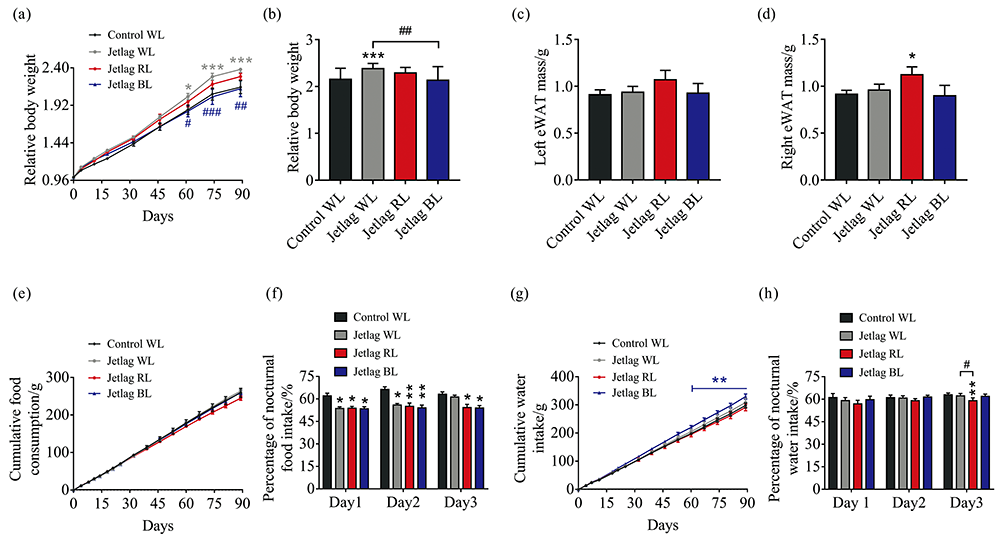 | Fig.2 Effects of chronically alternating light-dark cycles on energy homeostasis are wavelength-dependent (a): Relative body weight gain during the experiment; (b): Relative body weight gain at the end of the 15-week experiment; (c): Left eWAT mass; (d): Right eWAT mass; (e): Cumulative food consumption; (f): Percentage of nocturnal food intake; (g): Cumulative water consumption; (h): Percentage of nocturnal water intake. Results are means± SE (n=8 per group); * p< 0.05, * * p< 0.01, * * * p< 0.001 vs. control WL group; #p< 0.05, ##p< 0.01, ###p< 0.001 vs. jetlag groups |
Besides, we also analyzed the percentages of nocturnal food and water intake in the first three days after shifting the light-dark cycle to evaluate how the eating and drinking patterns were affected by different lighting conditions. Results showed that the cumulative food consumption was indistinguishable in all groups [Fig.2(e)]. However, the eating patterns were significant altered by “ jetlag” light cycles as the percentages of nocturnal food intake were significantly decreased in all jetlag mice compared to control WL mice [Fig.2(f)]. Interestingly, across three tested light cycles, significantly increased nocturnal food intake was only observed in jetlag WL mice rather than jetlag mice under RL or BL, suggesting that WL accelerated eating behaviors [Fig.2(f)]. The cumulative water consumption of jetlag BL mice was significantly higher than that of control WL mice after 9 weeks of the experiment [Fig.2(g)]. In addition, the nocturnal drinking patterns were restored more quickly than eating behaviors. The percentages of nocturnal water intake in the first two tested light cycles were similar in all groups, while jetlag RL mice consumed less at night than control WL and jetlag WL mice on the third day after shifting light-dark cycle[Fig.2(h)].
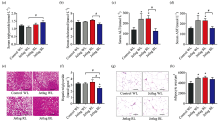
Jetlag BL mice had significantly higher serum triglyceride levels compared with jetlag WL mice [(1.41± 0.12) mmol· L-1vs. (1.10± 0.08) mmol· L-1, p< 0.05][Fig.3(a)]. In contrast, jetlag BL mice had significantly lower serum cholesterol levels compared with jetlag RL mice [(5.2± 0.3) mmol· L-1vs. (6.2± 0.2) mmol· L-1, p< 0.05] [Fig.3(b)]. Normal liver function is essential for lipid metabolism. The “ jetlag” light significantly increased the serum ALT and AST levels under WL and RL, but not under BL, suggesting that BL prevented jetlag mice from impaired liver function [Fig.3(c, d)]. Although there was no difference in hepatic triglyceride levels between control WL mice and jetlag WL mice, RL significantly promoted fatty liver development in jetlag mice, while jetlag BL mice had the lowest levels of hepatic triglyceride [Fig.3(e, f)]. Histological analysis of eWATs revealed that chronically alternating light-dark cycles significantly promoted fat accumulation in adipose depots and jetlag mice under WL and RL had larger adipocyte size [Fig.3(g, h)].
 | Fig.3 Effects of chronically alternating light-dark cycles on lipid metabolism are wavelength-dependent (a): Serum triglyceride levels; (b): Serum cholesterol levels; (c): Serum ALT levels; (d): Serum AST levels; (e): Representative images of H& E staining of sections of livers. Scale bars, 100 μ m; (f): Hepatic triglyceride levels; (g): Representative images of H& E staining of sections of eWAT. Scale bars, 100 μ m; (h): Average adipocyte area. Results are means ± SE (n=8 per group). * p< 0.05 vs. control WL group; #p< 0.05 vs. jetlag groups |
Jetlag WL mice were much more glucose intolerant than control WL mice, while RL surprisingly protected jetlag mice from glucose intolerant as jetlag RL mice had lower blood glucose levels than jetlag WL mice [Fig.4(a)]. ITT results showed no significant difference in insulin sensitivity among all the groups, despite a trend that jetlag BL mice had a better insulin sensitivity [Fig.4(b)].
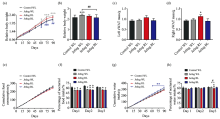
 | Fig.4 Effects of chronically alternating light-dark cycles on glucose metabolism are wavelength-dependent (a): Glucose tolerance tests. Inset represents AUC for glucose; (b): Insulin tolerance tests. Inset represents AUC for glucose; (c): Fasting serum glucose levels; (d): Fasting serum insulin levels; (e): HOMA-IR; (F): Serum corticosterone levels; (g): Representative images of insulin staining of sections of pancreases. Scale bars, 200 μ m; (h): Quantitation of β -cell mass. Results are means ± SE (n=8 per group). * p< 0.05, * * p< 0.01, * * * p< 0.001 vs. control WL group; #p< 0.05, ##p< 0.01 vs. jetlag groups |
As expected, jetlag WL mice had significantly higher fasting serum glucose and insulin levels than control WL mice [Fig.4(c, d)]. In addition, the HOMA-IR index, a model based on a single combination of fasting glucose and insulin levels, was dramatically increased in jetlag WL mice, indicating that WL significantly exacerbated the insulin resistance in jetlag mice [Fig.4(e)]. However, such adverse effects of “ jetlag” light cycles on glucose metabolism were attenuated in RL and BL. Jetlag BL mice had significantly lower fasting serum glucose levels compared with jetlag WL mice [(8.0± 0.8) mmol· L-1vs. (11.2± 0.9) mmol· L-1, p< 0.05] [Fig.4(c)], while jetlag mice subjected to RL and BL had significantly decreased fasting serum insulin levels and lower HOMA-IR index than jetlag WL mice [Fig.4(d, e)]. Corticosterone, a hormone that regulates multiple aspects of glucose and lipid homeostasis, was remarkably increased in jetlag RL mice [Fig.4(f)].
Chronically alternating light-dark cycles provoked a 33.6% increase in β -cell mass in jetlag WL mice compared with control WL mice [(2.73± 0.28) mg vs. (2.04± 0.15) mg, p< 0.05] [Fig.4(g, h)]. The compensatory increments of β -cell mass combined with elevated fasting serum insulin levels in jetlag WL mice provide an estimate on the contribution of “ jetlag” light cycle to insulin resistance. However, BL significantly prevented jetlag mice from enlargement of islet morphology, while jetlag RL mice had a trend of β -cell mass expansion compared with control WL mice [Fig.4(h)].
The present study showed that RL aggravates lipid metabolic disorders and BL ameliorates glucose metabolic disorders in mice under chronically alternating light-dark cycles, suggesting that circadian disruption affects glucose and lipid metabolism in a wavelength-dependent manner. These findings may provide a potential strategy for designing lighting interventions to decrease the risk of metabolic syndrome under aberrant light cycles.
The impacts of long-term exposures to different light wavelengths on glucose homeostasis have rarely been reported before. According to an 8-week experiment, mice raised in a normal light-dark cycles showed worse glucose tolerance when exposed to RL but not to BL than WL[13]. A recent study found that BL decreased plasma glucose levels in rats at various points during the night[14]. However, a human study reported that blue-enriched light could induce higher glucose peak in the evening[15]. It is therefore, likely that the metabolic effects of spectra were species, duration, and intensity-dependent.
Although the circadian system is most sensitive to short wavelength, BL prevented jetlag mice from obesity and fatty liver under circadian disrupting condition, suggesting BL regulates lipid metabolism through other mechanisms. A recent study demonstrated that BL enhances adaptive thermogenesis in mice, which depends on encephalopsin (OPN3), a 480 nm-sensitive opsin expressed in adipocytes[16]. In this study, jetlag BL mice significantly consumed more water, which estimates higher energy expenditure under BL. What is more, Ondrusova et al.[17] found that BL promotes lipolysis in cultured adipocytes. This could be an explanation for increased serum triglyceride levels in jetlag BL mice.
Corticosterone is the most important glucocorticoid hormone in mice and is involved in the regulation of energy homeostasis and stress responses. Our results are consistent with the previous data that the concentrations of serum corticosterone were increased by a photic phase-shift in rats[18] and provide additional evidence that RL induces more corticosterone production than WL and BL. However, other studies found that RL and BL had no difference in the acute increased effects on glucocorticoid production in humans[19, 20]. The discrepancy of light duration and species may account for the inconsistent with these findings.
In addition to maintaining a balance between caloric intake and energy expenditure, eating at the appropriate time is also considered to play an important role in the maintenance of metabolic homeostasis. Light phase restricted feeding significant promoted body weight gain in HFD-fed mice[21]. By contrast, restricting food intake to the dark phase attenuated metabolic diseases in diabetes-prone mice[22]. The misalignments between the central and peripheral clock have been demonstrated to be related to metabolic disorder induced by shifting the eating schedule[23]. Also, the time-restricted feeding could accelerate the adaptation of core body temperature and activity rhythms, indicating that feeding time influences the circadian system[24]. In this study, the percentage of nocturnal food intake was monitored for three consecutive days after the shift in light-dark cycles. Interestingly, WL significantly accelerated the adaptation of nocturnal feeding behavior to a new light phase but lead to increased metabolic dysfunctions. More evidence is needed to confirm the relationship between the accelerated adaptation of feeding rhythm andcircadian disruption’ s metabolic effects.
In mammals, light affects metabolic physiology indirectly through synchronization of circadian rhythms, or directly sleep and alertness regulation[25]. A clinical trial found that blue-enriched white light declined sleepiness in shift workers[26]. Another animal research showed that blue light (470 nm) at the beginning of the dark phase induces behavioral arousal in mice, whereas a longer wavelength (GL, 530 nm) promotes sleep[27]. In the current study, the delay in turning off lights caused light exposure at subjective night. We speculate that BL could arouse more activities and delay the sleep onset in mice. Sleep disturbance is an important factor contributing to fmood disorders[28], which has also been shown to be associated with metabolic disorders[29]. In addition, mood can be disturbed by aberrant light exposure. Thus, it is reasonable to expect that the differences in metabolic parameters induced by manipulating wavelength may be related to different mood alterations. The researchers evaluated the affective responses to 4 weeks of exposure to nocturnal dim light in female Siberian hamsters and showed that WL induced more depressive-like behavior than RL and BL, with less mood disturbance found in jetlag RL groups[30]. In this study, however, jetlag RL mice had the highest serum corticosterone levels, suggesting that a combination of RL and shifting light-dark cycles has serious implications for the stress state.
The present study suffers from some limitations. Firstly, the different contributions of various photoreceptions and undefined signaling pathways lead to the complexity of the calibration of light intensity for different colors. Lux, a photometric unit based on subjective brightness weighted to human visual system’ s sensitivity, is not really appropriate for quantifying non-visual effects of light[31]. In this study, the same level of irradiance leads to differences in illuminance. The appropriate unit of light intensity remains to be determined in studying wavelength-dependent metabolic effects in the future. Secondly, the findings should be interpreted cautiously given the “ color opponent” mechanism as metabolic effects of the combination of different wavelengths are not additive[32].
In summary, we have identified that RL aggravates lipid metabolic disorders and BL ameliorates glucose metabolic disorders under aberrant light-dark cycles. Although the effects of light wavelength on metabolic parameters may depend on species, duration, and intensity, our results indicate that spectral variation is an alternative strategy to decrease the risk of metabolic syndrome, especially in individuals exposed to aberrant light-dark cycles.
Acknowledgments
We acknowledge the Institute of Semiconductors CAS for LED lighting design and valuable technical assistance.
| [1] |
|
| [2] |
|
| [3] |
|
| [4] |
|
| [5] |
|
| [6] |
|
| [7] |
|
| [8] |
|
| [9] |
|
| [10] |
|
| [11] |
|
| [12] |
|
| [13] |
|
| [14] |
|
| [15] |
|
| [16] |
|
| [17] |
|
| [18] |
|
| [19] |
|
| [20] |
|
| [21] |
|
| [22] |
|
| [23] |
|
| [24] |
|
| [25] |
|
| [26] |
|
| [27] |
|
| [28] |
|
| [29] |
|
| [30] |
|
| [31] |
|
| [32] |
|