

不同种类岩石的太赫兹光谱特征研究
[苗昕扬1, 2, 3  , 刘学聪
, 刘学聪1, 3 , 陈梦溪3 , 陈思同3 , 张善哲1 , 路婉婷3 , 彭雪3 , 詹洪磊2, 3 , 朱明达1 , 赵昆1, 2, 3, * ]
, 刘学聪]
|
|


准确认识不同种类的岩石特征对地质构造、 结构与年代的判断至关重要。 常规光学显微手段虽然可以对岩石的颜色与表面形貌进行直接观测, 但是对岩石种类的判断往往凭靠经验, 一些颜色相近的矿物容易混淆, 所得结果并不准确。 光谱方法能够在不同频段给出样品的多个光学参数信息, 通过建立光学参数与样品自身物性的联系, 可以从多个维度确定样品的性质, 从而有望实现对不同矿物成分与含量定性、 定量评价。 太赫兹光谱具备一定的穿透能力, 能够透过一定厚度的岩石, 是研究岩石物理性质的合理手段。 基于太赫兹光谱技术, 对取自不同地区的花岗岩、 灰岩、 砂岩和油页岩样品进行测试, 分别计算得到每个样品的等效折射率 n、 衰减系数 a, 并以 a为横坐标、 n为纵坐标作图, 结果表明, 相同岩性岩石的 n与 a基本呈线性相关关系, 而对于不同类型的岩石, 其 n随 a的线性变化趋势存在明显区别。 进而研究了岩石中的组成、 结构等信息与其太赫兹光谱响应的联系, 分析了不同岩性岩石的光谱响应机制, 结果表明: 花岗岩与灰岩的结构较为致密, 其矿物组成是影响太赫兹光谱响应的主要因素, 利用太赫兹参数能够估算岩石中铁、 镁元素的相对含量; 砂岩的成分较为单一, 太赫兹光谱响应受孔隙度的影响; 而对于油页岩来说, 由于有机质具有强吸收、 低折射率的特点, 其有机质含量越高, 折射率越低, 对太赫兹吸收越强。 结果表明, 太赫兹光谱技术有望成为岩石物理性质现有研究手段的合理补充, 为其评价、 分析提供新技术、 新指标, 有着极其光明的应用前景。
, LIU Xue-cong
MIAO Xin-yang, (1992—), received the Ph. D. degree from China University of Petroleum, Beijing e-mail: miaoxy@cup.edu.cn
Determining the types of rock is crucial to understand the origin and history of geological units. The recognition and classification of lithologies are usually performed by experienced researchers based on the colors and morphologies with the accuracy not guaranteed, particularly when trying to distinguish between units with similar lithology. Different from the subjective judgment, spectral means can provide multiple optical parameters among different frequencies. Information of the samples can be determined by establishing the relationship between optical parameters and the physical properties, to achieve qualitative and quantitative evaluation. In this study, terahertz (THz) spectroscopy was employed to discriminate the lithology of rock gathered from different regions. Based on the relations between effective refractive index ( n) and attenuation coefficient ( a), the samples can be classified into four gatherings, with the result in agreement with their lithologies. Besides, the variation tendency of THz parameters was plotted with the componential and structural properties, indicating that the variant THz responses were resulted by varying compositions and structures for different classifications of rocks. The mineral composition is the main factor affecting the absorption and refraction of the THz wave. Element content can be estimated with the THz parameters for Fe and Mg. For sandstone with stable elements, both the absorption and refraction of THz wave are negatively correlated with the porosity. Organic content in oil shale has a reverse effect on THz absorption and refraction, in which the higher oil yield results in a stronger absorption and lower refraction. Herein, the refractive index is positively correlated with the absorption for granite, limestone and sandstone, while the relation between them is negatively correlated for oil shale. Our results prove that the THz technique is a promising means for determining the lithology and petrophysics properties, which will be a significant supplementary in geology research.
Identification of the rock types is critical for the knowledge of origins and history in geological studies[1]. Usually, a lithological classificationis performed by experienced researchers based on the colors and morphologies, which is time-consuming with the accuracy not guaranteed[2]. This fact motivates the development of widely used, efficient methodologies for the lithological description. Elastic properties and lithology can be predicted from seismic data bydata inversion, which is an inverse problem and for a given seismic data set many solutions to exist[3]. Other techniques have also been used for element identification in the laboratory, including natural gamma radiation, X-ray fluorescence spectral scanning, laser-induced breakdown spectroscopy, Raman spectroscopy, etc[4, 5, 6].
As a general method of passing information from materials, optics can be served as the appropriate means to promote the development of geological engineering[7]. Terahertz (THz) radiation, which is located between far-IR (infra-red) and millimeter-wave bands of the spectrum, is willing to be a “ silver bullet” in various aspects of geological and geophysics studies, including mineral characterization, organic evaluation, anisotropy determination, etc[8, 9, 10]. According to our previous study, drill cuttings at several depths from an oil well were studied using THz spectroscopy. The cuttings were clearly classified based on Cluster analysis and principal component analysis methods[11]. Composition and granularity are the main factors affecting the spectral response for powder samples as drill cuttings. However, for block samples, both the structure and the component are complicated, and the model and mechanism of the THz spectrum collected in one region can be hardly applied to other ones[12]. Here in this study, THz spectroscopy was employed to study the block samples with variant lithologies from different regions. The key factors thatdetermine the THz spectral response characteristics of rocks with different classifications were stepwise studied and discussed. The samples were classified based on the relations between effective refractive index (n) and attenuation coefficient (a), in which the results were in agreement with the lithology. In addition, relations between the properties of the rocks and their THz parameters were built to explain the mechanism of rock classification. The variation tendency of n and a were plotted with the elemental content, porosity and the oil yield for granite, limestone, sandstone, and oil shale, respectively, indicating that the variant THz responses were resulted by varying compositions and structures for different classifications of rocks. We aim to employ the THz technique as a promising means for lithology determination, which will be a significant supplementary in geology research.
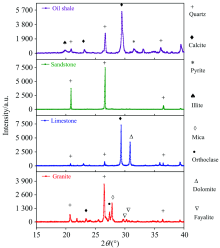
Twelve samples were divided into four groups according to their lithology (three samples per group), including deoiled sandstone, oil shale, granite and limestone. Specimen blocks and cores were cut into slices with the thickness around 2 mm. All investigated samples were summarized and numbered in Table 1. In order to confirm the basic information of the samples, XRD measurements were employed to detect the types of mineral components in the samples. As the most common mineral on earth, quartz was found in all types of rocks, which was the most abundant mineral in the sandstone and the granite. Carbonate minerals were the main components for the limestone and the oil shale, including calcite and dolomite.
| Table 1 General information for all the samples |
A transmission THz-TDS system was employed for the THz measurements under atmosphere. The slices were placed in the test position with the THz wave focused on the oil shale surface and measured one by one. Structural and morphology features of the samples were examined with a scanning electron microscopy (SEM), and the information on components of the samples were determined by the energy dispersive X-ray spectroscopy (EDS).
Typical THz time-domain spectra acquired by scanning the sliced samples with the THz system were reported in Figs.2(a)— (d). Rocks with various components and structures complexly modulated the incident THz signal, resulting in changes of the amplitude and pulse width of the transmitted signals. The waveforms of the samples were variant from each other at the peak amplitude and the delay time, indicating that THz waves could discriminate between the physical properties of the samples. For further investigation on whether the rocks with different lithologies can be distinguished by their spectroscopic THz properties, the maximum amplitude peaks (Ap) and the corresponding time delay (τ ) of the THz signals were extracted, and here we determined and calculated the attenuation coefficient (a) as well as the effective refractive index (n) calculated by
in which Aref and Asam represent the amplitude peaks, as well as τ ref and τ sam represent the time delay of the reference and the samples, respectively. d is the sample thickness, while c is the velocity of light. Then, as shown in Fig.2(e), n and a were plotted together to establish the predictive models among the parameters obtained in this study, in which the scatters with different colors represent the classification by lithology of the samples. As shown in Fig.2(e), a of the oil shale and the granite were larger than that of the limestone and the sandstone, whilen distributions of the samples with variant lithologies have little difference. The sandstones and limestones were located close to each other in the coordinate system, but it is possible to differentiate between them. It is clear from the figure that n correlates linearly in respect to a, with the slope and intercept varied between different classifications. Positive correlations were built between a and n for sandstone, limestone and granite, with the fitting slopes equaled 0.77, 0.23, and 0.27, respectively. Variant from the above three kinds of rocks, n of the oil shale is negatively correlated with a, and the slope was -0.47. In general, based on the values of a, n, as well as the linear relations between them, the scatter mainly divided into four gatherings, with the cluster results in agreement with the lithology of the samples.
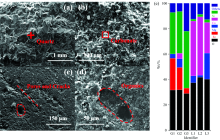
The discrepancy in components and structures resulted in the variant THz responses. Visualizing and quantifying the microstructures and elements by SEM and EDS permit an accurate means to determine the petrophysical properties. As a kind of coarse-grained igneous rock, granite is usually tight and hard, which is suitable for building materials. XRD results in Fig.1 has revealed the composition as quartz, mica, zeolum, and fayalite, while the crystalline texture of quartz and orthoclase was clearly shown in Fig.3(a). Limestone composed mainly of calcium carbonate and considerable amounts of magnesium carbonate (dolomite). Those carbonates were distributed like hydrangeas inside the limestone, as shown in Fig.3(b). As a common sedimentary rock consisting of cemented quartz, the composition of sandstone is generally uniform, with varying porosity and permeability under different sedimentary conditions and environments. The micro pores and cracks of the sandstone can be clearly observed in Fig.3(c). Micrograph characterization of the oil shale is depicted in Fig.3(d), in which the organics known as kerogen are clearly observed as the dark area surrounded by clay and carbonate. EDS analysis offers the quantitate results of elements, in which the contents of Fe and Mg are respectively different among the granites and the limestones, corresponding to the Iron oxides and dolomite minerals, as shown in Fig.3(e).
 | Fig.1 XRD patterns analysis about the mineral type of the samples with different lithologies |
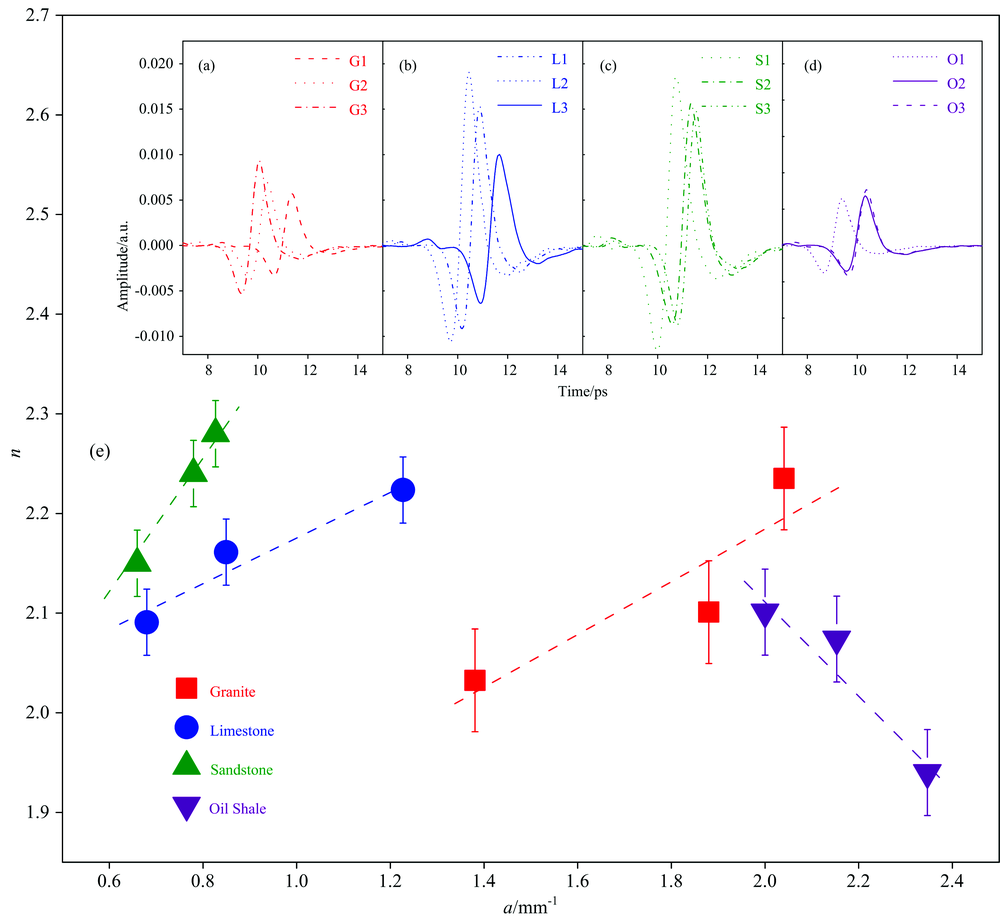 | Fig.2 Time dependent THz waveforms of the rocks (a): Granite; (b): Limestone; (c): Sandstone; (d): oil shale, respectively; (e): Relationship between a and n of rocks corresponding to their lithologies |
 | Fig.3 Surface morphology of (a) granite, (b) limestone, (c) sandstone, and (d) oil shale characterized by SEM; (e) Elemental analysis of the granite and limestone samples by EDS |
Further study of the THz response to the influence factor is essential for the mechanism analysis. As shown in Fig.4(a) and (b), n and a were respectively plotted in the double-y axis with the content of Fe and Mg for granite and limestone. The variation tendency of n and a roughly conformed to that of the Fe and Mg content, indicating that the variant THz responses were resulted by different compositions among those samples. Actually, Iron oxides and compounds were proved to be the key component for the absorbing effect of THz wave. Meanwhile, dolomite also has a stronger absorption of the THz pulse than carbonate and quartz[15]. Both of those minerals have higher molecular weights and densities, resulting in the positively correlated relations between n and the element content. The porosities of the deoiled sandstones used in this experiment were measured by mercury injection method. The sandstone can be regarded as the combination of pores and rock matrix. Therefore, the porosity of sandstone is inversely proportional to the refractive index and absorption. Pores in oil shalesare always occupied by insoluble organic matters known as kerogen. Owing to the vibration modes caused by intermolecular and intramolecular interactions, photons with the energies in the vicinity of energy levels corresponding to the vibration or rotation mode are more likely to be absorbed by organics. Therefore, strongly depends on the oil yields of oil shale. The dielectric constant of kerogen is much lower than that of the mineral matrix, thus higher oil content is responsible for lower n.
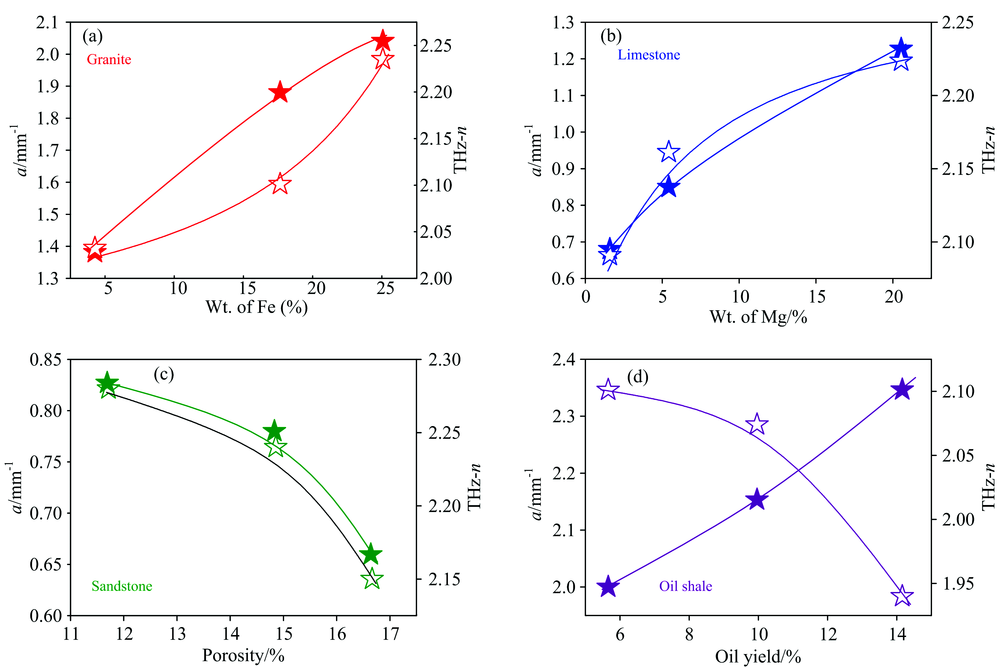 | Fig.4 THz-n and -a versus (a) Fe content for granite, (b) Mg content for limestone, (c) porosity for sandstone, and (d) oil yield for oil shale |
It is clear fromthe figures that the elements, components and structural properties correlate with the THz parameters, with variant response modes for rocks with different lithologies. Therefore, the correlations between n and a are different for variant classifications. The mineral composition is the main factor affecting the absorption and refraction of the THz wave. For sandstone with stable elements, both the absorption and refraction of THz wave are negatively correlated with the porosity. Organic content in oil shale has a reverse effect on THz absorption and refraction, in which the higher oil yield results in a stronger absorption and lower refraction. Herein, the refractive index is positively correlated with the absorption for granite, limestone and sandstone, while the relation between them is negatively correlated for oil shale.
In summary, spectral characteristics of rocks with different lithologies were studied by THz-TDS. Calculated THz parameters, including n and a, were employed to classify and analyze the rocks. The samples were clearly classified based on the relations between n and a, in which the results were in agreement with the lithology. Besides, the variation tendency of THz parameters was plotted with the componential and structural properties, indicating that the variant THz responses were resulted by varying compositions and structures for different classifications of rocks. Our results prove that the THz technique isa promising means for determining the lithology as well as the petrophysics properties, which is willing to be a significant qualitative and quantitative means in geology research.
| [1] |
|
| [2] |
|
| [3] |
|
| [4] |
|
| [5] |
|
| [6] |
|
| [7] |
|
| [8] |
|
| [9] |
|
| [10] |
|
| [11] |
|
| [12] |
|
| [13] |
|
| [14] |
|
| [15] |
|