

可见近红外高光谱成像对灵武长枣定量损伤等级判别
[袁瑞瑞 , 刘贵珊
, 刘贵珊* , 何建国, 康宁波, 班晶晶, 马丽敏]
, 刘贵珊, 何建国, 康宁波, 班晶晶, 马丽敏]
|
|


作者简介: 袁瑞瑞, 1994年生, 宁夏大学农学院硕士研究生 e-mail: ruiruiyuan123@163.com
利用可见近红外(Vis-NIR)高光谱成像技术对完好和损伤等级灵武长枣进行快速识别检测。 采用定量损伤装置得到损伤Ⅰ, Ⅱ, Ⅲ, Ⅳ和Ⅴ级的灵武长枣, 借助高光谱成像系统采集完好长枣和损伤长枣样本高光谱图像。 提取感兴趣区域(region of interest, ROI)并计算样本平均光谱值。 利用光谱-理化值共生距离算法(SPXY)将420个长枣样本按3∶1的比例划分校正集315个和预测集105个。 灵武长枣原始光谱建立偏最小二乘判别分析(PLS-DA)分类模型, 得到校正集和预测集准确率分别为72.70%和86.67%; 灵武长枣原始光谱数据采用移动平均(MA)、 卷积平滑(SG)、 多元散射校正(MSC)、 正交信号修正(OSC)、 基线校准(baseline)和去趋势(de-trending)等方法进行光谱预处理并建立PLS-DA分类判别模型。 通过分析比较, 得到MSC-PLS-DA为最优分类判别模型, 校正集准确率为76.19%, 预测集准确率为86.67%, 其中校正集比原始光谱建模准确率提高了3.49%, 预测集准确率较原始光谱建模结果未提高; 为了提高建模效果, 对灵武长枣原始光谱和预处理后的光谱分别采用连续投影算法(SPA)、 无信息变量消除(UVE)、 竞争性自适应加权抽样(CARS)和区间变量迭代空间收缩法(iVISSA)等算法提取特征波长, 建立PLS-DA分类判别模型, 结果表明, MSC-CARS-PLS-DA为最优模型组合, 校正集准确率为77.14%, 预测集准确率为89.52%, 建模准确率较原始光谱建模准确率分别提高了4.44%和2.85%。 结果表明, Vis-NIR高光谱成像技术结合MSC-CARS-PLS-DA模型可实现灵武长枣损伤等级的快速识别。
The visible near-infrared (Vis-NIR) hyperspectral imaging technology was used to identify the intact and damaged Lingwu long jujube rapidly. In this study, damage grades, including Ⅰ, Ⅱ, Ⅲ, Ⅳ and Ⅴ of Lingwu long jujubes were obtained by using quantitative damage devices. Hyperspectral images of intact and damaged samples were collected by using a hyperspectral imaging system. Region of interest (ROI) was extracted from the image and average spectral values of samples were calculated. Sample set partitioning based on joint x-y distance (SPXY) was used to divide all samples (420) into calibration sets (315) and prediction sets (105) in a ratio of 3∶1. The partial least squares discriminant analysis (PLS-DA) classification model was established for the original spectrum, and the accuracies of the calibration set and prediction set were 72.70% and 86.67%, respectively. The original spectrum of Lingwu long jujube was preprocessed by means of moving average (MA), Savitzky Golay (SG), multiplicative scatter correction (MSC), orthogonal signal corrections (OSC), baseline and de-trending. PLS-DA classification model was established after pretreatment. The results showed that in the PLS-DA classification model established by spectrum preprocessed by different pretreatment algorithms. Through analysis and comparison, it was found that MSC-PLS-DA was the optimal model combination. In the established classification discrimination model, the accuracies of the calibration set and prediction set were 76.19% and 86.67%, respectively. The accuracy of the calibration set was 3.49% higher than that of the original spectral modeling, and the accuracy of the prediction set was not higher than that of the original spectral modeling. Original spectral and spectral after pretreatment was used to extract feature wavelengths using the successive projections algorithm (SPA), uninformative variable elimination (UVE), competitive adaptive reweighted sampling (CARS) and interval variable iterative space shrinkage approach (iVISSA), and established the PLS-DA classification model based on the feature wavelengths. The results showed that MSC-CARS-PLS-DA was the optimal classification model, the accuracy of the calibration set was 77.14%, the accuracy of the prediction set was 89.52%. The modeling accuracy was improved by 4.44% and 2.85% respectively compared with the original spectral modeling accuracy. The above research showed that the Vis-NIR hyperspectral imaging technology combined with MSC-CARS-PLS-DA model could realize the rapid identification of lingwu jujube damage grade.
灵武长枣(Zizyphus jujuba Miller)又名马牙枣, 是宁夏优势特色枣果, 因其口感甜脆和营养丰富而倍受消费者喜爱[1]。 灵武长枣在采摘、 运输和加工等过程中, 因其皮薄易受到人为或机械等造成的内外部不同程度的损伤, 外部损伤可通过观察挑选出, 但内部损伤不易识别, 将会加速枣果变质, 降低质量并增加病原体侵染的风险等, 影响消费者购买决策[2, 3]。 因此, 亟需寻找一种快速无损的检测技术实现灵武长枣内部损伤的判别。
高光谱成像技术作为一种快速无损高效的检测技术, 近年来已成为研究热点, 主要应用于农产品物质含量[4, 5]、 病虫害[6]、 农药残留[7]和内外部损伤识别[8, 9]等检测。 Wu等[10]使用Vis-NIR和NIR高光谱成像技术检测灵武长枣的破裂、 青肿、 虫害常见缺陷, 识别率均达到93.9%以上; Lü 等[11]利用高光谱成像和平行六面体分类法检测奇异果上的暗疮, 检测错误率为14.5%。 综上所述, 利用高光谱技术快速识别水果损伤是可行的。
以灵武长枣为研究对象, 利用Vis-NIR高光谱成像技术结合多种预处理算法、 特征波长选择算法及偏最小二乘判别分析(partial least squares-discriminant analysis, PLS-DA)分类模型, 可实现灵武长枣机械损伤等级的快速识别, 为其他果蔬损伤等级的判别提供参考。
从宁夏灵武某果园手工采摘大小颜色一致、 完好无损伤的灵武长枣, 放入保鲜袋中当天运回实验室, 选取420个灵武长枣贮藏在(0± 2) ℃的冰箱备用。
如图1所示为3D打印的灵武长枣定量损伤实验装置[12], 该装置由试验台、 固定支架、 活动摆臂和曲率半径为8 mm和重量为22 g的实心铁半球组成。 实验时摆臂初始臂角为57° , 铁半球冲击灵武长枣赤道位置一次为Ⅰ 级损伤, 两次为Ⅱ 级损伤, 依次类推得到损伤等级为Ⅰ , Ⅱ , Ⅲ , Ⅳ 和Ⅴ 级的灵武长枣。
 | 图1 灵武长枣定量损伤装置Fig.1 Quantitative damage device of Lingwu long jujube |
灵武长枣光谱信息采集前, 高光谱系统预热30 min。 由于CCD摄像头中暗电流的存在和光源在不同波段下强度分布不均匀以及其他因素的影响, 造成光谱图像不稳定。 因此, 参照万国玲等黑白校正法进行高光谱图像校正。
1.4.1 预处理方法
利用移动平均(moving average, MA)、 卷积平滑(savitzky golay, SG)、 多元散射校正(multiplicative scatter correction, MSC)、 正交信号修正(orthogonal signal corrections, OSC)、 基线校准(baseline)和去趋势(de-trending)等预处理算法可以减少噪声和背景信息的干扰, 增加样本光谱数据的有效信息, 提高建模的准确性。
1.4.2 特征波长选择方法
连续投影(successive projections algorithm, SPA)算法能够选取冗余最小的变量来解决共线性问题; 无信息变量消除(uninformative variable elimination, UVE)算法能够去除一些噪声变量, 提高建模效果; 竞争性自适应加权抽样(competitive adaptive reweighted sampling, CARS)算法是一种经过多次计算, 淘汰误差较大的变量, 选择最优特征波段的新型算法。 区间变量迭代空间收缩法(interval variable iterative space shrinkage approach, iVISSA)算法是根据波段和光谱之间的位置和宽度进行组合, 从全局和局部选择波长的一种波长选择算法[13]。
如图2所示, 完整长枣和损伤长枣的平均光谱反射值呈现先低后高的变化趋势, 其中在640和900 nm左右的波峰, 在500, 680和970 nm左右的波谷, 主要是由于表皮叶绿素吸收和红边效应引起等[14]。
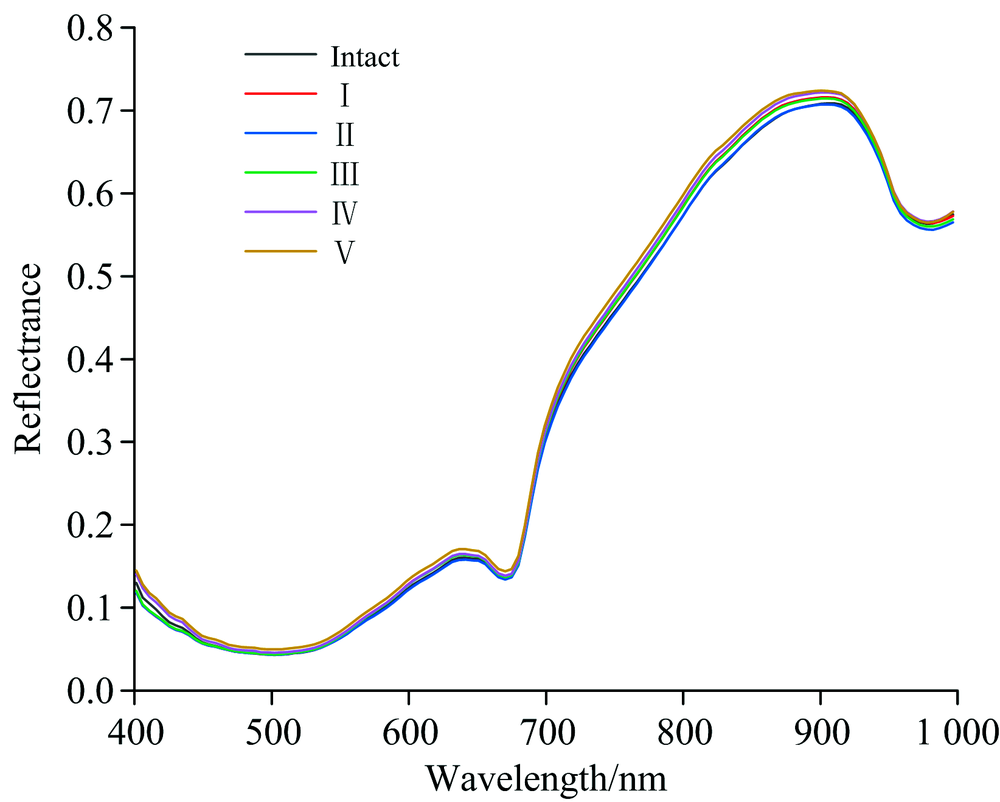 | 图2 原始光谱的平均光谱反射曲线Fig.2 Average reflection spectra of Lingwu long jujube |
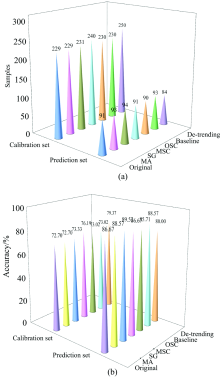
利用光谱-理化值共生距离(sample set partitioning based on joint x-y distance, SPXY)算法对420个样本划分校正集315个和预测集105个, 利用MA, SG, MSC, OSC, baseline和de-trending六种算法对样本的原始光谱预处理, 建立模型结果如图3, 校正集准确率在72.70%~79.37%之间, 预测集准确率在80.00%~89.52%之间。 原始光谱建立的模型中, 校正集结果为72.70%, 预测集结果为86.67%。 6种预处理算法预处理后, 较原始光谱校正集的准确率都有提高, 其中De-trending方法预处理后准确率比原始光谱提高了6.67%。 通过MA, SG和Baseline方法预处理后提高预测集的准确率, 准确率分别为88.57%, 89.52%和88.57%, MSC, OSC和De-trending较原始光谱预测集准确率未提高。
 | 图3 不同方法预处理后PLS-DA分类结果Fig.3 Classification results of PLS-DA after different pretreatments |
2.3.1 基于原始光谱的PLS-DA分析
4种算法对原始光谱选择的特征波长建立的模型结果如表1。 校正集结果在67.30%~69.21%之间, 预测集结果在74.29%~87.62%之间。 SPA, UVE和CARS算法提取特征波长建模中校正集结果比原始光谱结果都低; iVISSA算法提取的特征波长建立的模型预测集结果为87.62%, 比原始光谱建模结果高。
| 表1 原始光谱特征波长建立的PLS-DA分类结果 Table 1 Classification results of PLS-DA model based on feature wavelengths of original spectra |
2.3.2 基于MA预处理光谱的PLS-DA分析
4种算法选择的特征波长建立的模型结果如表2。 通过分析, 在SPA-PLS-DA和CARS-PLS-DA模型中, 预测集准确率都为87.62%, 比原始光谱准确率提高了0.95%。 其他模型准确率较原始光谱建模均未提高, 可能是波长选取过程中剔除了有用信息, 建立的模型准确率偏低。
| 表2 MA预处理光谱特征波长建立的PLS-DA分类结果 Table 2 Classification results of PLS-DA model based on feature wavelengths of MA pretreated spectra |
2.3.3 基于SG预处理光谱的PLS-DA分析
4种算法选择的特征波长建立的模型结果如表3。 SPA提取的特征波长建立的模型中校正集准确率未提高, 预测集准确率为87.67%, 提高了0.95%; UVE提取特征波长建立的模型准确率较原始光谱建模均未提高; CARS-PLS-DA模型中, 校正集准确率和原始光谱模型准确率都为72.70%, 预测集准确率比原始光谱模型准确率提高了0.95%, 为87.62%; iVISSA-PLS-DA模型中, 模型中校正集准确率未提高, 预测集准确率提高了3.81%, 为90.48%。
| 表3 SG预处理光谱特征波长建立的PLS-DA分类结果 Table 3 Classification results of PLS-DA model based on feature wavelengths of SG pretreated spectra |
2.3.4 基于MSC光谱的PLS-DA分析
4种算法选择的特征波长建立的模型结果如表4。 SPA和iVISSA选择的特征波长建立的模型准确率较原始光谱建模均未提高; UVE提取特征波长建立的模型中, 校正集结果为74.29%, 比原始光谱结果提高了1.59%, 预测集结果为84.76%。 CARS提取特征波长建立的模型中, 校正集准确率比原始光谱提高了4.44%, 为77.14%, 预测集准确率比原始光谱建模也提高了2.85%, 为89.52%。
| 表4 MSC预处理光谱特征波长建立的PLS-DA分类结果 Table 4 Classification results of PLS-DA model based on feature wavelengths of MSC pretreated spectra |
2.3.5 基于OSC光谱的PLS-DA分析
4种算法选择的特征波长建立的模型结果如表5。 SPA和UVE提取特征波长建立的模型中, 建模结果较原始光谱建模结果均未提高。 CARS提取特征波长建立的模型中, 校正集准确率为75.87%, 比原始光谱建立的模型准确率提高了3.17%; 预测集准确率为86.67%, 与原始光谱建立的模型准确率一样。 iVISSA-PLS-DA模型中, 校正集准确率为73.33%; 预测集准确率未提高。
| 表5 OSC预处理光谱特征波长建立的PLS-DA分类结果 Table 5 Classification results of PLS-DA model based on feature wavelengths of OSC pretreated spectra |
2.3.6 基于Baseline光谱的PLS-DA分析
4种算法选择的特征波长建立模型结果如表6。 SPA-PLS-DA模型中, 结果较原始光谱建模结果未提高; UVE-PLS-DA模型中, 校正集比原始光谱建模结果低, 预测集与原始光谱建模结果都为86.67%; CARS-PLS-DA模型中, 校正集和预测集结果都有提高, 校正集结果为74.92%, 比原始光谱结果提高2.22%; 预测集结果为88.57%, 比原始光谱结果提高1.90%。 iVISSA-PLS-DA模型中, 预测集准确率为88.57%, 较原始光谱准确率提高1.90%; 校正集准确率未提高。
| 表6 Baseline预处理光谱特征波长建立的PLS-DA分类结果 Table 6 Classification results of PLS-DA model based on feature wavelengths of baseline pretreated spectra |
2.3.7 基于De-trending光谱的PLS-DA分析
4种算法选择的特征波长建立的模型结果如表7。 SPA-PLS-DA模型中, 校正集准确率较原始光谱建模准确率未提高; UVE, CARS和iVISSA提取特征波长建立的模型中, 校正集结果较原始光谱都有提高, UVE-PLS-DA模型校正集准确率比原始光谱建模提高了4.44%, CARS-PLS-DA模型校正集准确率比原始光谱建模提高了2.22%, iVISSA-PLS-DA模型校正集结果比原始光谱建模结果提高了1.59%, 预测集结果较原始光谱建模均未提高。
| 表7 De-trending预处理光谱特征波长建立的PLS-DA分类结果 Table 7 Classification results of PLS-DA model based on feature wavelengths of de-trending pretreated spectra |
利用Vis-NIR高光谱成像技术对完好和损伤状态(Ⅰ , Ⅱ , Ⅲ , Ⅳ 和Ⅴ 级)的灵武长枣进行快速识别检测。 在原始光谱建立的PLS-DA模型中, 模型中校正集结果为72.70%, 预测集结果为86.67%; 预处理后光谱建立的PLS-DA模型, 得到MSC-PLS-DA为最佳模型组合, 模型校正集准确率为76.19%, 预测集准确率为86.67%; 特征波长建立的模型中, 得到MSC-CARS-PLS-DA为最优模型组合, 校正集准确率为77.14%, 预测集准确率为89.52%。 因此, Vis-NIR高光谱成像技术可用于灵武长枣损伤等级的快速识别检测。
| [1] |
|
| [2] |
|
| [3] |
|
| [4] |
|
| [5] |
|
| [6] |
|
| [7] |
|
| [8] |
|
| [9] |
|
| [10] |
|
| [11] |
|
| [12] |
|
| [13] |
|
| [14] |
|