
小尺寸样品CARS图像信号分布实验研究
[李向召1  , 侯国辉
, 侯国辉1, 2, * , 黄志凡1 , 肖君军2 ]
, 侯国辉, 黄志凡|
|


通过设计实验与分析模型, 研究相干反斯托克斯拉曼散射成像对于样品尺寸小于系统点扩展函数尺寸的情况, 分析相干反斯托克斯拉曼散射图像周围的depth的形成原因。 分析过程首次引入轴向传输动态位移光线(此光线由相干体积元内轴心光线抽象出)对球形或柱形样品直径小于系统点扩展函数横向与轴向尺寸进行建模解析, 对于所建模型定量分析结果表明, 对于样品尺寸小于系统点扩展函数尺寸样品折射率调制了有效作用深度。 Gouy相移只是其表观现象, 是一个伴随性特征, 因为物理学中存在的另一个极端, 当样品尺寸足够小且具有相当的折射率, Gouy相移的作用近似为0, 此时, 样品周围的depth主要与样品的折射率及系统相干层析体积元内有效作用长度有关, 相干反斯托克斯拉曼散射参量信号, 具有自身的波矢匹配条件, 不仅有大小, 有方向, 而且还受到样品自身材料折射率的影响比较明显。 也就是对于参量过程波矢匹配条件是因, Gouy相移是伴随性特征。 自此, 通过相干反斯托克斯拉曼散射间接说明所用的紧聚焦参量信号成像过程, 正是因为波矢匹配条件的存在使二次信号继承了激发光的紧聚焦特性, 而拥有了继承性的Gouy相移, 结合实验结果采用物理学的极端假设表明, Gouy相移不是产生depth的主要原因, 主要原因是样品及周围的环境的折射率与系统相干层析体积元内有效作用长度之间共同作用的结果。 而实验结果与模型定量分析的结果相吻合, 此实验帮我们找到了影响CARS图像样品周围depth的成因机制, 对于其他小尺寸样品的参量成像结果的分析具有一定的借鉴意义。 通过设计实验, 结合定量模型分析, 首次明确造成小尺寸样品CARS图像周围的depth的真正原因, 此抽象模型的拓展性对纳观参量过程的分析具有得天独厚的优势。 抽象出的主能量光线动态位移模型成功分析纳观成像结果表明, 相干作用长度之内有效作用长度及其行进路径的过程论的主因分析方法是研究纳观作用机制的最佳方法。
Biography: LI Xiang-zhao, (1978—), Shenzhen Academy of Metrology and Quality Inspection e-mail: LiXZ@SMQ.com.cn
This paper investigates coherent conditions for smaller anti-Stokes Raman scattering imaging sample size than the system point spread function size and the reasons for depth around coherent anti-Stokes Raman scattering images using experimental design and analysis models. The axial transmission dynamic displacement light method, which subtracts axial light from the coherent volume element, is introduced to model and analyse lateral and axial dimensions for spherical or cylindrical samples with a smaller diameter than the system point spread function. The Gouy phase shift effect was approximately zero for small sample size and large refractive index. The main reason was the interaction between sample refractive index and the surrounding environment, and the system coherent tomographic volume element effective length. The obtained results apply only to CARS image analysis, where the sample size is smaller than the system point spread function, but it is also the first paper that clarifies the underlying reason for depth around CARS images using design experiments and quantitative model analysis. Successful nano-imaging analysis using axial transmission dynamic displacement light verified that the nano-action mechanism is similar to coherent action length, effective action length and its travel path.
Materials with high order nonlinear optical effects[1, 2] have become relatively common with ultrafast laser technology developments. Since, i.e., Coherent anti-Stokes Raman scattering (CARS) microscopic imaging has flourished on its application. Single-frequency CARS imaging[3, 4, 5] dominates imaging mainly because broadband CARS imaging[9, 10] technology developments are restricted by the availability of suitable light sources and detectors.
Broadband light source developments, typically based on photonic crystal fibres, are limited by the designed zero-dispersion point for photonic crystal fibres, ultra-fast femtoseconds laser pulse time-width, and CCD weak signal broadband spectrum detection technology. Finite element analysis and spectral broadening simulations[6] provide good guidance for photonic crystal fibre developments. Air-hole fibre parameters obtained by scanning electron microscope are photonic crystal fibres spectral broadening experiments to further verify photonic crystal fibres’ production and processing technology.
Production and processing technology improvements for large area array high-sensitivity detectors provide possible wide-spectrum signal detection. However, single-frequency CARS imaging systems have corresponding simulation analyses regarding suspended sample physical field distribution[7]. However, Parameter selection is poor, resulting in a deviation among related experiments[8]. For example, some previous studies attributed depth around CARS images completely to the Gouy phase shift (GPS), which has subsequently been shown to be inconsistent with GPS deduced by designed experiments, such as in this paper, and be only a concomitant feature of the title-focus microsystem.
Single-frequency CARS imaging systems use scanning galvanometers for back-facing detection systems with a dynamic beam. Models established under this system influence signal actual imaging distribution. Related theoretical and experimental studies have not identified what causes the depth to produce this result, resulting in influencing factors attributed to the GPS.
Broadband CARS[9, 10, 11, 12, 13] offers several advantages, but previous studies have only considered application and imaging speed. The CARS light beam is positive, and hence broadband images formed by moving sample point scanning are horizontally undistorted, due to using forward tight focusing imaging structure, with a scanning galvanometer which does not like E-CARS and requires explicit image distortion correction. Although K. I. Popov[8] proposed a reason for the depth, they were incorrect to attribute influences to GPS.
This paper shows that a moving sample CARS system is more suitable to analyse CARS signal images. To the best of our knowledge, using the nonlinear-optic concept, like coherent volume elements, coherence length, phase matching conditions and signal direction, etc. It is the first time to abstract axis transmission dynamic displacement light ray (close to the experiment) combined with our forward tight focus imaging system to analysed the generation reason of the CARS image in the condition of this paper. The reason for depth around the image is clearly explained from intuitive experimental analysis using semi-quantitative procedural deduction for the actual model employed in this paper.
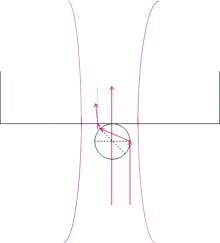
The experiment used dry polystyrene beads with somewhat smaller size than the system’ s lateral point spread function (PSF) and the samples were scattered on the cover glass to reduce analysis complexity. The analysis model was also based on this experimental design. Figure 1 shows the particular light beam propagation path with axial transmission dynamic lateral displacement along the coherent length dimension.
 | Fig.1 Effective propagation path length for dynamic displacement with extreme light on the axis |
The standard line has little effect since scattering dominates. Therefore, CARS signal intensity distribution in semi-classical theory can be expressed as[13]
where Ias is the anti-Stokes signal, χ (3) is third-order nonlinear polarizability including resonance and non-resonance, Δ
Here, ignoring the pair forward tight focus in-axis parfocal objective lens; the black circle represents maximum spherical sample diameter; the upper black outline area represents substrate; the long red arrow represents light transmission direction cross the centre of the sample; the blue two-way arrow length represents coherence length of the system; surrounding red outline represents the distribution line edge of the beam waist; the other red multiply arrowed line represents pump and signal light rays along the light transmission direction, and dashed line represents the normal line at the intersection position between air and sample interface.
The full coherent length l corresponding to the CARS signal of the full GPS in the sample can be expressed as
where λ P is pump light wavelength in a vacuum; λ S is the Stokes wavelength light, introduced in the air; and nP and nS are the sample refractive index of pump and Stokes, respectively.
GPS can be expressed as
where z is the propagation position and zf is the focus position.
System details used for the experiments[12, 13] were omitted due to space limitations, and this article focuses on appropriate experiment design and subsequent analysis.
Figure 2(a) shows a typical polystyrene bead (mean diameter=280 nm) CARS image, as used for the experiments. Detector exposure=50 ms, probe beam power at the sample=7 mW, and supercontinuum power=2.8 mW. Image horizontal and vertical dimensions=2.0 μm. We fitted the intensity distribution using a Gaussian function [Fig.2(b), dotted line] and obtained the full width at half maxima [FWHM=508.71 nm in Fig.2(b)].
 | Fig.2 CARS imaging results (a): Single 280 nm polystyrene bead; (b): Reconstructed image by summing over CARS signals at (2 870± 50) cm-1 |
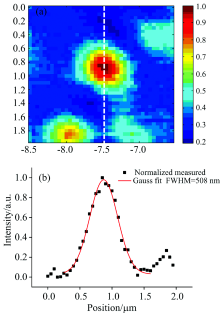
Figure 3(a) shows typical CARS imaging system outcomes for fused silica (diameter=300 nm) with detector exposure time=50 ms, probe beam power at the sample=28 mW, and supercontinuum power=22 mW.
 | Fig.3 CARS imaging for 300 nm SiO2 beads (a): (2 850± 50) cm-1 signal Normalized measured image; (b): Gaussian fit for FWHM Normalized measured |
Figure 3(b) shows the Gaussian fitted intensity distribution along the dashed line from Fig.3(a), with FWHM=508 nm. CARS is a parametric process, and hence the signal is affected by and inherits directional characteristics from the excitation light. The internal factor is the phase matching condition. Wave vector mismatch was determined by excitation light and substance characteristics; hence the generated optical signal has a specific propagation direction. Relationships between the forward and backward signal transmission strength and sample size have been widely discussed elsewhere[7]. Interaction length refers to the effective volume element length for coherent chromatography, i.e., the effective, coherent chromatography length when the sample is small.
GPS occurs in the ± λ region for monochromatic tight focus systems, leading to wave vector mismatch between pump and Stokes light. Since λ P=785 nm and λ S=1 013.3 nm in air, respectively, the corresponding coherence length in air=1 241.6 nm. We removed the main axis light length to simplify the analysis without affect overall outcomes, which can be combined with the axial transmission dynamic displacement model.
Phase mismatch in the sample due to refractive index dispersion at different wavelengths must also be considered. We considered the sphere centre to be coincident with the axial coherence length centre, air, and sample cover glass, to compare the depth formed by two spherical samples and base cover glass using Sellmeier’ s equation,
where n is the refractive index, λ is the wavelength, Bi and Ci are the Sellmeier coefficients determined by experience.
Coherence length for all non-air samples=880.2 nm, with silica refractive index=1.453 6 and 1.450 3 at the corresponding wavelengths. Hence sample length ratio in air=0.644 5. Following (1) for fused silica, the effective length submerged in the substrate=303.4 nm when the sample leaves the focal area laterally. Average fused silica refractive index=1.453, and hence corresponding full coherence length=881.8 nm. Maximum signal intensity occurs when the sample centre coincides with the optical axis.
At the other extreme, axial light coincides with the edge of the sample. Coherence length in the z direction does not change significantly for sufficiently small samples. Thus, sample refractive index≈ substrate refractive index, and the resulting depth is not significant. Average polystyrene refractive index=1.590, corresponding to full coherence length=805.8 nm. The refracted ray travels toward the sphere when the on-axis ray is tangent to the edge, and internal angles are the critical angles for total internal reflection, i.e., 43.60° and 38.97° , respectively, from scattering and optical path reversibility. Thus, propagation distance within the sphere=217.3 and 233.2 nm, respectively. Starting from the sphere centre, the remaining mutual axial light depth in the same material =290.9 and 262.9 nm, respectively, where the remaining 73.6 and 29.7 nm are subtracted from the working distance in the same material. The remaining action distance interacts with the substrate material after passing through the air. It holds when the sample is sufficiently small enough to ignore air layer distance effects between the spherical sample and substrate, with the remainder being distance between light and substrate and interactions between them.
The effective distance for on-axis light in the substrate is far from the sphere centre=140.9 nm. The lateral depth is due to the refractive index difference between the sample and surroundings, affecting effective signal volume depth (length) and hence changing the signal strength. The refractive index difference modulates the effective length change for forwarding transmitted light, resulting in a structure similar to depth.
Depth rings around SiO2 bead samples are not significant, indicating that the SiO2 bead refractive index was relatively close to the cover glass refractive index. The sample refractive index will modulate the excitation layer causing some axial displacement of the excitation position. The effective excitation signal change generates the observed ring due to refractive index modulation displacement in the effective plane for the transmission signal generated in the z direction. Due to this distance change, GPS is minimal for sufficiently small samples and/or sufficiently large refractive index.
Therefore, GPS is not the cause but rather is the parametric signal generation mechanism for phase matching. Whether the secondary emission signal is also parametric depends on the horizontal depth around the image. The two imaging results verify refractive index difference between the sample and substrate is the main reason for significant depth when spherical or cylindrical sample thickness is smaller than the lateral system point spread function size.
This paper employed 280 nm polystyrene beads, and 300 nm fused silica beads for forward tight-focus broadband CARS imaging. Dynamic axis displacement was used to transmit light and investigate the cause for depth around the CARS image for small samples. Experimental results verified that refractive index and effective length differences for the sample’ s microenvironment caused the depth around the sample.
Contribution from GPS were approximately zero for a sufficiently small sample and sufficiently large refractive index, whereas s from tomographic light entering the substrate were significant, with sufficient signals generated to form the surrounding depth.
Thus, we confirmed that the main reason for depth around CARS images for small samples was co-modulation with the effective action length in the coherence volume. GPS was caused by CARS parameter processing required to meet the vector phase condition, and the contribution to image signal distribution in the lateral direction was minimal.
This result took advantage of CARS inherent disorder and non-labelling to analyse other parametric imaging processes. Future studies will consider formation characteristics for large samples in large-scale CARS image signal distribution experiments.
| [1] |
|
| [2] |
|
| [3] |
|
| [4] |
|
| [5] |
|
| [6] |
|
| [7] |
|
| [8] |
|
| [9] |
|
| [10] |
|
| [11] |
|
| [12] |
|
| [13] |
|