

基于PCA-BP神经网络的光谱消光法颗粒粒径反演算法研究
[平力1  , 赵蓉
, 赵蓉1 , 杨斌1, * , 杨杨1 , 陈晓龙2 , 王莹1 ]
, 赵蓉, 杨杨|
|


光谱消光法广泛应用于颗粒粒径测量领域, 在利用光谱消光法对颗粒粒径进行反演的过程中, 由于颗粒的消光系数存在理论复杂、 计算繁琐、 收敛速度慢以及求解不稳定等问题, 很大程度上影响了整个反演过程的快速性和准确性。 且在众多波长的消光数据中, 存在较多重复冗余的信息, 也很大程度上增加了反演算法的时间。 针对光谱消光法粒径反演算法计算繁琐、 反演效率低的问题, 提出了基于主成分分析(PCA)和BP神经网络的光谱消光颗粒粒径分析方法。 基于Mie散射理论对不同粒径、 不同波长下的光谱消光值进行了仿真计算, 通过对光谱消光数据集的主成分分析及各个波长综合载荷系数的计算, 实现了最优特征波长的选取, 利用降维后的光谱消光数据训练了PCA-BP神经网络模型, 并利用该网络模型计算了粒径颗粒分布。 通过仿真计算, 比较了PCA-BP神经网络模型与传统的BP神经网络模型的预测精度, 并分析了波长数目对两种神经网络模型预测结果的影响。 针对训练得到的PCA-BP神经网络模型开展光谱消光法粒径参数反演算法的验证实验, 搭建了光谱消光法颗粒粒径参数测量实验系统, 测量了粒径范围在0.5~9.7 μm内的6种不同粒径参数的聚苯乙烯标准颗粒。 仿真和实验结果表明: 基于主成分分析方法可确定各个波长向量之间的相关性, 利用综合载荷系数选取最优特征波长对应的消光值对整体的光谱数据具有较好的代表性, 可实现光谱数据的降维。 相比传统的BP神经网络模型, 基于PCA-BP神经网络模型的颗粒粒径分布的分析方法预测精度更高, 对于较分散颗粒系的分布参数的预测有更加明显的优势。 而且, 被选取的波长数较少时, PCA-BP神经网络模型依然有较高的预测精度。 利用训练好的PCA-BP神经网络模型对颗粒粒径参数进行实验验证, 预测结果可瞬时输出, 颗粒粒径分布误差在5%以内, 验证了该算法的可行性。
Biography: PING Li, (1993—), Ph D. candidate, University of Shanghai for Science and Technology e-mail: usst_pl@163.com
Spectral extinction method is widely used in the field of Particle Size Distribution (PSD) measurement. During the inversion process of particle size by spectral extinction method, the speed and accuracy of the whole inversion process are greatly affected due to the problems of complex theory, complicated calculation, slow convergence speed and unstable solution of particle extinction coefficient. Moreover, in the extinction data of many wavelengths, there is more repeated redundant information, which also greatly increases the time of the inversion algorithm. Aiming at the problems of complicated calculation and low inversion efficiency of spectral extinction PSD inversion algorithm, a spectral PSD analysis method based on Principal Component Analysis (PCA) and Back Propagation (BP) neural network was proposed. Based on Mie scattering theory, the spectral extinction values under different particle sizes and wavelengths were simulated and calculated. Through the PCA of the spectral extinction data set and the calculation of the comprehensive load coefficient of each wavelength, the optimal characteristic wavelength was selected. The PCA-BP neural network model was trained by using the reduced spectral extinction data, and the PSD was calculated by using the network model. Through simulation calculation, the prediction accuracy of PCA-BP neural network model was compared with the traditional BP neural network model, and the influence of wavelengths number on the prediction results of the two neural network models was analyzed. Based on the trained PCA-BP neural network model, the verification experiment of spectral extinction inversion algorithm of PSD was carried out, and an experimental system for PSD measurement by spectral extinction method is established. Six types of standard polystyrene particles with different particle size parameters ranging from 0.5 to 9.7 μm were measured. Simulation and experimental results show that the correlation between each wavelength vector can be determined based on the PCA method, and the extinction value corresponding to the optimal characteristic wavelength can be selected by using the comprehensive load coefficient, which has good representativeness of the overall spectral data and can realize the dimensionality reduction of spectral data. Compared with the traditional BP neural network model, the analysis method of PSD based on the PCA-BP neural network model has higher prediction accuracy and has more obvious advantages for predicting distribution parameters of more dispersed particle systems. Moreover, when the number of selected wavelengths is small, the PCA-BP neural network model still has high prediction accuracy. The trained PCA-BP neural network model is used to verify the particle size parameters experimentally. The PSD prediction results can be output instantaneously, and the error is within 5%, which verifies the algorithm’s feasibility.
PSD is an important evaluation index in industrial production, energy utilization, environmental monitoring and other fields. The non-intrusive optical measurement plays a key role in PSD measurement[1], such as angle scattering method, spectral extinction method, dynamic light scattering method and light fluctuation method. Among them, due to the advantages of simple principle, convenient measurement and wide measuring range, spectral extinction method is widely used in PSD measurement technology[2], such as monitoring of polymer polymerization process[3], diagnosis of engine combustion[4], particle size measurement of wet steam in turbine[5], monitoring of atmospheric environment[6] and other fields.
In spectral extinction measurement, the light beam passes through the area to be measured containing particles. Due to scattering and absorption of particles, the intensity of transmitted light passing through the measuring area is attenuated. The attenuation degree of transmitted light at different wavelengths is related to particle size, quantity and refractive index of particles[7]. Therefore, according to the attenuation degree of light intensity at different wavelengths, the parameters of particles can be calculated inversely. Classical PSD inversion algorithms based on spectral extinction method mainly include least square algorithm, regularization algorithm, Phillips-Twomey algorithm, Chahine algorithm, etc. However, these algorithms have complicated calculation of objective function and derivative, poor anti-noise ability and easy local optimal solution of inversion results[8, 9, 10, 11]. The development of intelligent optimization algorithms with accurate inversion results and strong anti-noise capability has gradually attracted the attention of researchers. Xu[12] proposed a spectral extinction particle measurement algorithm based on a Genetic Algorithm (GA). By setting the appropriate population size and the range of genetic operators, the problem of optimal local solution in the inversion results was solved, and the inversion of the optimal global solution of PSD was realized. Wang[13] proposed to apply the pattern search algorithm to theconstruct of PSD in independent modes, andat the same time introduced the Tikhonov smoothing function to construct the algorithm’ s objective function. Compared with the traditional inversion algorithm, the algorithm has greatly improved its stability and anti-noise capability. Qi[14] used an improved particle swarm optimization algorithm to measure aerosol size distribution, which has a faster convergence rate and higher accuracy in a smaller algebraic range.
Compared with traditional algorithms, intelligent algorithms have better global search capability and anti-noise capability. However, some algorithms still have slow evolution speed and long calculation time, which is not conducive to the development of online measurement technology of particle size parameters[15]. The main reasons for the low efficiency of spectral extinction particle size inversion algorithm include the following two aspects: (1) How to select the optimal wavelengthamong many available wavelengths to eliminate repeated information in spectral data; (2) In the process of PSD inversion, the extinction coefficient of particles has problems such as complicated calculation, slowconvergence speed and unstable solution[16].
Therefore, this paper proposesa spectral extinction particle size analysis method based on the PCA-BP neural network. Through the change of the principal component of the spectral data, the load coefficient of each wavelength on the principal component of the spectral data is analyzed. Then the wavelength containing more information is selected to realize the dimensionality reduction of spectral data. Based on Mie scattering theory, the spectral extinction values at different particle sizes and wavelengths are simulated and calculated, and they are used as spectral extinction samples for multi-layer feed forward artificial neural network training of error reverse propagation. After repeated learning and training, the network parameters corresponding to the minimum error are determined, and the particle size parameters of the spectral extinction method are predicted by using the network, which can realize fast and accurate calculation of PSD. Therefore, an experimental system for particle size measurement by spectral extinction method was set up, and standard polystyrene particles with particle sizes ranging from 0.5~9.7 μm were measured.
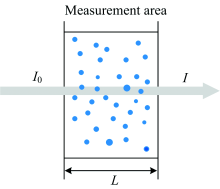
The basic principle of measuring PSD by spectral extinction method follows Lambert-Beer law. As shown in Fig.1, when a beam of parallel incident light I0 passes through a measurement area containing uniform suspended particles, the transmitted light intensity Iwould be attenuated to a certain extent due to the scattering and absorption of the particles, and the attenuation degree is related to the particle size and concentration. If m the particle to be tested is a poly-disperse system composed of individual particles with a number of N, its extinction value is
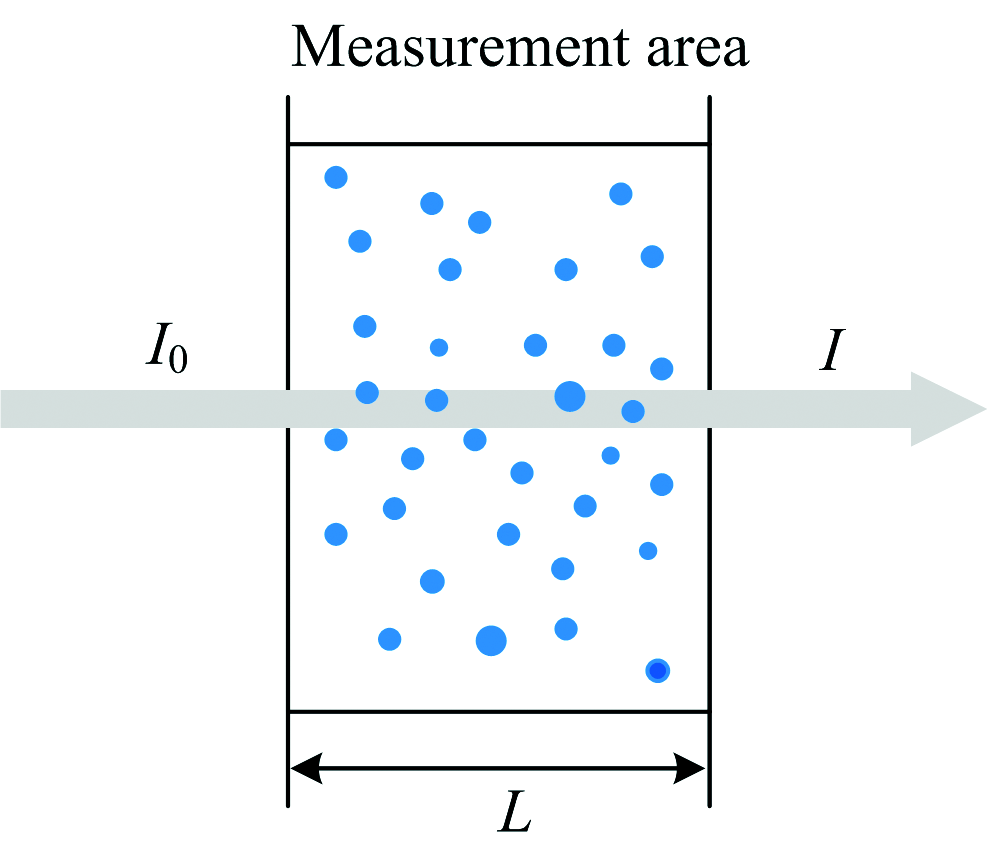 | Fig.1 Schematic diagram of extinction measurement principle |
where (I/I0
The particle distribution model adopted in this paper is Rosin-Rammler distribution, and the distribution function can be expressed as follows
where
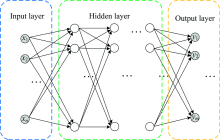
The artificial neural network uses the interaction of neurons to complete information processing, including forwarding propagation of data signals and back-propagation of errors. The input layer reaches the output layer through one or more hidden layers, and the weightcoefficients and offset coefficient in the network is continuouslyadjusted according to the error between the output layer value and the target value to realize theiteration of the algorithm. The BP neural network model is shown in Figure 2.
 | Fig.2 BP Neural network model |
In the process of PSD analysisbased on neural networks, spectral extinction data, as the input layer variable of the neural networks, has a great impact on the accuracy of network training results and the complexity of network training. Less spectral dimension would lead to the loss of important information in extinction signals, which results in lower accuracy of the trained network. Too many spectral dimensions would cause input variables to contain more redundant information, making the network more complex and increasing the difficulty of training.
This paper proposes a PSD inversion algorithm combining PCA and BP neural network based on artificial neural network. Based on the principle of PCA, the algorithm analyzes theextinction values at different wavelengths and constructs principal components. The comprehensive load coefficient is defined as an index to evaluate the total mapping information of each wavelength in the principal component. Therefore, redundant wavelengthsare eliminated, the optimal characteristic wavelength of the spectrum is selected, and the dimension reduction of spectral extinction datais realized.
Spectral extinction values ase used as input data sets for PCA
where xi, j denotes the spectral extinction value at the particle size grade of i and the wavelength of j, p is the number of particle size grades, and M is the number of wavelengths. The standardized matrix of data set X can be calculated as
where μ and σ are the standard deviation vector and mean vector of the original data set X respectively, which can be expressed as
The correlation coefficient between each wavelength vector of the standardized matrix can be calculated as follows
where ρ a, b is the correlation coefficient of the standardized spectral extinction data at wavelength a and b, and the correlation coefficient matrix R can be obtained
By solving the eigenroot γ 1, γ 2, …, γ M of the correlation coefficient matrix R and the corresponding eigenvector T1, T2, …, TM, the principal component F can be calculated by multiplying the eigenvector and the standardized matrix.
Since the principal component is a linear representation of each eigenvector, there is no correlation between each principal component. When the cumulative contribution rate of the current N principal components is greater than 99%, the first N unrelated principal components carry more than 99% of the information of the original data.
Each element tj, m (m=1, 2, 3, …, M) in the eigenvector Tj corresponding to principal component Fj is the load coefficient of Fj at each wavelength, and the magnitude of tj, m reflects how much spectral information is mapped to the j-thprincipal component at the i-th wavelength. A larger load coefficient indicates that the spectral information of this wavelength occupies a larger weight in the principal component. Although the first N principal components contain most of the information of the original spectral data, they change the physical meaning of the spectral extinction value. The load coefficient tj, m can retain the original data’ s physical meaning and eliminate the redundant information in the spectral data to the greatest extent. Therefore, the load coefficient is used as the main basis for wavelength selection in this paper.
According to the load coefficient tj, m and eigenvector γ j of each principal component, the comprehensive load coefficient vj is defined, as shown in Equation (6). vj reflects the total mapping information of each wavelength in the first N principal components with a higher contribution rate. The wavelength corresponding to the larger comprehensive load coefficient is selected as the optimal characteristic wavelength after spectral data dimension reduction.
The extinction value (x1, x2, …, xn) of the optimal characteristic wavelength after dimension reduction is taken as the input layer and sent to the BP neural network. The neuron model of the first hidden layer can be expressed as follows
where xj is the extinction value at the j-th wavelength, wi, j represents the weight coefficient corresponding to the i-th neuron unit, bi is the bias threshold of the neuron unit, n is the wavelength number of the spectral data after dimension reduction, k is the number of neurons in this layer, and ui is the sum of the linear combination of neuron input signals and the bias threshold.
In the neural network, the excitation function ϕ (u) is needed to express the nonlinear function of the network. The excitation function used in this paper is the sigmoid function
Take ϕ (u) as the output value of the neurons in this layer and send it to the next layer of the neural network until the output layer outputs (y1, y2, …, ym), to realize feed-forward propagation of data in the BP neural network.
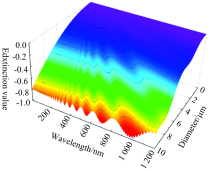
Since the range of particle size measurement by spectral extinction method is mainly 0.1~10 μm[1], the extinction values of particles with a particle size range of 0.1~10 μm are simulated based on the Mie scattering theory. The relative refractive index m of particles is 1.2, and the spectral extinction values at each wavelength are shown in Fig.3. It can be seen that the extinction value has a certain oscillation with the wavelength distribution, which causes the problem of multi-value of extinction value. Moreover, the oscillation of extinction value also increases with the rise of particle size, which also causes complicated calculation and large error to the traditional inversion algorithm.
 | Fig.3 Distribution of extinction values with particle size and wavelength |
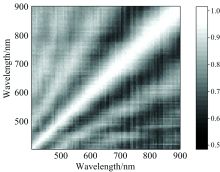
According to the data set of spectral extinction values obtained by simulation, 100 wavelengths are selected in the wavelength range of 400~900 nm, and 100 particle sizesare selected in the particle size range of 0.1~10 μm. The corresponding extinction values are used as the original data for PCA. After standardizing the original extinction value data, the correlation coefficient of each wavelength vector is calculated to obtain the correlation coefficient matrix as shown in Fig.4. It can be seen that the correlation coefficients between adjacent wavelengths are relatively close, and the distribution of correlation coefficient with wavelengths has a certain periodicity. However, the discrimination degree between the correlation coefficients of extinction value is relatively fuzzy, and the representative wavelength cannot be directly obtained, so the correlation coefficient matrix needs to be further analyzed.
 | Fig.4 The correlation coefficient matrix of spectral extinction value |
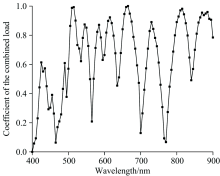
The principal component of the extinction data can be obtained by solving the eigen root and eigenvector of the correlation coefficient matrix. Each principal component is a linear combination of each wavelength vector and is independent of each other. Among them, the contribution rates of the first three principal components are 60.13%, 38.36% and 0.76% respectively, and the cumulative contribution rates are 60.13%, 98.49% and 99.25% respectively. Thus, the first three principal components already contain most of the information in the spectral data. The comprehensive load coefficients of each wavelength for the first three principal components are analyzed, as shown in Fig.5. It can be seen that the load coefficients of each wavelength are obviously distinguished. The larger the load coefficients corresponding to the wavelength are, the more mapping information the wavelength has in the principal components and ismore representative. The wavelength with larger comprehensive load coefficients is taken as the optimal characteristic wavelength to realize the dimension reduction of spectral data.
 | Fig.5 The distribution of the comprehensive load coefficient with the wavelength |
When 100 feature size parameters
The selection method and number of wavelengths greatly influence the training the efficiency of neural network model and the accuracy of predicted values. The traditional spectral extinction particle size measurement based on BP neural network mainly adopts random selection method and uniform selection method of the whole band in wavelength selection. In order to compare the prediction results of the two network models, this paper adopts the wavelength selection methods of random selection and feature optimal selection respectively, calculates the corresponding extinction value data according to the selected bands, uses them to train the neural network model, and analyzes the prediction accuracy of the neural network model.
The traditional BP neural network and PCA-BP neural network are used to compare the prediction results of different feature size parameters and distribution parameters respectively. As shown in Table 1, PCA-BP neural network has a higher prediction accuracy than the traditional BP neural networkfor the prediction results of characteristic size parameters of particle system distribution. The average relative error of the feature size parameters predicted by BP neural network model is 6.45%, while the average relative error of predicted by PCA-BP neural network model is only 2.25%.
| Table 1 Prediction results of different particle sizes |
Table 2 shows the prediction results of distribution parameters. It can be seen that the prediction accuracy of PCA-BP network model for distributed parameters is also significantly higher than that of BP neural network, and the average relative error decreases from 11.87% to 3.84%. Especially for particles with small distribution parameters, the PCA-BP neural network has obvious advantages. The distribution of the particle systems is relatively dispersed, and the proportion of the number of particles with different particle sizes is relatively uniform due to the overlapping extinction effects of particles with different particle sizes on various wave bands, the prediction difficulty increases. By selecting the optimal characteristic wavelength, the information of spectral extinction data can be obtained to the greatest extent, and the trained PCA-BP neural network model also has higher prediction accuracy.
| Table 2 Predictionresults of different distributed parameters |
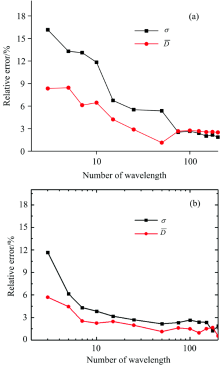
The number of wavelengths has a certain effect on the prediction accuracy of network models. By setting different wavelength numbers, the BP neural network and PCA-BP neural network are trained respectively using extinction value data. The expected values of different distribution parameters are predicted to calculate the average relative error of network output values. The results are shown in Figure 6.
 | Fig.6 Influence of the number of wavelengths on the estimation accuracy of the neural network (a): BP neural network; (b): PCA-BP neural network |
The prediction accuracy of the two network models increases with the rise of the number of wavelength selections, while there is a threshold of wavelength selection number. After the threshold is exceeded, the inversion accuracy does not improve significantly. When training the network, if the number of wavelengths is too small, the prediction results will have large errors; if the number is too much, although the reliability of the network can be improved, the spectral data processing capacity will increase, and the running time of the computer will become longer. The threshold value of wavelength selection number should be adopted, which can ensure the measurement accuracy and improve the calculation speed and is conducive to realize the real-time online measurement of particle size.
The wavelength selection threshold of the BP neural network is about 25. When the number of wavelength selections exceeds 25, the reduction of relative error is no longer obvious. However, the threshold value of the PA-BP neural network is around 7, indicating that the PCA-BP neural network can train a network model with higher prediction accuracy with fewer wavelength numbers. It can greatly improve the training efficiency of the network and provide better technical support for the field of online measurement which is limited by the number of wavelengths.
A PSD measurement systemis built based on the principle ofparticle size measurement by spectral extinction method, as shown in Fig.7. The system consists of stabilized power supply, halogen light source, converging lens, diaphragm, cuvette, collimating lens, spectrometer and computer. The stabilized power supply is used to adjust the brightness of the halogen light source. After the light beam emitted by the halogen light source is converged by the converging lens, it passes through the diaphragm to control the width of the light beam, to ensure that the light beam in the measured area is parallel light with higher intensity. The light beam passing through the measured area is received by the collimating lens and transmitted to the spectrometer to measure the light intensity attenuation information of the area to be measured. The spectrometer model is Ocean Optics HR-4000 optical fiber spectrometer, the light source is Philips G4 halogen light source, and the rated power is 20 W; The standard particles are 6 kinds of polystyrene standard particles with nominal particle sizes of 500 nm, 700 nm, 900 nm, 2.1 μm, 5.1 μm and 9.7 μm produced by Haian Hongmeng.
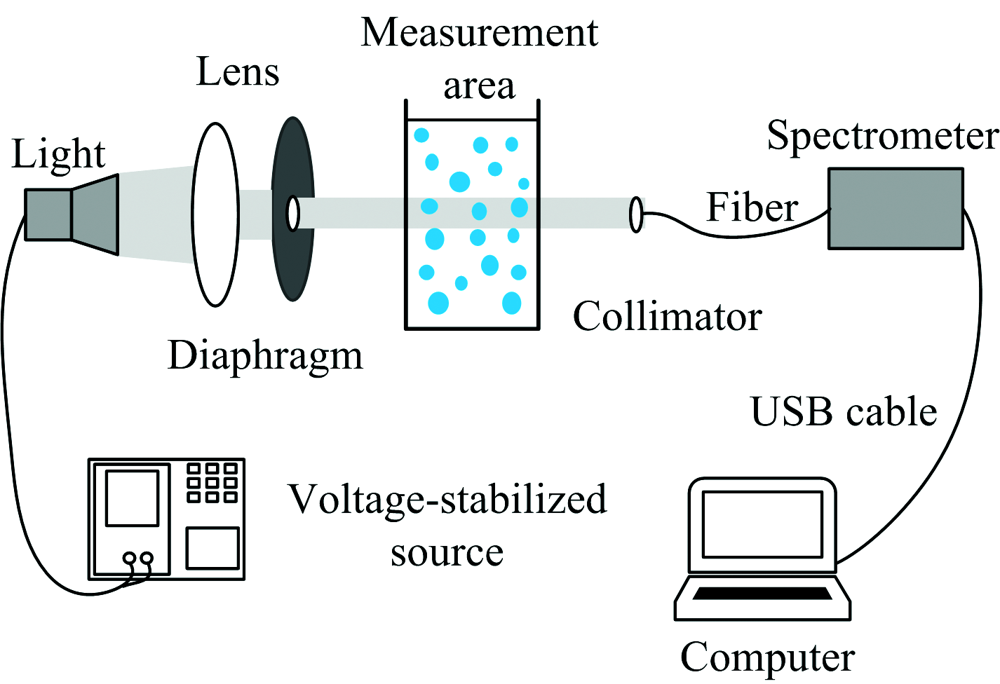 | Fig.7 Experimental system for PSD measurement by spectral extinction method |
The BP neural network model trained by the spectral extinction data, is used to carry out inversion prediction on the particle size parameters of the measured standard particles with six different particle sizes. The results are shown in Figure 8. The theoretical distributions curve is measured by laser diffraction PSD analyzer, and the prediction results of PCA-BP neural network and Nonlinear Least Squares (NLS) algorithm areanalyzed by spectral extinction measurement results. Both algorithms have high accuracy, while the error of the neural network prediction results is large for the prediction results of 9.7 μm, which is due to the large degree of oscillation of extinction value of each wavelength with the increase of particle size, causing certain error to the inversion of particle size. Moreover, the selected wavelength is mainly concentrated in 400~900 nm, and the transmission light signal difference is small for larger particles. However, the measurement error is still within 5%, indicating that this method still has good applicability for larger particles with a size close to 10 μm. Compared with the NLS algorithm, the PCA-BP neural network has higher prediction efficiency. After training, the network can output prediction results quickly and is more suitable for online measurement.
 | Fig.8 Prediction results of PSD (a): 500 nm; (b): 700 nm; (c): 900 nm; (d): 2.1 μm; (e): 5.1 μm; (f): 9.7 μm |
Aiming at the problems of complicated calculation and low inversion efficiency of spectral extinction particle size algorithm, a particle size analysis method based on PCA-BP neural network is proposed. Based on Mie scattering theory, the distribution of extinction value with wavelength of different particle sizes is theoretically calculated. The extinction data set of optimal characteristic wavelength is taken as sample data to train the neural network model, and the prediction results are compared with those of the traditional artificial neural network model. The algorithm is verified by experimental measurement, and the results show that:
(1) Based on the PCA, the correlation between each wavelength vector can be determined, and the extinction value corresponding to the optimal characteristic wavelength can be selected by using the comprehensive load coefficient, which has good representativeness for the overall spectral data and can realize the dimensionality reduction of spectral data.
(2) Compared with the traditional BP neural network model, the PSD analysis method based on the PCA-BP neural network model has higher prediction accuracy and has more obvious advantages in predicting the distribution parameters of the more dispersed particle systems. Moreover, the PCA-BP neural network model still has high prediction accuracy when the selected wavelengths are relatively small.
(3) An experimental measurement system for particle size parameters is established based on the measurement principle of the spectral extinction method. The spectral extinction values of 6 standard particles in the range of 0.5~9.7 μm are measured. The trained PCA-BP neural network model is used to predict the particle size parameters. The prediction results could be output instantaneously with an error of less than 5%, which verifies the algorithm’ s feasibility.
| [1] |
|
| [2] |
|
| [3] |
|
| [4] |
|
| [5] |
|
| [6] |
|
| [7] |
|
| [8] |
|
| [9] |
|
| [10] |
|
| [11] |
|
| [12] |
|
| [13] |
|
| [14] |
|
| [15] |
|
| [16] |
|
| [17] |
|