


一种快速测量共聚焦X射线分析装置探测微元尺寸方法
[孙学鹏1, 2  , 张晓芸
, 张晓芸1, 2 , 邵尚坤1, 2 , 王亚冰1, 2 , 李惠泉1, 2 , 孙天希1, 2, * ]
, 张晓芸]
|
|


作者简介: 孙学鹏, 1990年生, 北京市辐射中心助理研究员, 北京师范大学核科学与技术学院博士研究生 e-mail: 1264973580@qq.com
共聚焦X射线荧光技术是一种无损的三维光谱分析技术, 在材料, 生物, 矿物样品分析, 考古, 证物溯源等领域具有广泛应用。 共聚焦X射线荧光谱仪的核心部件为两个多毛细管X光透镜。 一个为多毛细管X光会聚透镜(PFXRL), 其存在一后焦点, 作用是把X光管所发出的发散X射线会聚成几十微米大小的高增益焦斑。 另一透镜为多毛细管X光平行束透镜(PPXRL), 其存在一几十微米大小前焦点, 置于X射线能量探测器前端, 其作用是接收特定区域的X射线荧光信号。 在共聚焦X射线荧光谱仪中, PFXRL的后焦点与PPXRL的前焦点重合, 所形成的区域称作探测微元。 只有置于探测微元区域的样品能够被谱仪检测到, 使样品与探测微元相对移动, 逐点扫描, 便能够对样品进行三维无损的X射线分析。 探测微元的尺寸决定共聚焦X射线荧光谱仪的空间分辨率, 因此精确测量谱仪的探测微元的尺寸是非常重要的。 如
, ZHANG Xiao-yun
Confocal X-ray fluorescence is a directly non-destructive analysis technique with spatial resolution, widely used in materials, biology, mineral sample analysis, archaeology, evidence traceability and other fields. The confocal X-ray fluorescence spectrometer work is based on a polycapillary X-ray lens. A polycapillary focusing X-ray lens (PFXRL) attached to the X-ray tube is used to focus the divergent X-ray from the X-ray tube to the output focal spot with dozens of micron diameter and high power density gain. A polycapillary parallel X-ray lens (PPXRL) with an input focal spot placed on the front of the silicon drift detector is used to receive the fluorescence signal from the specific region. The overlap region of the output focal spot of the PFXRL and the input focal spot of the PPXRL in the confocal X-ray fluorescence spectrometer is called probe volume. Only the sample in the probe volume can be detected. The spatial information of the sample can be obtained by the relative movement of the probe volume and sample point by point. The size of the probe volume determines the spatial resolution of the confocal X-ray fluorescence spectrometer. Thus, it is significant to measure the size of the probe volume. The shape of the probe volume is similar to an ellipsoid. The size of the probe volume can be expressed as the horizontal resolution X, Y and the depth resolution Z, as showni n
共聚焦X射线荧光技术是一种直接的具有三维空间分辨能力的谱学分析方法。 与传统的微区X射线荧光分析技术相比, 传统的微区X射线荧光分析技术只能对样品表面进行分析, 共聚焦X射线荧光技术可以对不规则样品的任意空间位置进行X射线光谱分析, 是获取物体微区信息的有力工具。 共聚焦X射线荧光技术在材料、 环境、 地质、 生物、 考古等领域具有广泛的应用[1, 2, 3, 4, 5, 6]。
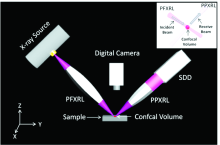
共聚焦X射线荧光分析技术的诞生得益于多毛细管X光透镜的发展, 此技术是由毛细管X光透镜的发明者前苏联科学家Kumakhov团队于1990年提出[7]。 如图1所示, 为共聚焦X射线荧光分析装置工作原理示意图。 在装置的激发道放置一个会聚透镜, 用于会聚光源发出的发散X射线成微焦斑。 在激发道常用的透镜是多毛细管X光会聚透镜(polycapillary focusing X-ray Lens, PFXRL), 有时也会采用单毛细管X光透镜, Kirkpatrick-Baez镜或者折射透镜[8, 9, 10]。 在探测道都是采用多毛细管X光平行束透镜(polycapillary parallel X-ray lens, PPXRL)和探测器耦合, PPXRL存在一前焦点, 能够接收置于前焦点区域样品的特征X射线光谱信号。 PFXRL存在一后焦点, 当PPXRL的前焦点和PFXRL后焦点重合, 其重合区域称为探测微元, 只有置于探测微元区域的样品才能够被分析。 为了得到样品的三维X射线荧光分析结果, 可以将样品置于三维调节架相对于探测微元移动, 探测微元对样品待检测区域进行逐点扫描, 半导体探测器与电脑相连便可以获得样品的空间信息。 共聚焦X射线荧光装置可以开展三维共聚焦X射线荧光光谱分析(three-dimensional micro X-ray fluorescence, 3D-XRF), 三维共聚焦X射线衍射分析(three-dimensional micro X-ray diffraction, 3D-XRD), 三维共聚焦X射线散射分析(three-dimensional micro X-ray diffraction scattering, 3D-XRC)和共聚焦X射线成像[1, 11, 12, 13, 14]。
 | 图1 共聚焦X射线分析装置示意图Fig.1 Schematic of the confocal X-ray instrument |
探测微元形状近似于椭球体, 如图1所示, 其尺寸通常采用水平方向直径X, Y和垂直方向直径Z所表征。 探测微元的尺寸是共聚焦X射线荧光装置的重要性能参数, 对样品的分析结果有着决定性的影响。 在共聚焦X射线荧光分析装置用于对样品进行3D-XRF分析时, 探测微元的尺寸决定分析结果的空间分辨率。 2013年, 彭松等利用共聚焦X射线荧光装置测量了材料镀膜的厚度, 在此研究中, 共聚焦装置的探测微元尺寸为材料镀膜厚度测量的前提条件[4]。 2014年, Sun等采用3D-XRD技术测量多晶材料的晶粒尺寸, 利用该方法测量晶粒尺寸的下限由装置的探测微元尺寸所决定[15]。 在共聚焦X射线荧光分析技术用于样品元素定量分析时, 探测微元内样品的吸收效应是必须考虑的因素[16]。 因此, 精确测量共聚焦X射线荧光装置探测微元的尺寸对于其应用是非常重要的。 目前, 通常采用金属细丝或金属薄膜通过刀口扫描的方法测量谱仪探测微元尺寸[17]。 为了使金属细丝可以精确地从三个维度测量探测微元尺寸, 金属细丝直径要小于探测微元尺寸。 金属细丝和探测微元都是数十微米级别的尺寸大小, 很难把金属靠近探测微元。 为了得到探测微元在不同X射线能量下尺寸变化曲线, 要采用多种金属细丝测量。 因此, 采用金属细丝比较耗费时间。 采用金属薄膜可以很方便地测量探测微元的深度分辨率Z, 但是当测量水平分辨率X, Y时, 由于金属薄膜与PPXRL接收方向平行, 而难以准确测量。 本文提出一种基于由多个细金属丝平行粘贴在平整纸板所构成特殊样品用于快速测量共聚焦X射线荧光装置探测微元尺寸的方法。
如图1所示为共聚焦X射线分析装置示意图, 在装置激发道, PFXRL用于会聚由X射光管发出的发散X射线至其后焦点处。 装置所用X射线光源为钼靶微焦斑光源(XTG UltraBright Microfocus X-ray Source, Oxford, USA), 光源在20 kV工作电压下焦斑大小为16.5 μm, 最大工作功率为50 W。 实验中所用PFXRL长度、 前焦距和后焦距分别为52.9, 57.4和16.4 mm。 在探测道所用的X射线硅漂移探测器(silicon drift detector, SDD)能量分辨率为145 eV (5.9 keV)。 实验中所用PPXRL的长度和前焦距分别为18.4和14.9 mm。 如装置示意图所示, PFXRL与PPXRL中轴线处于与地面垂直平面内, 并且相互垂直处于共聚焦状态, 在进行样品分析时透镜及其所形成的探测微元保持静止, 样品相对探测微元运动。 带动样品相对探测微元做三维扫描的为电动样品调节平台(DS102 Series, SURUGA SEIKI, Japan)。 电动样品平移台由三个步进电机组成, 通过控制器与电脑连接。 步进电机的最小步距为0.5 μm。 此外, 我们实验室使用Delphi语言为电动样品台编写了自动控制软件, 可以实现特定区域的自动扫描。 一台焦距可调节的显微摄像机放置在电动平移台上方, 用于观察探测微元在样品的位置。 显微摄像机和电脑相连接, 视野中十字叉丝中心为探测微元位置。
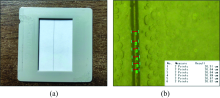
图2(a)是本实验中用于共聚焦X射线分析装置探测微元尺寸测量而制作的样品。 样品主要包括三部分: 样品架, 平整纸板和金属细丝。 金属细丝拉直使用透明胶带粘在平整的纸板表面, 带有金属细丝的平整纸板固定在样品架上。 由于探测微元尺寸随X射线能量变化, 为了得到探测微元尺寸随能量变化曲线, 实验中使用不同金属细丝: 钛, 铬, 铁, 镍, 铜和锆。 金属细丝直径约为20 μm。
 | 图2 (a)探测微元测量所用特制样品; (b)铁金属细丝显微镜照片Fig.2 (a) An iron wire stick on a paper by scotch tape used to measure the confocal volume; (b) Zoomed image of the iron wire captured by a digital microscope |
在使用刀口扫描方法测量探测微元尺寸前, 需要将金属细丝放置在探测微元附近。 常规只使用金属细丝, 即使有摄像机辅助, 将几十微米的细丝放置在直径几十微米大小的探测微元附近也非常耗费时间。 本实验采用特制样品, 可先令附有金属细丝的平整纸板向探测微元移动。 当SDD接收到如图3(b)所示带有钙元素特征光谱信号时(纸张中含有钙元素), 说明探测微元位于平整纸板的表面。 带有金属细丝的平整纸板垂直于两个透镜中轴线所确定平面, 因此金属细丝和探测微元位于水平平面。 移动金属细丝靠近探测微元, 当SDD出现如图3(d)所示同时含有钙元素和铁元素特征谱线时, 说明金属细丝已靠近探测微元。
 | 图3 调节探测微元至金属细丝附近Fig.3 Process of the overlapping the iron wire and the confocal volume of the confocal X-ray instrument |
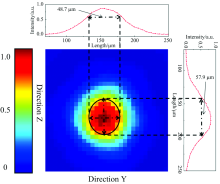
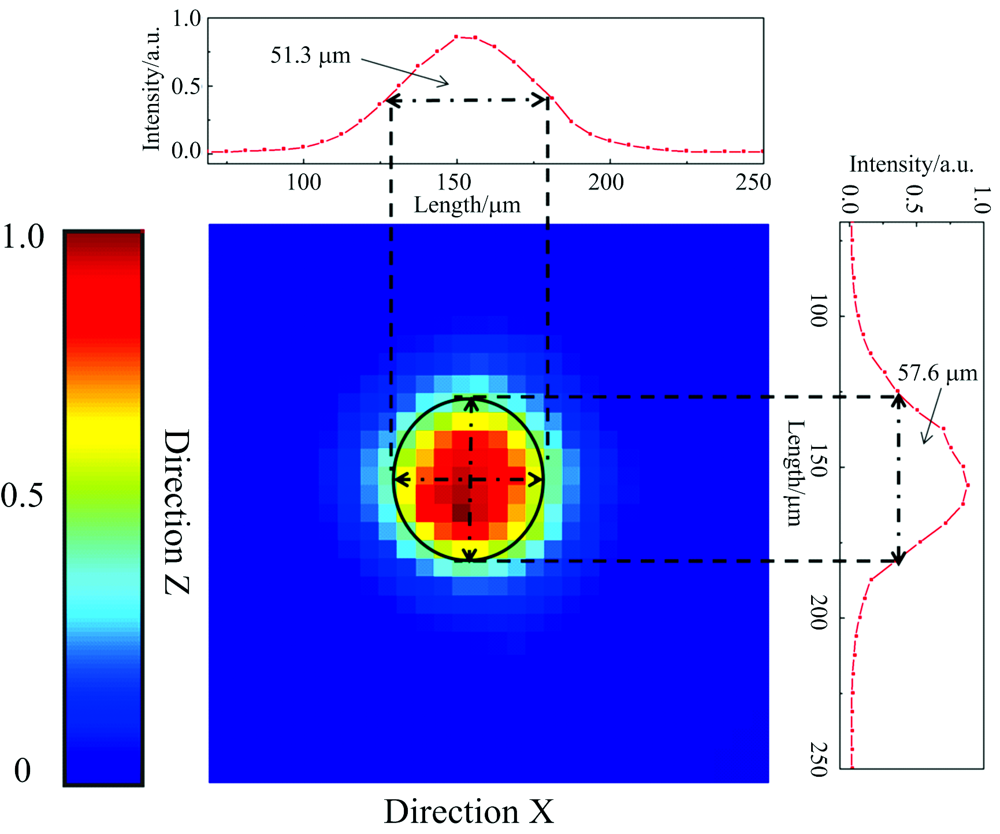
共聚焦X射线分析装置探测微元形状类似椭球体, 其光强分布沿各个轴向为高斯分布[18]。 探测微元的尺寸定义为沿X, Y和Z轴方向光强强度高斯分布曲线半高宽(full width at half maximum, FWHM), 使用金属细丝采用刀口扫描的方法可以获得。 探测微元尺寸与扫描曲线FWHM存在如式(1)关系[19]
式(1)中, Df为探测微元直径, Dm为金属细丝直径。 如图4所示, 为了获得Y-Z平面探测微元光强分布, 金属细丝与X轴方向平行, 沿图中所示之字形路径逐点扫描。 本实验中, X光源工作电压为30 kV, 电流为100 μA。 电动样品平移台步进电机步距为5 μm。 每个点测量时间为5 s。 金属细丝每扫描一个点, 控制电脑都会存储此点的坐标和SDD所获得的光谱数据。 如图5为使用直径为20 μm金属铜细丝平行X轴扫描探测微元Y-Z平面而获得的Cu-Kα 光谱强度分布。 通过焦斑中心Y和Z轴方向铜细丝刀口扫描曲线半高宽对应着探测微元Y和Z方向直径。 根据图5所示数据处理结果可知, 在入射X射线能量为8.04 keV时, Y和Z方向扫描曲线FWHM分别为48.7和57.9 μm, 通过式(1)计算可得探测微元Y和Z方向直径分别为44.4和54.3 μm。 同理, 令金属细丝平行于Y轴扫描可以获得图6所示结果。 根据图6所示结果, 探测微元Y和Z方向直径分别为44.4和54.3 μm。
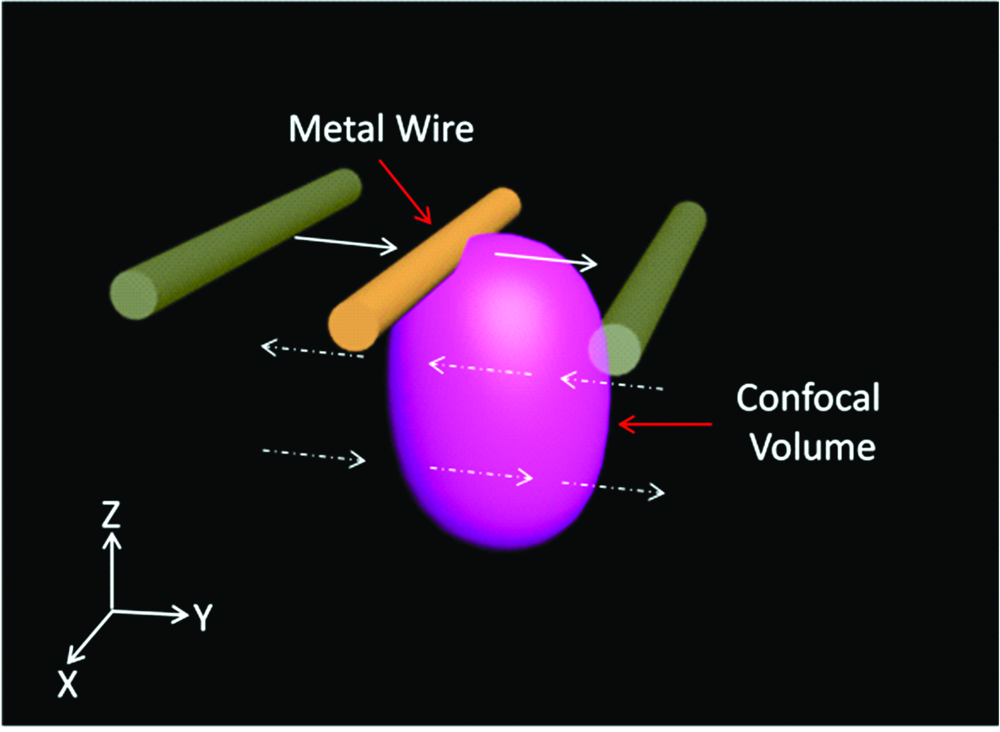 | 图4 金属细丝扫描探测微元路径Fig.4 Two-dimensional scanning-path of the confocal volume by the metal wir |
 | 图5 铜金属细丝探测微元Y-Z二维扫描Cu-Kα 强度分布Fig.5 Intensity distribution of the Cu-Kα of Y-Z plane of the confocal volume |
 | 图6 铜金属细丝探测微元X-Z二维扫描Cu-Kα 强度分布Fig.6 Intensity distribution of the Cu-Kα of X-Z plane of the confocal volume |
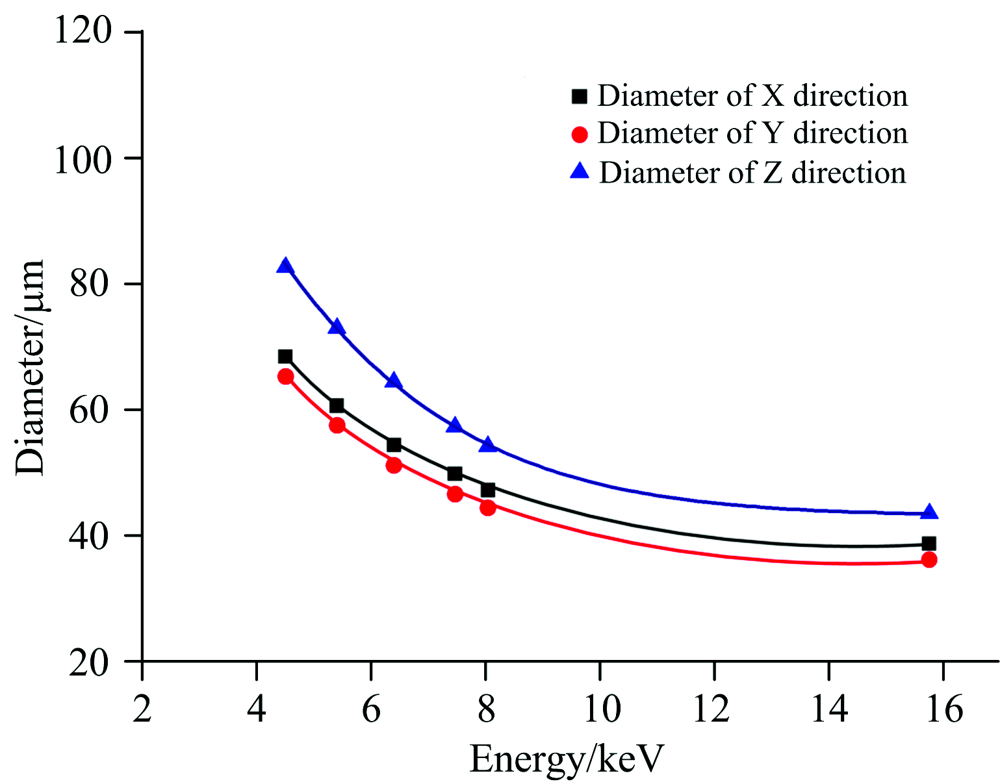
探测微元的尺寸是随X射线入射能量变化的。 本实验为了获得探测微元尺寸随能量变化曲线, 使用了钛, 铬, 铁, 镍, 铜和锆金属细丝, 金属细丝直径均约为20 μm。 为了增加测量效率, 不同的金属细丝以一定的间隔平行地粘在平整纸板上。 使用实验室编写的自动扫描程序, 只需要两次扫描便可以获得如图7所示探测微元尺寸随入射X射线能量变化曲线。 探测微元在X, Y和Z轴方向尺寸, 在4.5~15.7 keV能量范围内, 变化分别为68.4~38.7, 65.3~36.2和82.6~43.5 μm。 探测微元尺寸随X射线能量增大而减小, 原因是入射X射线全反射临界角随X射线能量增大而减小[20]。
 | 图7 探测微元X, Y和Z方向上尺寸随入射X射线能量变化曲线Fig.7 Diameter of the confocal volume in X, Y and Z direction at different energy |
提出一种采用粘贴在平整纸板上的金属细丝测量共聚焦X射线分析装置探测微元尺寸的方法。 与常规方法相比, 该方法一方面能够快速将金属丝置于探测微元附近, 另一方面, 通过两次扫描便能够得到探测微元尺寸随X射线能量变化曲线, 简化了测量流程, 提升了测量效率。 探测微元尺寸快速有效的测量为其广泛应用奠定了基础。
| [1] |
|
| [2] |
|
| [3] |
|
| [4] |
|
| [5] |
|
| [6] |
|
| [7] |
|
| [8] |
|
| [9] |
|
| [10] |
|
| [11] |
|
| [12] |
|
| [13] |
|
| [14] |
|
| [15] |
|
| [16] |
|
| [17] |
|
| [18] |
|
| [19] |
|
| [20] |
|