引用本文
Samy M. El-Megharbel, Moamen S. Refat. In First Time: Synthesis and Spectroscopic Interpretations of Manganese(Ⅱ), Nickel(Ⅱ) and Mercury(Ⅱ) Clidinium Bromide Drug Complexes[J]. Spectroscopy and Spectral Analysis, 2021,41(10): 3316-3320.
Doi:10.3964/j.issn.1000-0593(2021)10-3316-05

Copyright©2021, 《光谱学与光谱分析》期刊社
《光谱学与光谱分析》期刊社 所有
In First Time: Synthesis and Spectroscopic Interpretations of Manganese(Ⅱ), Nickel(Ⅱ) and Mercury(Ⅱ) Clidinium Bromide Drug Complexes

Abstract
Clidinium is a synthetic anticholinergic agent which has been shown in experimental and clinical studies to have an antispasmodic and antisecretory effect on the gastrointestinal tract. Inhibits the muscarinic effects of acetylcholine at neurotransmitter sites after parasympathetic ganglia. It is used to treat peptic ulcer disease and to help relieve stomach or stomach cramps or cramps due to abdominal cramps, diverticulitis, and irritable bowel syndrome. Mononuclear complexes of the manganese(Ⅱ), nickel(Ⅱ) and mercury(Ⅱ) with clidinium bromide drug (C22H26NO3) types [M(C22H25NO3)2(H2O)4] and [Hg(C22H25NO3)2(H2O)2] where M=Mn (Ⅱ) and Ni(Ⅱ), have been synthesized and characterized on the basis of elemental analysis, conductivity measurements, magnetic, electronic,1H-NMR and infrared spectral studies. The complexes confirm to 1:2 stoichiometry and are non-electrolytes. The clidinium drug ligand (C22H26NO3) act as a deprotonated monovalent monodentate chelate coordinating through hydroxyl oxygen where IR spectral bands of clidinium bromide shows a band at 3 226 cm-1 assigned to the OH group stretching frequency, this band ν(O—H) stretching vibration motion is disappeared in case of the infrared spectra of the Mn(Ⅱ), Ni(Ⅱ), and Hg(Ⅱ) complexes suggesting the involvement of the oxygen atom of the deprotonated OH group of clidinium ligand in complexation. The band for the ν(C—O) of alcoholic group of clidinium that appears at 1 240 cm-1 has blue shifted after complexity, indicating the participation of the alcoholic group in the coordination .1H NMR spectrum for clidinium bromide show a singlet peak at 3.65 ppm due to proton of OH group which isn’t observed in the spectrum of mercury(Ⅱ) complex referring to the deprotonation of OH group and participated in the complexation. Based on electronic spectra, IR spectra and magnetic moment measurements; six coordinated octahedral structures have been proposed for the manganese and nickel(Ⅱ) complexes, while mercury(Ⅱ) complex has a four coordinated geometry. Thermogravimetric analyses studies revealed the presence of coordinated water molecules. For instance the X-ray powder diffraction pattern and scanning electronic microscopy for the Hg(Ⅱ) complex deduced that it was isolated in nanostructured with crystallinity form.
Keyword:
Clidinium bromide; Monovalent complex; FTIR; Electronic spectra; XRD


Introduction
Clidinium bromide is an anticholinergic drug which may help symptoms of cramping and abdominal stomach pain by decreasing stomach acid and slowing the intestines. It is commonly prescribed in combination with chlordiazepoxide by the name of clidinium-c[1]. Accurate, simple, and selective stability-indicating reversed phase HPLC and TLC-densitometric methods with UV detection have been developed and validated for simultaneous determination of chlordiazepoxide and clidinium bromide in the presence of its alkaline induced degradation product. Successful separation of the drugs from the degradation product was achieved[1]. The spectroscopic and structural morphology properties of the charge transfer complex of the anticholinergic drug clidinium bromide with picric acid have been studied[2] in three polar solvents acetonitrile, methanol, and ethanol at room temperature. The formed transfer complex complex in each solvent was characterized in both solution and solid state using electronic, IR, and 1H and 13CNMR spectroscopies and XRD, SEM, TEM, and CHN elemental analyses. The outcome suggests that the formation of the CT complex is high in less polar solvent and that its spectroscopic and morphologic characteristics are markedly affected by the variation in solvent polarity. The United States Pharmacopeia (USP) stated the nonaqueous titration method for the assay of clidinium bromide and chlordiazepoxide[3, 4, 5, 6]. Few methods for the determination of clidinium bromide and chlordiazepoxide in combined dosage forms including HPLC[7, 8, 9], derivative spectrophotometry[10, 11], spectrophotometry using multivariate calibration techniques[12], and capillary SFC[13] have been reported. The present article reports studies on interactions between clidinium bromide drug and some of divalent transition metal ions like (Mn(Ⅱ ), Ni(Ⅱ ), and Hg(Ⅱ )). The elemental analysis, conductivity, IR and, 1H-NMR, electronic spectral studies of these complexes were assignments and deduced the suggested structure via deprotonation of the hydroxyl —OH group.
1 Experimental
1.1 Synthesis of Mn(Ⅱ ), Ni(Ⅱ ) and Hg(Ⅱ ) clidinium drug complexes
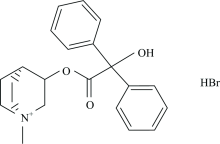
All chemicals that were used were of analytical grade where possible and were purchased from Aldrich and Merck Companies. Clidinium bromide drug (Fig.1) was received from Egyptian International Pharmaceutical Industrial Company (EIPICo.). The clidinium bromide complexes were prepared by mixing twice amount of clidinium bromide drug (2 mmol) and 1 mmol of anhydrous metal(Ⅱ ) chlorides Mn(Ⅱ ), Ni(Ⅱ ) and Hg(Ⅱ ) in mixed solvent MeOH/H2O (50/50, w/w; 40 cm3), then pH of the solution was adjusted to 6~8 using 5% solution of alcoholic ammonia solution, then the mixtures reaction were stirred at 70 ℃ for 4hrs and left to stand overnight. The resulted precipitates were filtered off, washed with MeOH and then dried under vacuum over anhydrous CaCl2.
 | Fig.1 Chemical structure of clidinium bromide drug |
1.2 Instruments
The C, H and N percentage determined using Vario EL Fab. CHNS. Metal content and water percentage were determined by gravimetrically technique. IR spectral data for synthesized complexes were measured using infrared Bruker spectrophotometer ranged between 400~4 000 cm-1. The conductance measurements with concentration of 10-3 mol· L-1 for synthesized complexes in dimethyl sulfoxide solvent measured using HACH conductivity meter model. 1H-NMR was recorded as dimethyl sulfoxide solutions on a Bruker 600 MHz spectrometer using tetramethyl silane as the internal standard. The electronic absorption spectra were recorded in DMSO solvent within 900~200 nm range using a UV2 Unicam UV/Vis Spectrophotometer fitted with a quartz cell of 1.0 cm path length. The X-ray diffraction patterns were recorded on X ’ Pert PRO PANanalytical X-ray powder diffraction, target copper with secondary monochromate. Magnetic susceptibility measurements were performed on a SHERWOOD SCIENTIFIC magnetic susceptibility balance. The surface morphologies for particles of complexes were visualized using a Quanta FEG 250 scanning electron microscope (SEM)generated at 20 kV accelerating voltage, where the shapes and sizes of these particles were visualized using a JEOL JEM-1200 EX Ⅱ .
2 Results and Discussion
2.1 Microanalytical and Molar conductance data
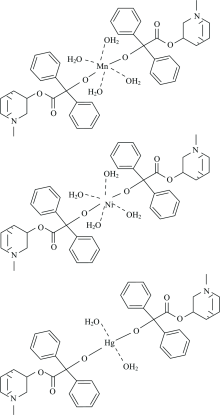
Analytical data listed in (Table 1) indicate that Metal:Ligand stoichiometry is (1:2) i.e the probable general formulas of the complexes are [M(C22H25NO3)2(H2O)4] and [Hg(C22H25NO3)2(H2O)2] where M=Mn (Ⅱ ) and Ni(Ⅱ ) (Fig.2). All the complexes melt above > 250 ℃ temperature. The prepared complexes are insoluble in water and poorly soluble in common organic solvents, but fairly soluble in DMSO and DMF. The molar conductance values lie in the range of 30~43 Ω -1· cm2· mol-1 at 25 ℃. Low molar conductance values of 10-3 mol· L-1 solutions in DMSO showed them to be non-electrolytes.
| Table 1 Analytical and physical data of the clidinium complexes |
 | Fig.2 Speculated structures of Mn(Ⅱ ), Ni(Ⅱ ), and Hg(Ⅱ ) clidinium complexes |
These data convenient with the calculated elemental analysis that Cl- ions were not detected by addition of AgNO3 solution to the solutions of the mentioned complexes dissolved in nitric acid.
2.2 Electronic spectra
The UV spectrum of the free clidinium bromide drug show a characteristic band at 43 860 cm-1. This band is attributed to intra ligand transitions. In the complexes the bands show the blue shift in their positions. Manganese(Ⅱ ) complex has magnetic moment value of 5.54 B.M. suggesting octahedral environment. The electronic spectra of Mn(Ⅱ ) complex has two bands at 22 222 cm-1 and 18 182 cm-1, which attributed to 6A1g→ 4T2g (G) and 6A1g→ 4T1g (G) transitions of Mn(Ⅱ ) ion in a spin free d5 configuration confirming to octahedral arrangement[14]. The nickel(Ⅱ ) complex has a distinguish bands at 24 390, 16 639 and 12 121 cm-1. These bands can be assigned to 3A2g(F)→ 3T1g(P)(ν 3), 3A2g(F) → 3T1g(F)(ν 2), 3A2g(F) → 3T2g (F) (ν 1) respectively. The ν 2/ν 1 equals to 1.37, Dq=1 212, B’ =442, β =0.426, LFSE=14 545, β =57.4%. For Ni(Ⅱ ) complex the magnetic moment is 3.15 B.M. suggesting distorted octahedral geometry[14].
2.3 Infrared spectra
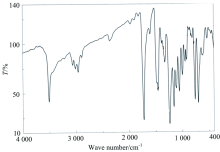
The distinguish IR spectral bands of clidinium bromide (Table 2) shows a band at 3226 cm-1 assigned to the OH group stretching frequency, this band ν (O—H) stretching vibration motion is disappeared in case of the infrared spectra of the Mn(Ⅱ ), Ni(Ⅱ ), and Hg(Ⅱ ) complexes [Fig.3(a—c)]. This suggests the involvement of the oxygen atom of the deprotonated OH group of clidinium ligand in complexation. The intense infrared band at 1 750 cm-1 which assigned to ν (C=O) vibrations[35] is presence within the range of the spectra of the complexity, this situation confirms that the oxygen atom of C=O group of the clidinium ligand is far away from the complexity with metal ions. An important band of the clidinium that corresponding to ν (C—O) vibration, because it is intense and very sensitive to structure features. The band for the ν (C—O) of alcoholic group of clidinium that appears at 1 240 cm-1 has blue shifted after complexity, indicating the participation of the alcoholic group in the coordination[35]. The ν (C=C) ring) vibration band at 1 456 cm-1 unchanged with respect to the free ligand. The same for bands at 1 244 and 886 cm-1, attributed to ν (CH2) and ring breathing, respectively. The low intensity bands at 650~500 cm-1 are assigned to M—O stretching vibrations[15]. These data assume a monodentate of coordination of clidinium ligand with the metal ions through deprotonated of OH group from alcohol moieties of two different clidinium molecules (Fig.2).
| Table 2 Infrared spectral bands and assignments of clidinium complexes |
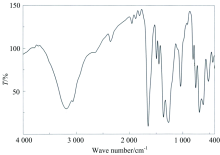 | Fig.3(a) IR Spectrum of Mn(Ⅱ ) clidinium complex |
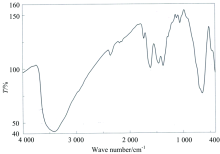 | Fig.3(b) IR Spectrum of Ni(Ⅱ ) clidinium complex |
 | Fig.3(c) IR Spectrum of Hg(Ⅱ ) clidinium complex |
2.4 1H-NMR spectra
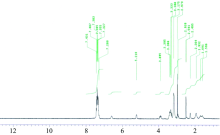
The 1H-NMR spectral results of the clidinium bromide ligand in (DMSO-d6) has a characteristic signal at chemical shifts 1.93~5.21 ppm and 7.28~7.43 ppm due to the aliphatic and aromatic protons respectively. The proton NMR spectrum for clidinium bromide show a singlet peak at 3.65 ppm due to proton of hydroxyl group. This singlet peak isn’ t observed in the spectrum of mercury(Ⅱ ) complex (Fig.4) that can be assigned to the deprotonation of OH group and participated in the complexation. The disappearance of the signal of the proton of the hydroxyl group in the 1H-NMR spectrum of the complex confirms that the hydroxyl group contribute in the complexation between clidinium and Hg(Ⅱ ) ion, therefore, the hydroxyl group is disappear in the complex of clidinium moiety. So these results confirm the position of chelation which discussed above between two molecules of clidinium with Hg(Ⅱ ) ion.
 | Fig.4 1H-NMR spectrum of Hg(Ⅱ ) clidinium complex |
2.5 X-ray powder diffraction patterns and SEM studies
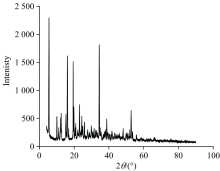
The XRD powder pattern analysis of the [Hg(C22H25NO3)2(H2O)2] complex (Fig.5) has been performed using X-ray diffractometer with Cu as anode material, K-alpha [nm]=0.154 178, and the generator settings 30 mA, 40 kV.
 | Fig.5 XRD spectrum of Hg(Ⅱ ) clidinium complex |
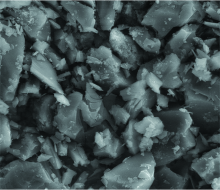
The Debye-Scherrer equation in X-ray diffraction and crystallography is a formula which relates the size of the crystallites in a solid to the broadening of a peak in a diffraction pattern. The Debye-Scherrer equation is B=kλ /scosθ , where s=crystallite size, λ =wavelength of X-ray radiation (CuKα =0.154 178 nm), k=constant taken as 0.94, θ =diffraction angle (5.494 7° ), and B=full width at half maximum height (FWHM) (0.250 9° ). The crystallite size of the mercury (Ⅱ ) clidinium complex is found to be 33 nm. Line broadening of the crystalline diffraction peak in the Hg(Ⅱ ) complex showed higher crystallinity. The SEM analysis was carried out to check the surface morphology of the selected Hg(Ⅱ ) complex and the micrographs obtained are given in Fig.6. The micrograph of Hg(Ⅱ ) complex indicated that the presence of well defined crystals free from any shadow of the metal ion on their external surface had a stones like morphology. It is evident from the SEM study that in the synthesized metal complex, crystals were found to grow up from just a single molecule to several molecules in an aggregate distribution with particle sizes starting from a few nanometers to several hundred.
 | Fig.6 SEM image of Hg(Ⅱ ) clidinium complex |
参考文献
| [1] |
|
| [2] |
|
| [3] |
|
| [4] |
|
| [5] |
|
| [6] |
|
| [7] |
|
| [8] |
|
| [9] |
|
| [10] |
|
| [11] |
|
| [12] |
|
| [13] |
|
| [14] |
|
| [15] |
|