


近-中红外光谱融合技术速测奶牛场粪水氮磷含量
[孙迪1, 2  , 李梦婷
, 李梦婷1 , 牟美睿1 , 赵润1, * , 张克强1, * ]
, 李梦婷, 张克强]
|
|


作者简介: 孙迪, 1995年生, 农业农村部环境保护科研监测所硕士研究生 e-mail: sdi0825@126.com
快速准确测定粪水/沼液中的氮磷养分含量, 是现阶段我国规模化奶牛场在种养结合道路上亟需破解的技术瓶颈。 针对传统的实验室湿化学检测方法难以满足奶牛场粪水还田前任一节点氮磷快速定量的现实问题, 研究开发了基于近红外、 中红外及近-中红外光谱融合技术, 实现规模化奶牛场粪水运移全链条环节氮磷含量的本土化快速检测方法。 采集了天津地区27家种养结合型规模化奶牛场粪水流经全程环节(集粪沟、 集污池、 氧化塘等)共计144个样品, 使用傅里叶变换近红外光谱仪和中红外光谱仪分别采集了12 000~4 000和4000~650 cm-1区间的光谱数据, 对所有样品的近红外光谱、 中红外光谱及近-中红外光谱融合数据进行归一化、 基线校正、 SNV等预处理, 分析了近红外光谱和中红外光谱特征, 采用浓度梯度法进行样品分集, 运用偏最小二乘(PLS)、 间隔偏最小二乘(IPLS)和联合区间偏最小二乘(SIPLS)法, 构建了粪水总氮(TN)、 总磷(TP)的近红外模型和中红外模型。 粪水TN模型预测结果较好, 近红外和中红外最佳模型趋近一致;粪水TP模型的预测性能不理想, 近红外和中红外SIPLS最佳模型的$R^{2}_{pred}$仅分别为0.790和0.631, RPD分别为2.213和1.479, 四分位数间隔(RPIQ)分别为3.616和2.351, 难以用于实际检测;为实现粪水氮磷同步有效的测定分析, 进一步提升模型整体预测性能, 综合近红外光谱和中红外光谱数据建立了粪水氮磷近-中红外融合模型, 光谱区间为12 000~650 cm-1, 预测性能整体表现良好, 以近-中红外融合IPLS模型预测结果最为理想, 其$R^{2}_{pred}$分别为0.970和0.861, RPD分别为5.615和2.684, RPIQ分别为12.874和4.394, 总体优于单一近、 中红外模型, 尤其TP的最佳融合模型, 其$R^{2}_{pred}$相比近、 中红外最佳单一模型分别高出0.071和0.170。 研究表明, 近-中红外光谱融合技术可以实现对规模化奶牛场粪水运移全链条环节氮磷含量的准确速测, 为粪水科学还田提供技术支撑。
Rapid and accurate determination of the nitrogen (N) and phosphorus (P) in the slurry/biogas slurry has been a technical bottleneck is urgently needed for the large-scale dairy farms in China on their ways of planting and breeding combination. Conventional wet chemical measuring methods in the laboratory were difficult to meet the practical demand of rapid quantitative determination on the N and P before recycling the dairy farm slurry back to the field. An indigenized rapid detection method of N and P through the full chain of slurry movement in large-scale dairy farms was developed based on the near-infrared (NIR), mid-infrared (MIR) and near-mid infrared (NIR-MIR) spectral fusion technology. A total of 144 slurry samples were collected along with the entire process links (manure collecting gutter, slurry tank, lagoon, etc.) from 27 large-scale dairy farms in Tianjin. The spectral data of 12 000~4 000 and 4 000~650 cm-1 were collected by the Fourier transform near-infrared spectrometer (FT-NIRS) and mid-infrared spectrometer (FT-MIRS). Pretreatment methods involved the normalization, baseline and SNV were performed on the whole NIR, MIR and NIR-MIR data.NIR and MIR spectral characteristics were analyzed. The concentration gradient method was used for the sample diversity. NIR and MIR models of the total nitrogen (TN) and total phosphorus (TP) in the slurry were constructed by the partial least squares (PLS), interval partial least squares (IPLS) and synergy interval partial least squares (SIPLS). The results of slurry TN models were preferable, while the optimal models between the NIR and MIR were equivalent. The prediction performance of the TP model for the slurry was unsatisfactory that difficult of practical application. The $R^{2}_{pred}$ of the optimal SIPLS models for NIR and MIR were only 0.790 and 0.631, respectively. The residual predictive deviation (RPD) was 2.213 and 1.479 respectively. And the ratio of performance to interquartile range (RPIQ) was 3.616 and 2.351, respectively. In order to realize the simultaneous and effective determination and analysis of the N and P in the slurry meanwhile further improve the overall prediction performance of the model, the NIR-MIR fusion model of the N and P in the slurry was established integrated the NIR with MIR spectral data, with the spectral range of 12 000~650 cm-1. The prediction performance behaved well overall. IPLS fusion model performed the optimum. The $R^{2}_{pred}$ was 0.970 and 0.861 respectively. RPD was 5.615 and 2.684 respectively. RPIQ was 12.874 and 4.394 respectively. It was better than the single NIR model and MIR model. In particular, the optimal fusion model of the TP was 0.071 and 0.170 which was higher than that of the single NIR and MIR models. The results showed that exact and rapid determination of the N and P through the full chain links of slurry movement in large-scale dairy farms via the near-mid infrared spectroscopy fusion technology could be available for the scientific slurry recycling to the farmland.
氮磷是规模化奶牛场粪水科学还田的重要考量指标[1, 2], 快速、 准确测定粪水中的氮磷含量是现阶段奶牛场在种养结合道路上亟需破解的首要难题。 相比欧美发达国家, 国内规模化奶牛场粪水轮转体系复杂多变, 链条漫长且循环往复, 实验室常规化学检测方法难以满足粪水还田前任一节点快速定量的现实需求[3, 4]。 近两年农业农村部和生态环境部联合印发的政策文件[5, 6]中明确指出要完善畜禽粪污还田利用检测方法标准体系, 及时掌握粪污中的养分含量。 因此, 创建奶牛场粪水氮磷快速定量分析方法, 保障粪水科学还田并防控环境风险, 具有重要的现实意义。
近、 中红外光谱技术具有便捷快速、 无需前处理、 低成本等优点, 其中近红外光谱可提供含氢基团(如C—H, O—H, N—H)倍频、 合频吸收的信息, 近年来在畜牧环境工程方面多被应用于畜禽粪便和堆肥系统多种物质的定量分析, 如Birgü l[7]、 Finzi[8]、 Bedina[9]等应用近红外光谱技术(near infrared spectroscopy, NIRS)快速分析测定了畜禽排泄物中氮、 磷等组分含量; Awhangboad[10]、 梁浩[11]、 杨增玲[12]等采用NIRS检测了厌氧消化和堆肥过程中挥发性脂肪酸、 铵态氮和总氮等含量。 中红外光谱可提供含有分子的基频振动信息, 在畜禽养殖检测行业多用于定性分析, 如Bustamante等[13]利用中红外光谱技术成功解析了动物粪便的组成、 饲料消化率、 蛋白摄入量等; Cao等[14]利用傅里叶变换红外光谱(Fourier transform infrared spectroscopy, FTIR)阐明了不同温度、 粪肥浓度和活性炭催化剂用量对超临界水(super critical water, SCW)中鸡粪气化的影响机制; Yang等[15]利用FTIR探明了猪粪堆肥过程溶解性有机物(dissolved organic matter, DOM)的功能和结构。 现有研究大多是将近红外光谱或中红外光谱单一技术应用于固态粪便或堆肥过程中的特定环节, 而鲜见面向粪肥还田将两种技术进行融合应用于奶牛场液态粪水运移全链条氮磷养分含量同步且有效的测定和分析。
以天津市27家种养结合型规模化奶牛场粪水运移全链条环节的样品为研究对象, 综合运用近红外光谱技术、 中红外光谱技术及近-中红外光谱融合技术, 采用偏最小二乘(partial least squares, PLS)、 间隔偏最小二乘(interval partial least square, IPLS)和联合区间偏最小二乘(synergy interval partial least square, SIPLS)法分别建立近红外模型、 中红外模型及近-中红外融合模型, 优选出适用于奶牛场粪水运移全程节点氮磷含量的快速定量分析方法, 为粪水科学还田提供技术支撑。
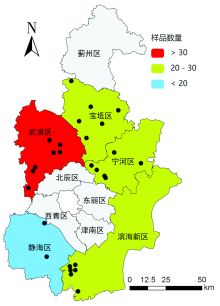
样品采集于2019年冬季天津地区27家规模化奶牛场粪水运移全程位点, 从奶牛场粪水收储设施起始点(集粪沟)开始, 截至粪水还田前终点(氧化塘、 贮存池或防疫沟), 其中包含集污池、 分离池、 沉淀池等环节, 如粪水运移流程图1所示。 各场位置及采样数量分布如图2所示, 每天采集3~7家奶牛场, 每家奶牛场采集2~10个样品不等, 共计144个。
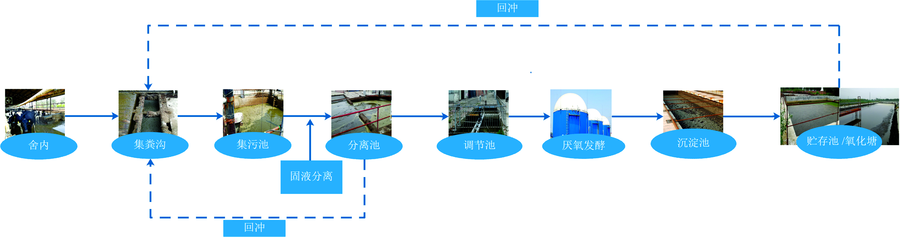 | 图1 粪水运移流程图Fig.1 Flow chart of slurry movement |
 | 图2 奶牛场位置及采样数量分布 注: 图中黑色圆点代表27家奶牛场Fig.2 Distribution of dairy farms and sampling amounts Note: Black dots in the map represent 27 dairy farms |
采用丹麦Foss公司的kjeltec 8400型全自动凯氏定氮仪, 参照国标《GB/T 11891—1989水质凯氏氮的测定》方法测定粪水样品中的总氮(total nitrogen, TN)含量; 采用722E型-紫外可见光分光光度计, 参照《GB/T 11893—1989水质总磷的测定》中规定的方法测定粪水中的总磷(total phosphorus, TP)含量。 表1为粪水样品氮磷含量测定结果。
| 表1 粪水样品氮磷测定结果 Table 1 Measurement results of the nitrogen and phosphorus in slurry samples |
1.3.1 近红外光谱采集
采用美国PerkinElmer(PE)公司的傅里叶变换近红外(Fourier transform near-infrared, FT-NIR)光谱仪, 采用InGaAs检测器和仪器自带积分球附件, 光谱扫描范围为12 000~4 000 cm-1。 光谱扫描参数为: 分辨率8 cm-1, 扫描间隔2 cm-1, 扫描次数64。 每条光谱有4 001个变量。
1.3.2 中红外光谱采集
采用美国PE公司的Spectrum Two型傅里叶变换红外光谱仪, 氘化三甘氨酸硫酸酯(deuterated triglycine sulfate, DTGS)检测器, 使用衰减全反射(attenuated total reflectance, ATR)方式, 扫描范围为4 000~650 cm-1。 光谱扫描参数为: 分辨率8 cm-1, 扫描间隔2 cm-1, 扫描次数64。 每条光谱有1 676个变量。
对144个粪水样品的近红外光谱、 中红外光谱及近中红外光谱融合数据进行归一化、 基线校正、 标准正态变量变换SNV等预处理, 采用浓度梯度法进行样品分集, 运用PLS, IPLS和SIPLS法建立粪水氮磷定量分析模型, 根据交互验证均方根误差(root mean squared error of cross validation, RMSECV)确定建模最佳因子数, 通过校正均方根误差(root mean square error of calibration, RMSEC)、 预测均方根误差(root mean squared error of prediction, RMSEP)、 预测决定系数
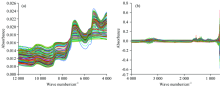
图3(a)和(b)分别为经过归一化预处理后的144个粪水样品在12 000~4 000 cm-1范围内的近红外漫反射光谱和4 000~650 cm-1范围内的中红外ATR光谱。 在近红外光谱12 000~4 000 cm-1范围内, 粪水近红外光谱含有C—H, N—H, O—H化学键的官能团, 在5 210~4 200 cm-1区域为合频谱带, 在7 140~5 550 cm-1区域为一级倍频, 在10 400~8 200 cm-1区域为二级倍频[19]。 在中红外光谱4 000~650 cm-1区间, 1 080, 1 500~1 370, 1 570~1 515和3 000 cm-1处都有明显的吸收峰, 主要是源于C—O键振动、 饱和烃C—H弯曲振动、 氨基化合物的N—H变形、 C=N伸缩、=C—H伸缩振动吸收所引起[20]。 总体来看, 虽待测样品来自27家奶牛场粪水流经的多个环节, 但144个样品的光谱轮廓和变化趋势总体相似, 仅在强度上略有差异。
 | 图3 归一化处理后的近红外光谱(a)和中红外光谱(b)Fig.3 Near infrared spectra (a) and mid infrared spectra (b) after normalization treatment |
综合144个粪水样品的近、 中红外光谱数据及其TN、 TP含量化学值, 采用PLS, IPLS和SIPLS法, 分别建立粪水氮磷近红外、 中红外最优模型, 结果如表2、 图4和图5所示。 对于粪水TN模型, 近红外SIPLS模型性能最理想, 最佳建模区间覆盖含有N—H化学键官能团的波数范围10 930~10 400, 9 330~8 798, 7 194~6 662和5 594~5 064 cm-1, 其RMSEC,
| 表2 粪水氮磷PLS, IPLS, SIPLS校正模型结果比较 Table 2 Comparison of PLS, IPLS and SIPLS calibration models for the nitrogen and phosphorus in the slurry |
 | 图4 粪水TN模型预测结果Fig.4 Prediction results of the slurry TN model |
 | 图5 粪水TP模型预测结果Fig.5 Prediction results of the slurry TP model |
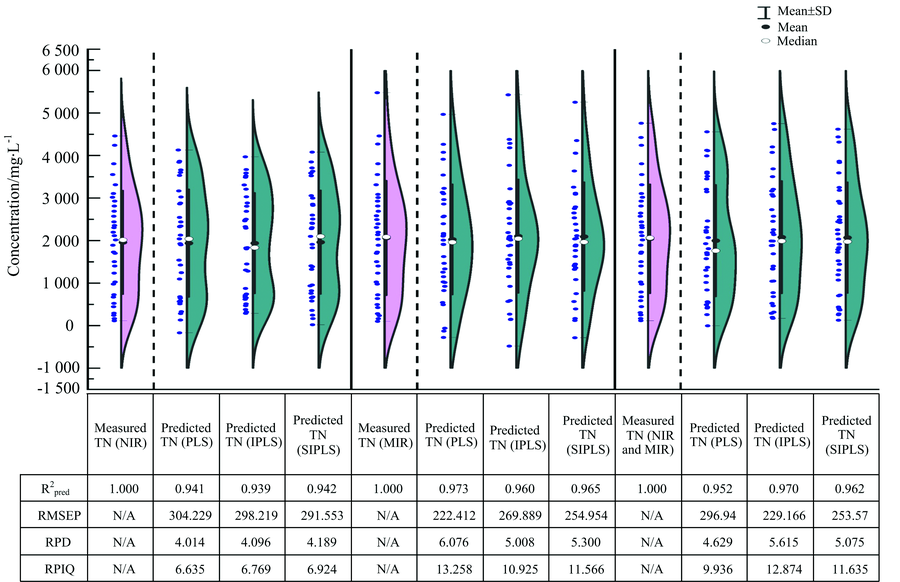
为实现粪水氮磷同步有效的测定分析, 提升模型整体预测性能, 将近、 中红外光谱技术相结合获得更丰富的特征信息, 建立近-中红外融合模型, 光谱总区间为12 000~650 cm-1, 结果如表2、 图4和图5所示。 从图、 表中可以观察到, 模型预测值和真实值高度吻合, 特别是氮磷的最佳预测模型, 中位值和平均值大体相近。 采用IPLS法得到粪水TN最优融合模型, 最佳建模区间为9 168~4 056, 2 922~2 354和1 786~1 218 cm-1, 与2.1节中显示的特征波峰区间大体相近, 其RMSEC,
从图4和图5可以看出, 各类模型预测值与真实值的中位值、 平均值及数据分布范围基本一致, 说明模型整体预测结果较好。 其中, 粪水TN中红外最佳模型略优于近红外最佳模型和近-中红外最佳融合模型, 其
综合运用近红外、 中红外及近-中红外光谱融合技术, 对天津地区27家规模化奶牛场粪水运移全程环节样品中的氮磷含量测定分析, 采用PLS, IPLS和SIPLS法分别建立了近红外模型、 中红外模型及近-中红外融合模型, 比对预测结果并优选出最佳模型。 实验结果表明, 粪水TN近-中红外IPLS融合模型总体呈现出良好的预测效果, 其
| [1] |
|
| [2] |
|
| [3] |
|
| [4] |
|
| [5] |
|
| [6] |
|
| [7] |
|
| [8] |
|
| [9] |
|
| [10] |
|
| [11] |
|
| [12] |
|
| [13] |
|
| [14] |
|
| [15] |
|
| [16] |
|
| [17] |
|
| [18] |
|
| [19] |
|
| [20] |
|