

基于拉曼光谱实验与密度泛函理论的宝石级红珊瑚拉曼谱峰归属研究
[陈超洋1  , 黄伟志
, 黄伟志1 , 高强2 , 范陆薇3 , 沈锡田1, * ]
, 黄伟志]
|
|


作者简介: 陈超洋, 1995年生, 中国地质大学(武汉)珠宝学院博士研究生 e-mail: 377651868@qq.com
红珊瑚是一种珍贵的有机宝石, 自古以来因其红润的颜色与细腻的质地深受人们的喜爱与追捧。 颜色漂亮的天然红珊瑚产量稀少, 故有些红珊瑚会经过染色处理来改善其外观。 拉曼光谱测试是鉴定红珊瑚有无经过染色处理的有力手段, 故红珊瑚拉曼谱峰的归属对于鉴定有着重要的理论指导意义。 由于红珊瑚拉曼峰的归属问题一直没有被深入研究, 基于此, 该研究测试了三颗颜色深浅不同的红珊瑚( Corallium rubrum)的拉曼光谱。 同时, 使用量子化学程序Gaussian 16运用密度泛函理论计算了红珊瑚中色素分子角黄素的理论拉曼光谱。 创新性对比红珊瑚的实验拉曼光谱与角黄素分子的理论拉曼光谱, 并进一步分析红珊瑚拉曼峰的归属。 结果发现, 红珊瑚的拉曼光谱中主要有1 514, 1 295, 1 177, 1 125, 1 086和1 016 cm-1拉曼峰, 其中1 086 cm-1处的拉曼峰是方解石的$CO_3^{2-}$引起的。 红珊瑚的红色越深, 1 514, 1 295, 1 177, 1 125和1 016 cm-1拉曼峰的强度越强, 反之, 红珊瑚的红色越浅, 这些拉曼峰的强度越弱。 红珊瑚拉曼光谱中的1 514, 1 295, 1 177, 1 125和1 016 cm-1峰强与红珊瑚的红色深浅呈现出正相关的关系, 故推测这套拉曼峰是由红珊瑚中的色素产生的。 角黄素理论拉曼光谱中主要存在的拉曼峰位于1 512, 1 269, 1 189, 1 159和999 cm-1处, 与红珊瑚实验拉曼光谱中的1 514, 1 295, 1 177, 1 125和1 016 cm-1峰的形状位置高度吻合。 振动分析结果表明, 角黄素的1 512, 1 269, 1 189, 1 159和999 cm-1拉曼峰分别是由C=C伸缩振动, C—H摇摆振动, C—C伸缩振动, C—C伸缩振动与甲基摇摆振动引起的。 因此将红珊瑚拉曼光谱中的1 514, 1 295, 1 177, 1 125和1 016 cm-1峰归属为C=C伸缩振动, C—H摇摆振动, C—C伸缩振动, C—C伸缩振动与甲基摇摆振动。 使用密度泛函理论的计算方法研究了红珊瑚拉曼谱峰的归属并对红珊瑚的拉曼谱峰进行了指认, 为使用拉曼光谱鉴定红珊瑚提供了理论基础。 同时为研究这类生物宝石材料拉曼谱峰的归属提供了一种新的方法。
Red coral is a kind of precious organic gemstone material, and it has been popular with people since ancient times because of its beautiful red color and delicate texture. Natural red corals with beautiful colors are rare in production, so some red corals are dyed to improve their appearance. Raman spectroscopy is a powerful method to identify whether red coral has been dyed or not, so the assignments on Raman peaks of red coral have important theoretical significance for identification. However, the assignments have not been studied profoundly. Based on this, the Raman spectra of three red corals ( Corallium rubrum) with different red color saturation were collected. At the same time, the theoretical Raman spectrum of pigment molecule canthaxanthin in red coral was calculated by Density Functional Theory (DFT) using quantum chemistry program Gaussian 16. We innovatively compared Raman spectrum of red coral and theoretical Raman spectrum of canthaxanthin to further analyze the assignments on Raman peaks of red coral. The results show that there are peaks at 1 514, 1 295, 1 177, 1 125, 1 086 and 1 016 cm-1 in the Raman spectra of red corals and the Raman peak at 1 086 cm-1 belongs to $CO_3^{2-}$ in calcite. The darker the red color of coral is, the stronger the Raman peaks at 1 514, 1 295, 1 177, 1 125 and 1 016 cm-1 are. On the contrary, the lighter the red color of coral is, the weaker the Raman peaks are. The intensities of Raman peaks at 1 514, 1 295, 1 177, 1 125 and 1 016 cm-1 are positively correlated with the saturation of red the color, so it is presumed that these Raman peaks are produced by pigments in red corals. The main Raman peaks in the theoretical Raman spectrum of canthaxanthin are located at 1 512, 1 269, 1 189, 1 159 and 999 cm-1, which correspond well to the Raman peaks at 1 514, 1 295, 1 177, 1 125 and 1 016 cm-1 of red coral. The results of vibration analysis show that the Raman peaks at 1 512, 1 269, 1 189, 1 159 and 999 cm-1 of canthaxanthin belong to C=C stretching, C—H rocking, C—C stretching, C—C stretching and methyl rocking respectively. Therefore, the peaks at 1 514, 1 295, 1 177, 1 125 and 1 016 cm-1 in Raman spectrum of red coral are assigned to C=C stretching, C—H rocking, C—C stretching, C—C stretching and methyl rocking. In this study, the calculation method of DFT is innovatively used to study the assignments on Raman peaks of red coral and interpret the Raman peaks of red coral, which provides a theoretical basis for using Raman spectroscopy to identify red coral. It also provides a new method to study assignments on Raman peaks of this kind of gem biomaterials.
红珊瑚是一种珍贵的宝石材料, 自古以来, 红珊瑚因其颜色红润质地细腻而受到人们的喜爱[1]。 用作宝石的红珊瑚属于腔肠动物门一珊瑚虫纲一八放珊瑚亚纲一软珊瑚目一硬轴珊瑚亚目一红珊瑚科[2]。 世界范围内, 已知的宝石级红珊瑚科有红珊瑚属和侧红珊瑚属两个属[3]。 宝石学研究的红珊瑚一般是指红珊瑚科中的动物骨骼堆积物[1, 4]。 关于红珊瑚的颜色成因, 不同学者有不同的观点[5, 6, 7, 8, 9]。 主要观点有两种: 一种是认为红珊瑚的红色是由多烯类物质导致的[5, 6], 另一种是认为红珊瑚的红色是由类胡萝卜素导致的[7, 8, 9]。 这些研究中对于红珊瑚中色素种类的研究与推测使用的几乎都是拉曼光谱测试, 而在生物化学研究领域, 仅有少数学者对红珊瑚中的有机物进行了提取与分析, Jelena等使用HPLC— UV-MS联用技术检测出红珊瑚(Corallium rubrum)中的一种色素成分— — 角黄素(canthaxanthin), 该研究认为, 角黄素是红珊瑚中类胡萝卜素的主要种类[9]。 这是目前明确给出红珊瑚中致色物质种类的研究。 颜色红润的红珊瑚产量极为有限, 故有部分商家对红珊瑚进行染色处理[1]。 因此在宝石行业, 对于鉴别红珊瑚是否经过染色就显得极为重要。 在宝石检测方面, 使用拉曼光谱可以快速区分天然红珊瑚跟染色处理的红珊瑚[1]。 但目前缺乏对于红珊瑚拉曼谱峰归属的详细研究, 研究红珊瑚拉曼谱峰归属对于拉曼光谱鉴定红珊瑚有着较为重要的理论指导意义。 沙丁红珊瑚(学名: Corallium rubrum)是珠宝市场上非常重要的一类红珊瑚品种, 上文已经提及, 前人已经使用实验手段证明了这种红珊瑚中的色素主要是角黄素[9]。 基于此, 我们选取三颗不同颜色的沙丁红珊瑚测试其拉曼光谱, 同时使用量子化学程序Gaussian 16对角黄素分子进行结构优化, 振动分析以及理论拉曼光谱的计算。 在谱学研究方面, 创新性结合拉曼光谱的实验与理论拉曼光谱的计算来对红珊瑚拉曼谱峰的归属进行研究, 实验结果与计算结果高度吻合, 本次研究指认了红珊瑚拉曼谱峰的归属, 对于使用拉曼光谱鉴定红珊瑚有无染色处理有一定的理论指导意义。
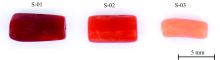
研究样品是三颗颜色不同的红珊瑚(Corallium rubrum), 颜色从深红色到浅粉色, 依次编号S-01, S-02和S-03(如图1)。 S-01号样品的红色最深, S-02号样品的红色稍浅, S-03号样品的红色最浅。 本次研究的红珊瑚样品由中国地质大学(武汉)逸夫博物馆提供。
 | 图1 沙丁红珊瑚样品Fig.1 Red coral (Corallium rubrum) samples |
红珊瑚样品的拉曼光谱测试在中国地质大学(武汉)珠宝学院完成, 测试仪器是Bruker Senterra R200L拉曼光谱仪。 测试使用的激光源波长为532 nm, 输出功率为10 mW, 孔径50× 1 000 μ m, 扫描时间10 s, 叠加2次, 扫描范围400~1 700 cm-1, 测试时室温25 ℃, 测试后对谱图进行基线校正。
角黄素分子结构如图2所示, 其理论拉曼光谱的计算采用量子化学程序Gaussian 16完成[10], 使用B3LYP泛函搭配6-31G(d)基组进行结构优化, 振动分析与拉曼光谱的计算[11], 为了方便与红珊瑚的拉曼光谱进行对比分析, 将计算得到的拉曼光谱的拉曼位移数据乘以频率校正因子0.961 4来进一步校正[12]。 使用Multiwfn程序将Gaussian 16计算得到的角黄素的拉曼活性转成拉曼强度并绘制角黄素的理论拉曼光谱[13]。
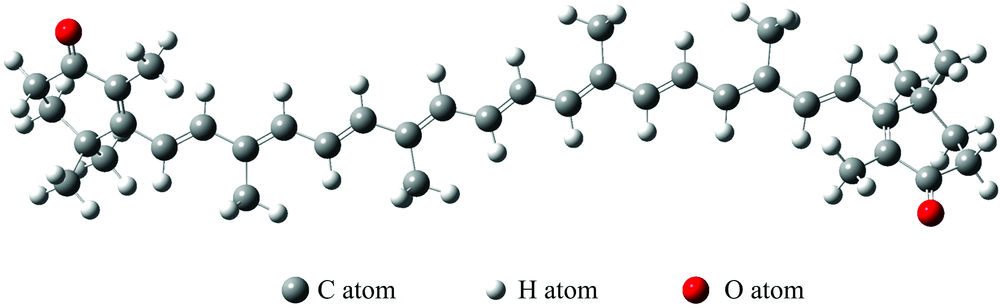 | 图2 角黄素的分子结构Fig.2 Structure of canthaxanthin |
为了方便对比不同样品的拉曼峰的强弱特征, 将样品S-01, S-02和S-03的拉曼光谱进行人为偏移放到一张图中进行对比(如图3所示)。 从图3可以看出, 三颗不同颜色的红珊瑚拉曼光谱中谱峰的位置都非常一致, 主要有位于1 514, 1 295, 1 177, 1 125, 1 086和1 016 cm-1处的拉曼峰, 其中位于1 086 cm-1处的拉曼峰是方解石的
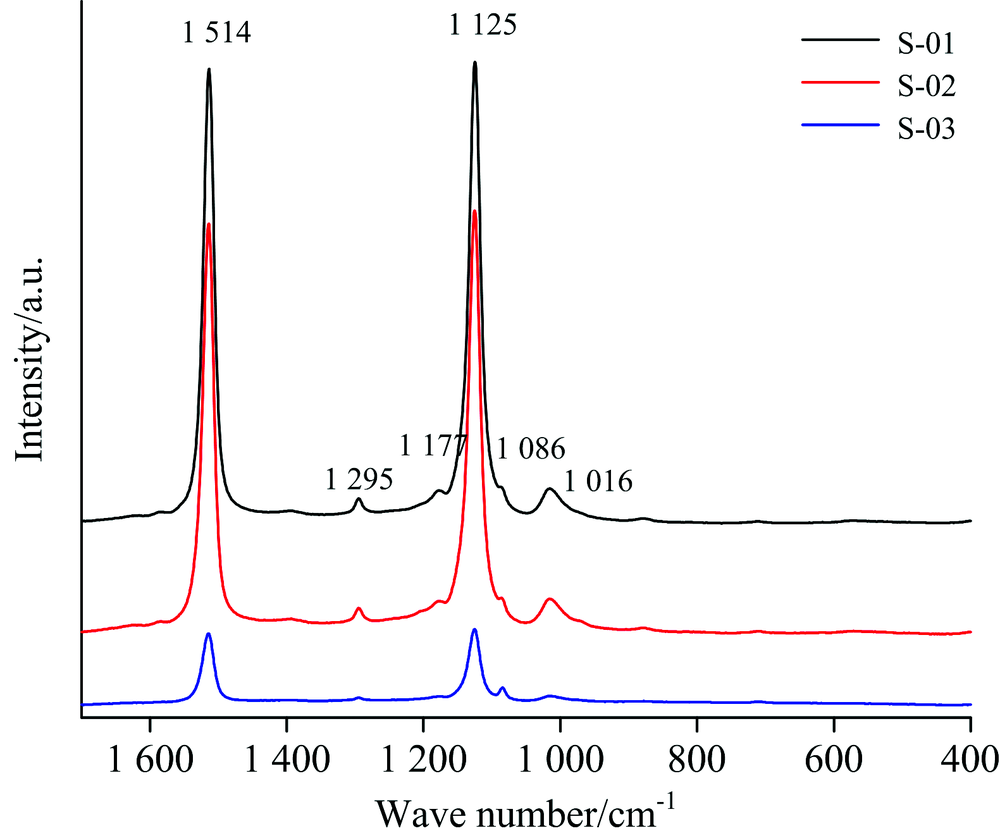 | 图3 红珊瑚样品的拉曼光谱Fig.3 Raman spectra of red coral samples |
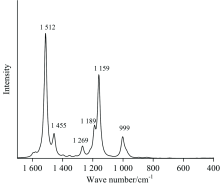
前人通过实验确认了红珊瑚中含有角黄素, 角黄素是一种色素, 故推测这些峰很可能是角黄素产生的。 因此计算角黄素分子的理论拉曼光谱并与红珊瑚的拉曼光谱进行对比分析。 有学者专门对β -胡萝卜素的拉曼光谱进行了密度泛函理论计算研究, 研究发现, 在HF/6-31G(d), SVWN/6-31G(d), PBE0/6-31G(d), BLYP/6-31G(d), B3LYP/6-31G(d), B3LYP/6-31G(d, p), B3LYP/6-311G(d)和B3LYP/6-311G(d, p) 计算级别下, B3LYP/6-31G(d)搭配频率校正因子的计算结果最好[14]。 β -胡萝卜素与角黄素化学结构相似, 所以选取B3LYP泛函搭配6-31G(d)基组计算角黄素的拉曼光谱。 由于Gaussian 16计算得到的是拉曼活性数据, 为了与实验数据进行更好对比, 使用Multiwfn程序将角黄素的拉曼活性数据转成拉曼强度数据(入射激光波长为532 nm, 测试时温度为25 ℃)绘制角黄素的理论拉曼光谱(如图4所示)。
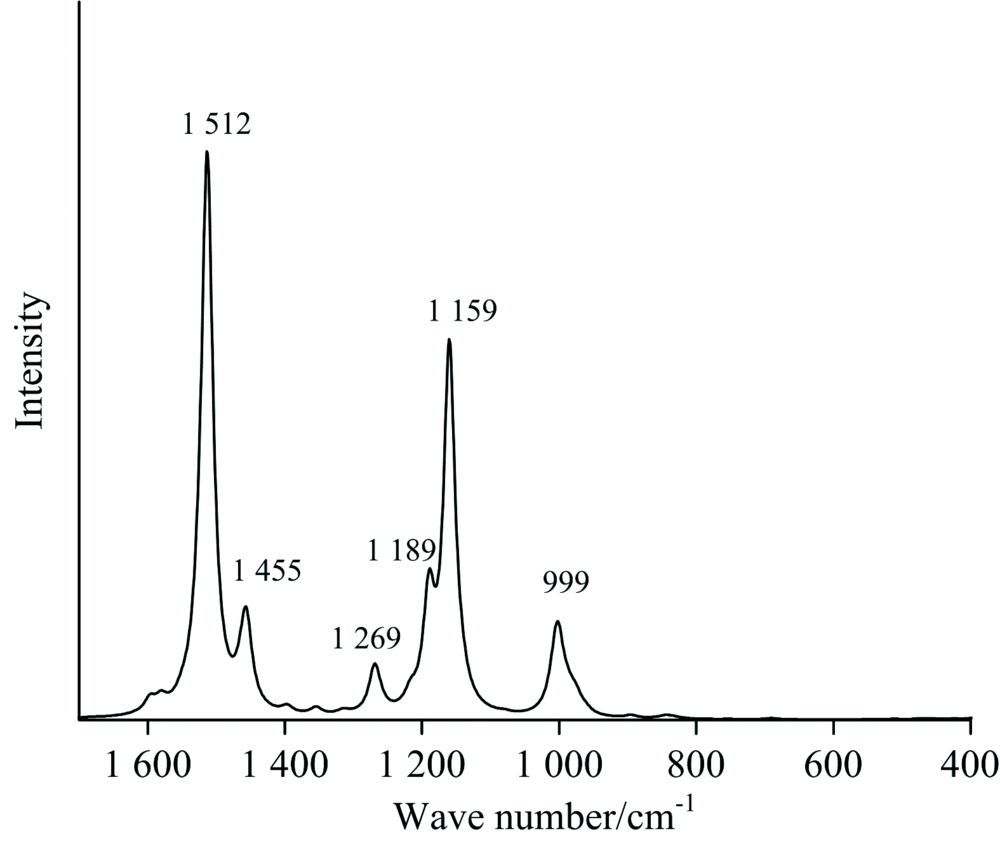 | 图4 密度泛函理论计算得到的角黄素分子的理论拉曼光谱Fig.4 Theoretical Raman spectrum of canthaxanthin calculated by DFT |
从图4可以看出, 角黄素理论拉曼光谱中主要存在的拉曼峰位于1 512, 1 455, 1 269, 1 189, 1 159和999 cm-1处。 角黄素的理论拉曼光谱特征与红珊瑚的拉曼光谱特征非常相似。 红珊瑚实验拉曼光谱中位于1 514, 1 295, 1 177, 1 125和1 016 cm-1处的拉曼峰可以分别对应于角黄素分子理论拉曼光谱中位于1 512, 1 269, 1 189, 1 159和999 cm-1处的拉曼峰, 所以我们通过研究角黄素理论拉曼光谱中1 512, 1 269, 1 189, 1 159和999 cm-1拉曼峰的归属来进一步对红珊瑚相对应的拉曼峰进行指认。 根据量子化学程序Gaussian 16的计算结果可知, 角黄素理论拉曼光谱中1 512, 1 269, 1 189, 1 159和999 cm-1拉曼峰分别主要由C=C伸缩振动, C— H摇摆振动, C— C伸缩振动, C— C伸缩振动与甲基的摇摆振动引起。 为了更加简明, 在这里将红珊瑚的拉曼峰、 角黄素分子的理论拉曼峰以及其归属的振动模式列表说明(见表1)。 因此推测红珊瑚的1 514, 1 295, 1 177, 1 125和1 016 cm-1拉曼峰分别是由C=C伸缩振动, C— H摇摆振动, C— C伸缩振动, C— C伸缩振动与甲基的摇摆振动引起。
| 表1 红珊瑚拉曼谱峰与角黄素理论拉曼谱峰的对比 Table 1 Comparison of Raman peaks of red corals with theoretical Raman peaks of canthaxanthin |
(1)红珊瑚的红色深浅与其拉曼光谱中的1 514, 1 295, 1 177, 1 125和1 016 cm-1处的峰强呈现正相关关系: 红色越深, 这套峰的强度越强, 红色越浅, 这套峰的强度越弱。 据此推测这套峰可能是由红珊瑚中的色素产生。
(2)角黄素理论拉曼光谱中主要存在1 512, 1 269, 1 189, 1 159和999 cm-1的拉曼峰, 分别主要由C=C伸缩振动, C— H摇摆振动, C— C伸缩振动, C— C伸缩振动与甲基的摇摆振动产生, 同时这套峰的形状位置与红珊瑚的1 514, 1 295, 1 177, 1 125和1 016 cm-1拉曼峰高度吻合, 推测这些红珊瑚的拉曼峰主要是由于角黄素分子的一系列振动引起的。 故将红珊瑚的1 514, 1 295, 1 177, 1 125和1 016 cm-1拉曼峰分别归属为C=C伸缩振动, C— H摇摆振动, C— C伸缩振动, C— C伸缩振动与甲基的摇摆振动。
(3)本次研究使用密度泛函理论计算了红珊瑚中色素角黄素分子的理论拉曼光谱, 创新性将拉曼光谱实验与拉曼光谱理论计算结合来解释红珊瑚拉曼光谱中的谱峰归属问题, 为使用拉曼光谱鉴定红珊瑚提供了理论基础, 并为以后研究相关生物类宝石材料的谱学归属问题提供了一种新思路。
| [1] |
|
| [2] |
|
| [3] |
|
| [4] |
|
| [5] |
|
| [6] |
|
| [7] |
|
| [8] |
|
| [9] |
|
| [10] |
|
| [11] |
|
| [12] |
|
| [13] |
|
| [14] |
|