便携式能量色散X射线荧光光谱法对钢铁材料中的镧和铈的快速检测
[倪子月1  , 程大伟
, 程大伟2 , 刘明博2 , 韩冰2 , 李小佳1, 2 , 陈吉文3 ]
, 程大伟|
|


稀土元素具有独特的电子结构, 化学性质活泼, 是冶金工业中重要的添加剂, 在许多领域发挥了重要的作用。 稀土添加剂不仅可以作为脱氧剂和脱硫剂对钢液进行净化, 还会对钢材产生变质作用和合金化作用, 改善钢组织, 提升钢种的性能。 但是钢铁材料中稀土元素的含量添加只有在一定范围内, 才会表现出较好的性能。 而通常使用电感耦合等离子体质谱法和电感耦合等离子体发射光谱法对钢铁材料中稀土元素进行检测, 这两种方法均需要对样品进行消解处理, 操作繁琐, 测试周期长。 使用便携式能量色散X射线荧光光谱法可以实现钢铁材料中稀土元素镧和铈的快速检测, 且整个仪器重量小于10 kg, 便于现场应用。 在传统便携式仪器的基础上, 使用大功率的光管对稀土元素的K系谱线进行激发, 与选择L系谱线进行分析对比, 不仅提高了谱线强度, 同时还避免了钢铁材料中其他常见组分对待测元素谱峰的重叠干扰。 测试时间设置为120 s, 通过研究不同的管电流和管电压研究峰强度和峰背比的变化情况, 最终选择800 μA和65 kV对样品进行激发。 使用参考物质绘制工作曲线, 同时使用背景强度对基体效应进行校正后, 镧和铈的线性相关系数分别可达到0.999 2和0.998 8; 对含量较低的参考样品GBW01135进行测试, 计算方法的检出限和定量限, 镧和铈的检出限分别为0.001 1%和0.000 5%, 定量限分别为0.003 8%和0.001 6%, 满足实际样品的测试需求。 使用样品GBW01132a进行11次连续测定, 对测试结果的稳定性进行研究, 镧和铈的相对标准偏差分别为2.42%和2.00%; 同时对测试结果的准确性进行研究, 对多个样品进行测试并与参考值进行对比, 结果表明除了一个低于检出限的样品之外, 其余样品的相对误差均小于20%,其中70%的样品的相对误差小于10%。 能量色散X射线荧光光谱法可实现钢铁材料中稀土元素的快速检测, 样品只需要简单的打磨处理就可以直接进行测试, 对进一步研究钢铁材料的性能具有一定的意义。
Biography: NI Zi-yue, (1988—), female, PhD candidate, Central Iron and Steel Research Institute e-mail: niziyue@ncschina.com
Rare earth elements, with their unique electronic structure and active chemical properties, are important additives in the metallurgical industry and play an important role in many fields. Not only can rare earth additives be used as deoxidizer and desulfurized to purify the molten steel, but also have metamorphism and alloying effects on the steel, which can improve the structure and performance of the steel materials. However, only with a certain range can the addition of rare earth elements in steel materials shows good properties. Although inductively coupled plasma mass spectrometry and inductively coupled plasma atomic emission spectrometry are usually used to detect rare earth elements in steel materials, which require sample digestion and tedious operations for a long test period. In this study, portable energy dispersive X-ray fluorescence spectrometry was used to realize the rapid detection of lanthanum and cerium in steel materials, and the whole weight of the instrument is less than 10 kg, which is convenient to test on-site. Compared with selecting L series lines for analysis and testing in the traditional portable instrument, a high-power X-ray tube is used to excite the K series spectral lines for rare earth elements, which can increase the intensity of analyzed peaks and avoid overlap interference of other common components in steel materials. The intensity and peak-to-background ratio were studied at different X-ray tube current and voltage when the measured time was set at 120s, and finally, the optimized parameters were chosen as 800 μA and 65 kV for irradiating samples. The calibration curves were drawn with reference materials, and the linear correlation coefficients of lanthanum and cerium were 0.999 2 and 0.998 8 respectively, after the correction of matrix effect by the intensity of the background. Reference samples of GBW01135 were chosen to calculate the detection limit and quantitation limit because both the content of La and Ce were of low content. Moreover,the detection limit of La and Ce was 0.001 1% and 0.000 5% respectively, and the quantitation limit was 0.003 8% and 0.001 6%, which satisfied the requirement of the actual test. The stability of the test was studied by 11 consecutive measurements for the sample of GBW01132a, and the relative standard deviation was 2.42% and 2.00% for La and Ce. Furthermore,the accuracy of the test results was also studied by testing multiple samples and comparing with reference values. The results showed that the relative error of the results were less than 20% except for one sample which was below the detection limit, and the relative error of more than 70% samples were less than 10%. The energy dispersive X-ray fluorescence spectrometry can realize the rapid detection of rare earth elements in steel materials, and the samples can be directly tested with simply polishing pretreatment, which is of certain significance for further research on the properties of steel materials.
Rare earth elements, due to their superior characteristics, have numerous applications in many fields[1], which has been widely used in metallurgical industry[2].Addition of rare earth elements, such as La and Ce, can improve the properties of steel, suppressing the detrimental effect of impurity elements[3], enhancing mechanical properties[4].Only the addition of rare earth elements in a certain range, can the steel materials be of good performance[5]. It is significant to detect La and Ce in steel materials rapidly.
The detection of rare earth elements by ICP-MS and ICP-AES has been reported[6, 7]. However, the mentioned approaches need a solution sample introduction to reduce matrix effects. Therefore, before testing, all the samples should be dissolved in the laboratory, which would take a long time and cause reagent contamination to our environment. Energy dispersive X-ray fluorescence spectrometry analysis has some characteristics, such as nondestructive, simple pretreatment, rapid detection, low requirements for environment, which makes it suitable for field testing. The application of XRF to detect elements has been employed in many aspects[8, 9, 10]. And the determination of rare earth elements has been realized in rock, soil and sediment with X-ray fluorescence instruments[11, 12, 13, 14]. D. S. Zinin et al investigated La-Sm in industrial sediments of calcium sulfate, the limits of detection were 0.022% and 0.013% for La and Ce respectively when using spectral L-series for quantitative analysis[15]. And the detection limits of rare earth elements were high with conventional EDXRF. At the meantime, the determination of La and Ce in steel materials has never been reported with EDXRF.
It is difficult to detect La and Ce in steel materials with conventional EDXRF. In the process of detection for steel materials, it is difficult to obtain the net peaks of Lα and Lβ for La and Ce, because the peaks overlap with the escape peak of Fe and Kα of Cr which were the common components in steel materials. On the other side, the mass-absorption coefficient is greater in steel material than the lighter matrix of silicate matrix because of its higher density, which leads to severe absorption of characteristic lines for elements containing in it. And mass-absorption coefficient increase with wavelength, L series lines will be absorbed more for its less penetrating.
The purpose of the present study was to develop a quantitative analytical method for directly analyzing rare earth elements of La and Ce in steel materials based on portable EDXRF. The whole instrument weighs less than 10 kg and could be powered by lithium batteries, which is convenient to test on site. The X-ray tube with the maximum tube voltage of 65 kV was adopted, which could excite the K series spectral lines of La and Ce in steels and lower the detection limits. And the samples were put directly into the chamber of the analyzer after grinding with 60-grit silicon carbide paper, and the background was used for the correction of the sample results to compensate for the matrix effects.
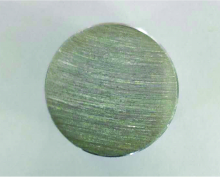
An X-ray fluorescence spectrometer (NCS TESTING TECHNOLOGY CO., LTD, NX-200S heavy metals analyzer) was employed.Reference materials were used and one picture of the sample was shown in Fig.1. The X-ray tube is the silver target, and the maximum power and tube voltage is 65 W and 65 kV. The detector type is SDD with the active area of 25 mm2, and the energy resolution is 125.3 eV at 5.895 keV (Mn: Kα). All samples were prepared by grinding with 60-grit silicon carbide paper. And samples were put in the sample chamber of the analyzer directly for being tested by X-ray fluorescence spectrometer.And the machine would show the results after 120 seconds.
 | Fig.1 The picture of sample |
The process of the detection based on the X-ray fluorescence were as follows: primary X-ray was emitted by X-ray tube under high voltage, and then irradiating sample to emit characteristic information related to composition. The detector would collect all the information, including the characteristic spectral lines of La and Ce. And through analyzing the energy and the intensity of the target peaks, La and Ce could be qualitative and quantitative analyzed.
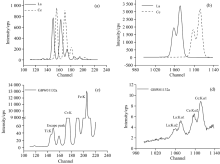
Both La and Ce have several peaks in the spectra, and the peaks are of different energy. K series peaks mainly include Kα, Kβ , and L series mainly include Lα, Lβ . The energy of these peaks was listed in Table 1. Lanthanum oxide and cerium oxide were measured respectively with the spectrometer, and the peaks of L series and K series were shown in Fig.2. We could conclude that K series lines were of higher intensity than L series lines. It is because that the transition probability and fluorescence yield of K series are higher than L series. Besides, the attenuation is smaller, and at the same time, the fluorescence intensity ratio of Kα is higher than Kβ . Besides L series spectral lines of lanthanum have interference with cerium. The spectral lines of sample GBW01132a were shown in Fig.2(c) and (d). L series lines were hardly observed because of the low content of rare earth elements and the overlap interference with the escape peak of Fe and Kα of Cr in steels. If excited by high voltage, K series spectral lines of both La and Ce could be clearly observed. So the Kα spectral lines were chosen for the qualitative and quantitative analysis for La and Ce.
| Table 1 The peak energy of La and Ce (keV) |
 | Fig.2 L series (a) and Kα lines (b) from La and Ce oxides and spectra of sample GBW01132a near L series (c) and Kα lines (d) of La and Ce |
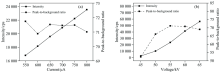
The elements of lanthanum and cerium have close energy excitation limits and exciting energy. Lanthanum oxide was measured to get the optimal condition for irradiating to samples. Through changing the tube current and voltage, primary X-rays could be adjusted for irradiating target elements in samples. The peak intensity and peak-to-background ratio were studied at different tube voltages with tube current of 800 μA and different tube currents with the tube voltage of 55 kV. As shown in Fig.3, the peak intensity increased with the increase of X-ray tube current and voltage. The peak-to-background ratio increased firstly and then decreased slowly with the increase of X-ray tube voltage, and basically had no substantial changes with the increase of X-ray tube current. Therefore, higher X-ray tube current and voltage should be chosen to achieve higher peak intensity and peak-to-background ratio. However, the X-ray tube should be used under certain restrictions, such as power, tube voltage, tube current. Considering that X ray tube should be used successively for a long time, the optimal current and voltage were chosen as 800 μA and 65 kV respectively.
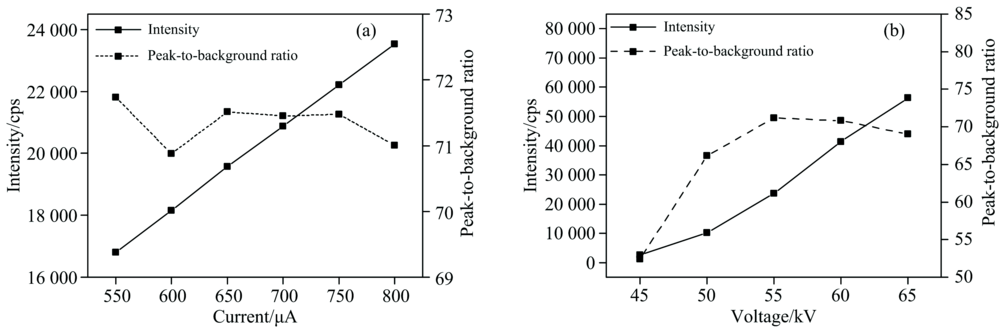 | Fig.3 The peak intensity and peak-to-background ratio of lanthanum with different X-ray tube current and voltage |
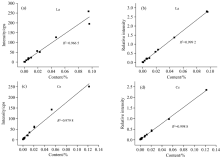
Reference samples were tested by the spectrometer, and the peak intensity increased with the increase of content for both La and Ce. Reference samples with different concentration were chosen to draw calibration curves, as shown in Fig.4. If the peak intensity of La and Ce was adopted as y axis directly, the linear correlation coefficient was 0.966 5 and 0.978 7, respectively. Without overlap interference, the peaks of elements in the samples were gauss peaks. When the sample contained no analytical elements, the peak region of interest still had counts because of matrix effects, which was defined as the background of this element. The count rate of peak region of interest was the sum of gauss peak and background for a sample containing analytical element. And after the correction of applying peak-to-background ratio as y axis, the linear relative coefficient was 0.999 2 and 0.998 8 for La and Ce respectively, which had been improved greatly. Therefore, the peak-to-background ratio taken as relative intensity could be used to correct the matrix effects and enhance the accuracy.
 | Fig.4 The calibration curve of La before (a) and after (b) correction; the calibration curve of Ce before (c) and after (d) correction |
The reference sample (GBW01132a) was measured 11 times successively with the content of 0.015% and 0.034% for La and Ce respectively, and the short term precision of this method was calculated with the measured results. And the results could be seen in Table 2. The relative standard deviation was 2.42% and 2.00% for La and Ce, which means that the short time stability was satisfactory for the analysis of steel samples by this method.
| Table 2 The short term precision experiments |
Reference samples were measured three times and, the mean values were compared with reference values, as shown in table3. The relative error of the sample GBW01137 was higher than the other samples because La and Ce were of low content which was below the limit of detection. Besides, the relative error of the samples was less than 20%, and the relative error of more than 70% samples was less than 10%.The results indicated that this method could be used to detect the content of La and Ce in steel materials rapidly.
| Table 3 The accuracy experiments |
Reference samples GBW01135 were chosen to calculate the detection limit and quantitation limit because both the content of La and Ce were of low content. And 11 samples were measured, as shown in Table 4. The standard deviations of the results were 0.000 4% and 0.000 2% for La and Ce respectively. Detection limits and quantitation limits could be obtained by multiplying standard deviations by 3 and 10. The detection limit of La and Ce was 0.001 1% and 0.000 5% respectively, and the quantitation limit was 0.003 8% and 0.001 6%, which satisfied the requirement of the actual test.
| Table 4 The limit of detection |
X-ray fluorescence spectrometry could be used to detect La and Ce in steel materials rapidly. At first, the spectral line of Kα was chosen for both La and Ce, and the measurementtime was set for 120 seconds, the optimal current and voltage were 800 μA and 65 kV respectively. Then calibration curves were drawn by testing reference samples, and after correction, the linear relative coefficient was 0.999 2 and 0.998 8 for La and Ce, respectively. The relative standard deviation was 2.42% and 2.00% for La and Ce after testing for 11 times, which means that the short time stability was good for the analysis of steel samples by this method. The relative error of the results was less than 20% except for a low content sample, and more than 70% sample results of the relative error were less than 10%, which meant that this method could be used to detect the content of La and Ce in steel materials rapidly. The detection limit of La and Ce was 0.001 1% and 0.000 5% respectively, and the quantitation limit was 0.003 8% and 0.001 6%, which satisfied the requirement of habitual content in steels.
| [1] |
|
| [2] |
|
| [3] |
|
| [4] |
|
| [5] |
|
| [6] |
|
| [7] |
|
| [8] |
|
| [9] |
|
| [10] |
|
| [11] |
|
| [12] |
|
| [13] |
|
| [14] |
|
| [15] |
|