


基于正交PLIF技术来评估2D火焰图像在反映锥形火焰3D结构方面的有效性
[李红 , 高强, 李晓峰, 张大源, 李博
* , 尧命发, 李中山]
, 高强, 李晓峰, 张大源, 李博, 尧命发, 李中山]
|
|


通过对平面激光诱导荧光(PLIF)图像进行分析, 可以获得湍流火焰中的火焰面密度( Σ)、 火焰刷厚度和湍流燃烧速度等关键参数, 通过二维火焰图像及火焰参数可建立三维火焰模型。 但目前二维PLIF图像能否精确反映三维火焰结构尚不明晰。 该研究用正交PLIF技术测量了甲烷/空气预混湍流火焰横截面(垂直于火焰传播方向)和纵截面(平行于火焰传播方向)上的二维OH分布, 然后通过对OH-PLIF图像的分析计算了火焰两截面的 Σ, 并分别比较了不同燃烧器出口速度、 火焰不同位置和不同燃空当量比条件下, 火焰两截面的 Σ的差别。 实验结果表明, 在相同条件下, 火焰纵截面的 Σ均比火焰横截面的 Σ偏小, 其差值大小与燃烧器出口速度, 火焰位置和燃空当量比相关。 这一现象说明, 最常采用的二维PLIF技术, 在精确反映三维火焰结构时具有一定的局限性。
Biography: LI Hong, (1993—), a Postgraduate Student in College of Mechanical Engineering, Tianjin University e-mail: 2015201016@tju.edu.cn
By analyzing planar laser-induced fluorescence (PLIF) images, the key parameters such as flame surface density ( Σ), flame brush thickness and turbulent combustion velocity in the turbulent flame can be obtained, and the three-dimensional (3D) flame structure can be reconstructed based on two-dimensional (2D) PLIF images and the key parameters. It is not clear, however, whether the 2D PLIF images can accurately reflect the 3D flame structure. In this study, the 2D OH distribution of methane/air turbulent premixed flames was measured using orthogonal PLIF in both horizontal plane (perpendicular to the flame propagation direction)and vertical plane (parallel to the flame propagation direction), and the Σ was calculated by analyzing the OH-PLIF images. The Σ in the two planes were obtained under various conditions, i.e., different exit velocities, different locations, and different equivalence ratios. The results showed that the Σ in the vertical plane was smaller than that in the horizontal plane under almost all the conditions, and the difference in Σ between the two planes is decided by the burner exit velocity, the location, and the equivalence ratio. This phenomenon shows that the 2D PLIF technique has some limitations in accurately reflecting the 3D flame structure.
Turbulent premixed combustion is an important fundamental combustion phenomenon is widely used in ignition engines, aircraft engines, etc. It is a complex phenomenon of coupling effects between chemical reactions and turbulent flow. Hence, quantitative measurement of its structural parameters is crucial for verifying flame models and designing new combustion devices[1]. Driscoll[2] has mentioned that a robust combustion model must be able to correctly predict the flame structural parameters such as flame surface density (Σ), flame brush thickness and turbulent combustion velocity. This indicates that the quantitative measurement of the structural parameters of turbulent premixed flames is of great significance.
Combustion laser diagnostic technique booms with the development of laser and detector technologies, among which planar laser-induced fluorescence (PLIF) has been widely used for two-dimensional (2D) flame structure visualization. PLIF can visualize different flame zones that are characterized by various intermediates such as OH[3, 4, 5], CH2O[6, 7, 8], H[9], CH[10, 11, 12, 13], and the quantitative 2D structural parameters of the flame can be obtained by analyzing the PLIF images. While the experimental devices and the data processing process of three-dimensional (3D) flame structure measurement based on PLIF are complicated and difficult to implement[14, 15, 16]. Therefore, most of the 3D flame structure acquisition is based on 2D PLIF experiments combined with a calculation method[17, 18]. However, the real flame is 3D, and some information of the flame may be missed during the 2D measurement, which may lead to the 3D reconstruction not accurate.
Zhang et al.[19] measured 2D Σ by single-plane OH-PLIF, and used different models to estimate 3D Σ based on 2D experimental data. They found that the 3D Σ calculated by the models are larger than 2D Σ measured in the experiments, and then deduced the wrinkled degree of the flame front in the horizontal plane differs from that in the vertical plane. But the calculated results have not been verified by any experiment. In this study, orthogonal PLIF[20] was adopted to measure the OH distribution in the horizontal and vertical planes of a turbulent premixed flame. The Σ was calculated through the OH PLIF images. By comparing the Σ values, the difference in the wrinkled degree between the two planes was analyzed, and the results can be used to verify the model results by Zhang et al[19].
A distributed and flameless combustion burner (DFCB) was used in the experiments. The burner was remolded based on a McKenna burner, and the center of the burner is a metallic plug that has a central hole (1.5 mm diameter) and a four-branches cross obstacle inside which aims to form a turbulent mixture. The mass flow controllers were used to control the equivalence ratio and the flow velocity. The detailed information of this burner can be found in the paper[21].
In this study, a dye laser (Continuum ND60, Rhodamine 590) pumped by an Nd:YAG laser (Spectra-Physics, PRO-290) was used as light source, which runs at 10 Hz with its pulse duration of 10 ns and pulses energy of 12 mJ. For OH PLIF measurements the Q1(8) line belonging to the X2Π -A2Σ+(0, 1) band at 283.553 nm was excited using the laser, and the fluorescence from the X2Π -A2Σ+(1, 1) and (0, 0) bands at around308 nm was detected.
The experimental setup is illustrated in Fig.1. The laser beam was transformed into the laser sheet through a cylindrical lens (-40 mm focal length) and the spherical lens (200 mm focal length). The laser sheet was 2 cm in height and 50 μm in thickness. Because the data are analyzed statistically, the 2D OH distribution measurement of the horizontal plane and the vertical plane of the flame was carried out separately. For vertical plane measurements [Fig.1(a)], the laser sheet passed through the center of the burner and was parallel to the propagation direction of the flame. The fluorescence of OH was collected through two combined Schott filters (WG305 and UG11) and a UV objective (UV Nikon, 105 nm focal length), and was finally captured by an ICCD camera (Princeton PI-MAX, 512×512 pixels) that is at the right angle to the laser sheet. For horizontal plane measurements [Fig.1(b)], the setup is similar to Fig.1(a), except that the laser sheet was perpendicular to the propagation direction of the flame, and the fluorescence was firstly reflected by a high reflective mirror and then collected by the ICCD camera. The PLIF images taken by ICCD in the experiments are single-shots.
 | Fig.1 The schematic of the experimental setup (The red dash lines show propagation path of the fluorescence captured by ICCD) |
In order to obtain Σ, the raw flame image was firstly binarized, and then the edge of the binary image was extracted. In the flamelet regime, Σ was defined as the amount of flame surface per unit volume[1]:
Where
To facilitate the discussion, Fig.2 presents the typical images of OH-PLIF at two different equivalence ratios with Ujet=60 m·s-1 (Ujet is flow speed) and y/d=9.3 (y is the height above the burner, d is the diameter of the plug). The white line in Fig.2 shows the flame front surface profile after binarization and edge extraction of the images. The first row in Fig.2 shows the OH PLIF images in the horizontal plane of the flame. It can be seen that the images are asymmetry, and this is because of the mirror used for reflecting the fluorescence in Fig.1(b) is not right above the flame in order not to perturb the flow field of the flame. The second row in Fig.2 shows the OH PLIF images in the vertical plane of the flame. It can be seen that the wrinkled degree of the flame front in the horizontal plane is similar to that in the corresponding vertical plane at each equivalence ratio. The red cross in Fig.2 is the center of the interrogation box, which is used to calculate Σ of the flame.
 | Fig.2 Single-shot PLIF images of OH from horizontal and vertical planes of the flame at Ujet=60 m·s-1, y/d=9.3 at different equivalence ratios (The color bar represents the relative intensity of the signal) |
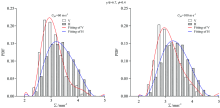
In order to study the effect of different flame conditions on the Σ in the two planes, the experiments were carried out at different exit velocities, different equivalence ratios and different flame positions. For each flame condition, 500 single-shot OH PLIF images were obtained. Figures 3, 4 and 5 are the PDF (probability density function) of the Σ in the two planes under various flame conditions, and the red curve and the blue curve in Figs.3, 4 and 5 are fitted by using the polynomial fitting in the Origin software.
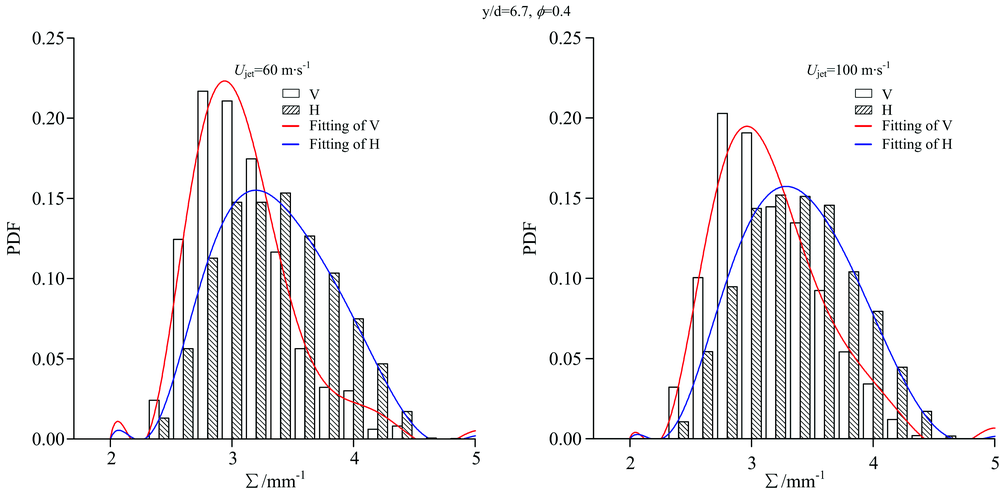 | Fig.3 Comparison of the distribution of PDF of Σ from horizontal and the vertical planes of the flame (V represents the vertical plane of the flame and H represents the horizontal plane of the flame) at different exit velocity when the equivalence ratio and flame height are constant (Φ =0.4, y/d=6.7) |
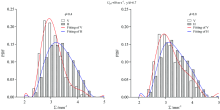
 | Fig.4 Comparison of distribution of PDF of Σ from horizontal and vertical planes of the flame at different equivalence ratio when exit velocity and flame height are constant (Ujet=60 m·s-1, y/d=6.7) |
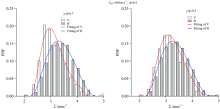
 | Fig.5 Comparison of distribution of PDF of Σ from horizontal and vertical planes of the flame at different flame height when exit velocity and equivalence ratio are constant (Ujet=100 m·s-1, Φ =0.4) |
It can be seen that the trends are the same under different conditions: the Σ in the vertical plane is smaller than that in the horizontal plane, which indicates that the wrinkled degree of the flame front in the vertical plane is generally smaller than that in the horizontal plane. This observation is in good agreement with the computational results of Zhang et al.[22]. Meanwhile, it can be found that the PDF of the Σ in the horizontal plane is relatively symmetrical, and the proportion of the small values of the PDF of the Σ in the vertical plane is large. It can be seen from Fig.3 that the difference of the peak of the curve is relatively smaller at Ujet=100 m·s-1. Similarly, there is a similar conclusion at Φ =0.8 or a higher flame position. In addition, it can be seen from the three figures that the fitting curves of the vertical plane are narrower than that of the horizontal plane, which indicates that the distribution of Σ in the vertical plane is more concentrated than that in the horizontal plane, and this phenomenon has not reported in any previous study.
The effect of the flame turbulence intensity on the difference in Σ between the two planes was quantitatively analyzed, and the results are shown in Fig.6. When the jet exit velocities are 30, 60 and 100 m·s-1, the corresponding Reynolds numbers of the flow field are 2 810, 5 620 and 9 300 respectively. Higher Reynolds number corresponds to higher jet exit velocity, and higher flame turbulence intensity. The y-axis is the difference in the Σ (the peak value in the PDF curve has been used here) between the two planes. It can be concluded from Fig.6 that when the flame turbulence intensity increases, the difference in Σ between the two planes increases as well. Besides, at the region of higher flame turbulence intensity, a “ saturation” effect is observed, which means that when the flame turbulence intensity increases even further, the difference in Σ will tend to remain constant.
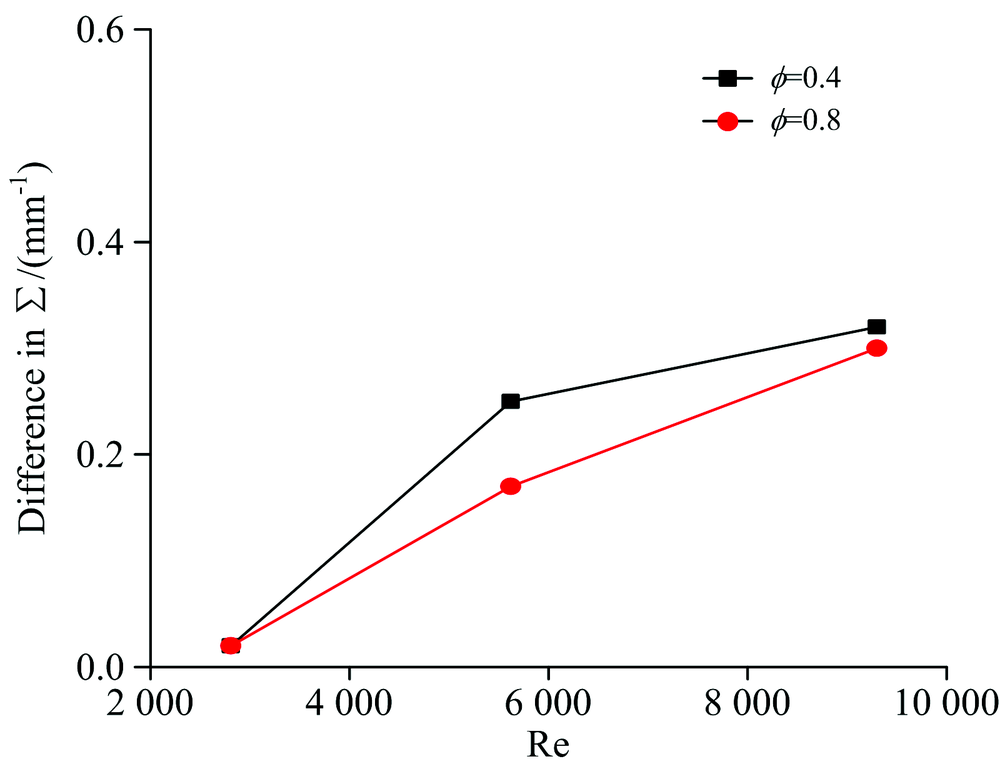 | Fig.6 Changes of Σ of the horizontal and vertical planes of flame with changes of Reynolds numcer at different equivalence ratios at y/d=6.7 (The abscissa Reynolds number represent the different burner exit velocities, and the ordinate is the difference between maximum values of PDF distribution of Σ of the two planes) |
The phenomena could be explained by the stretching effect. The gas flows through the burner exit at a certain speed, which has a stretching effect on the flame surface. The vertical (upward) component of the gas flow velocity is bigger than the horizontal component, so there is a bigger stretching effect on the vertical plane than on the horizontal plane of the flame. Since the stretch will prevent wrinkle, higher stretching rate corresponds to lower wrinkled degree, which then leads to smaller Σ.
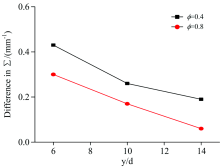
The effect of the equivalence ratios and flame positions on the difference in Σ between the two planes was quantitatively analyzed, and the results are shown in Fig.7. It can be concluded from Fig.7 that the difference of Σ of the two planes decreases with the increase of equivalence ratio when exit velocity and flame height are constant. Because the turbulence combustion velocity is larger when equivalence ratio closes to 1, which to some extent can weaken the stretching effect on the vertical plane of the flame resulting from the flow of the gas mixture, when exit velocity and equivalence ratio are constant, the difference of Σ between the horizontal and vertical planes of the flame decreases as the flame height increases, because gas velocity decreases gradually as the distance away from burner exit increases, resulting in a larger difference in Σ of the horizontal and vertical planes of the flame in the upstream position.
 | Fig.7 Changes of Σ of the horizontal and vertical planes of the flame with changes of y/d at different equivalence ratios at Ujet=60 m·s-1 |
Orthogonal PLIF was adopted to measure the OH distribution of methane/air turbulent premixed flames in two planes, namely the horizontal plane (perpendicular to the flame propagation direction), and the vertical plane (parallel to the flame propagation direction). The flame surface density (Σ) in the two planes were obtained under various conditions, i.e., different exit velocities, different locations, and different equivalence ratios. Results are summarized as follows:
(1) The Σ in the vertical plane is smaller than that in the horizontal plane under various conditions, which indicates that the wrinkled degree of the flame fronts in the vertical plane is generally smaller than that in the horizontal plane. This observation is in good agreement with the computational results of Zhang et al.[22]. In addition, the distribution of Σ in the vertical plane is more concentrated than that in the horizontal plane, which has not been reported by any previous study.
(2) When the equivalence ratio and flame height are constant, the difference in Σ between the two planes is smaller at lower turbulence intensity, and when the flame turbulence intensity increases (Reynolds numbers increases), the difference in Σ between the two planes increases as well. That might be owing to that there is a bigger stretching effect on the vertical plane than on the horizontal plane of the flame. At the region of higher flame turbulence intensity, a “ saturation” effect is observed, which means that when the flame turbulence intensity increases even further, the difference in Σ will tend to reach a plateau. When the exit velocity and flame height are constant, the difference in Σ between the two planes decreases with the increase of equivalence ratio, which might be owing to the increase of turbulent combustion velocity. When the exit velocity and equivalence ratio are constant, the difference in Σ between the two planes is smaller at the downstream of the flame. That might be owing to that there is a certain consumption in gas velocity at the downstream of the flame, which results in the weaker stretching effect on the flame surface. This phenomenon shows that the vertical-plane 2D PLIF technique, which is the most commonly used technique to measure the structure of symmetrical cone flames, has limitations in accurately reflecting the 3D flame structure, and it works relatively better in the downstream position, or at low-turbulence condition, or when the equivalence ratio is close to 1.
| [1] |
|
| [2] |
|
| [3] |
|
| [4] |
|
| [5] |
|
| [6] |
|
| [7] |
|
| [8] |
|
| [9] |
|
| [10] |
|
| [11] |
|
| [12] |
|
| [13] |
|
| [14] |
|
| [15] |
|
| [16] |
|
| [17] |
|
| [18] |
|
| [19] |
|
| [20] |
|
| [21] |
|
| [22] |
|
| [23] |
|