
海面溢油三维荧光光谱消除瑞利散射方法的研究
[孔德明1, 3  , 李雨蒙
, 李雨蒙1 , 崔耀耀2, * , 张春祥1 , 王书涛1 ]
, 李雨蒙, 张春祥|
|


作者简介: 孔德明, 1983年生, 燕山大学电气工程学院副教授 e-mail: demingkong@ysu.edu.cn
三维荧光光谱分析法以其灵敏度高、 选择性好、 操作简单和可用于多组分混合物分析等优点成为诸多研究者在海面溢油鉴别中的热点选择。 但三维荧光光谱中存在的瑞利散射会对光谱的准确检测产生较大的影响, 因此有效地消除瑞利散射对后续光谱的定性鉴别和定量分析具有重要意义。 采用仪器校正法、 空白扣除法、 Delaunay三角形内插值法和缺损数据重构(MDR)法对海面溢油三维荧光光谱中的瑞利散射进行校正。 首先以海水的SDS胶束溶液作为溶剂, 将航空煤油和润滑油按不同相对体积分数比配制8个校正样本和3个测试样本; 然后利用FS920稳态荧光光谱仪采集11个样本的三维荧光光谱数据, 并分别采用仪器校正法、 空白扣除法、 Delaunay三角形内插值法和缺损数据重构(MDR)法消除瑞利散射的干扰; 再利用核一致诊断法估计出最佳的组分数; 最后利用平行因子分析(PARAFAC)对混合油样本的三维荧光光谱数据进行定性鉴别和定量分析。 研究结果表明: 采用发射波长滞后激发波长以消除瑞利散射的仪器校正法会丢失部分有效光谱信息; 采用空白扣除法无法彻底消除瑞利散射, 在光谱中仍然存在散射干扰, 利用PARAFAC解析后得到的激发、 发射光谱会出现失真, 且预测的浓度值偏差较大; 采用Delaunay三角形内插值法消除瑞利散射后, 利用PARAFAC解析所得到的激发、 发射光谱与真实光谱吻合度较高, 且预测的浓度值偏差较小; 而采用MDR消除瑞利散射后, 利用PARAFAC解析所获得的激发、 发射光谱与真实光谱吻合度最高, 且相较于其他几种方法预测的浓度值偏差最小, 得到的样本回收率为98.9%和100%, 预测均方根误差均小于等于0.130。 根据定性鉴别、 定量分析的结果, MDR能够在保证原有特征光谱不失真的基础上有效消除瑞利散射带来的影响, 是一种消除三维荧光光谱数据中瑞利散射较为理想的方法。
Three-dimensional fluorescence spectroscopy has become a hot topic in the identification of oil spills by many researchers because of its high sensitivity, good selectivity, simple operation and analysis for multi-component mixtures. However, the Rayleigh scattering in the three-dimensional fluorescence spectrum will have a great influence on the accurate detection of the spectrum, so it is of great significance to eliminate the influence of the Rayleigh scattering effectively for the qualitative identification and quantitative analysis of the spectrum. In this paper, the instrument calibration method, background subtraction method, Delaunay triangle interpolation method and Missing Data Recovery (MDR) method were used to correct the Rayleigh scattering in the three-dimensional fluorescence spectrum of the oil spill. Firstly, the seawater SDS micelle solution was used as a solvent, the jet fuel and the lube were mixed according to different relative volume fraction ratios to prepare eight calibration samples and three test samples. Then, the three-dimensional fluorescence spectra of 11 samples were determined by FS920 steady-state fluorescence spectrometer. Moreover, the interference of Rayleigh scattering was eliminated by instrument calibration method, background subtraction method, the Delaunay triangle interpolation method and missing data recovery (MDR) method respectively. Then the kernel consensus diagnosis method was used to estimate the optimal number of components. Finally, the PARAFAC was used to qualitatively identify and quantify the three-dimensional fluorescence spectrum data of the mixed oil samples. The results show that the instrument calibration method using the emission wavelength lag excitation wavelength to eliminate Rayleigh scattering will lose part of the effective spectral information. The background subtraction method cannot completely eliminate the Rayleigh scattering, and there is still scattering interference in the spectrum. The excitation and emission spectra obtained by PARAFAC will be distorted, and the predicted concentration value deviation is large. After the Rayleigh scattering is eliminated by Delaunay triangle interpolation method, the excitation and emission spectra obtained by PARAFAC have a higher agreement with the real spectrum, and the predicted concentration value deviation is small. However,after the Rayleigh scattering is eliminated by MDR, the excitation and emission spectra obtained by PARAFAC analysis have the highest agreement with the real spectrum, and the predicted concentration value deviation is the smallest of these methods, and the sample recovery rate is 98.9% and 100% respectively, the RMSEP is limited to less than 0.130. According to the results of qualitative identification and quantitative analysis, MDR can effectively eliminate the influence of Rayleigh scattering on the basis of ensuring that the original characteristic spectrum is not distorted. It is an ideal method to eliminate Rayleigh scattering in the three-dimensional fluorescence spectrum.
石油是世界三大能源之一, 随着经济社会的快速发展, 石油的开采量和使用量也逐年增加, 海面溢油污染已成为全球海洋污染的重要问题之一。 三维荧光光谱分析法是一种有效鉴别海面溢油的方法。 然而, 在荧光光谱实验过程中会出现不符合三线性的瑞利散射光谱。 瑞利散射光的波长与入射光波长相等, 瑞利散射光的强度与波长的四次方成反比, 有时其强度甚至强于油类物质的荧光强度。 瑞利散射的存在会掩盖待测样品本身的荧光峰, 并且会对待测样品真实光谱数据的获取产生干扰。 它是一种典型的“ 缺陷数据” 。 因此, 在数据处理前需要消除三维荧光光谱中的瑞利散射[1]。
消除瑞利散射的方法主要有仪器校正法[2]、 空白扣除法[3, 4]、 Delaunay三角形内插值法[5, 6]和缺损数据重构(missing data recovery, MDR)法[7]等。 王玉田[2]等利用激发起始波长始终超前发射起始波长的仪器校正法避免一级瑞利散射的干扰。 Eilers[4]等提出了一种可以清除单个发射光谱的拉曼、 瑞利散射的空白扣除模型。 Li[5]等针对计算机X射线断层术(computer tomography)成像系统中X射线图像增强器(Xrii)图像失真的问题, 利用Delaunay三角形内插值法不仅基本消除了散射还保留了有效三维荧光光谱数据。
本文运用MDR结合PARAFAC对航空煤油和润滑油混合的两组分混合油SDS胶束溶液三维荧光光谱的瑞利散射进行校正处理, 并与仪器校正消除散射法、 空白扣除法和Delaunay三角形内插值法消除散射的效果进行了对比。 研究结果表明, 本文所用的MDR方法可以在保证海面溢油污染物三维荧光光谱特征信息不丢失的前提下, 实现有效消除瑞利散射的目的。
荧光光谱分析中, 在激发波长数为I、 发射波长数为J情况下, 测定K个样本得到的激发发射荧光光谱矩阵(EEMs)可构成三维响应数据矩阵X(I×J×K), 其满足三线性模型[8, 9], 表达式如式(1)所示
式(1)中: i=1, 2, 3, …, I; j=1, 2, 3, …, J; k=1, 2, 3, …, K; aiu为相对激发光谱阵AI×U中的元素(i, u); bju为相对发射光谱阵BJ×U中的元素(j, u); cku为相对浓度阵CK×U中的元素(k, u); eijk为X的三维残差数据阵元; U为有荧光贡献的组分数。
PARAFAC结合MDR的计算过程如下[7]:
(1) 准确识别三维荧光光谱矩阵中的瑞利散射区域, 一般为EM-EX=±10~15 nm的对角线区域;
(2) 设置加权矩阵W, 保证矩阵大小与三维荧光光谱相同, 将对应三维荧光光谱矩阵中缺损数据部分置零, 其余部分置1;
(3) 将三维荧光光谱散射区域的数据设为缺损数据(missing data), 置初始值, 可为0;
(4) 确定组分数U;
(5) 初始化相对激发光谱矩阵A和相对发射矩阵B;
(6) 利用X, A和B得出C, 如(2)式所示
式(2)中k=1, 2, 3, …, K, Z..k为缺损数据的重构矩阵, 由式(3)计算得出
以下步骤(7)和步骤(8)中得出Z..k的方法同上。
(7) 利用X, B和C得出A, 如式(4)所示
(8) 利用X, A和C得出B, 如式(5)所示
(9) 重复上述步骤(6)—步骤(8)直到缺损数据的损失函数
实验采用由英国Edinburgh Instruments公司生产的FS920稳态荧光光谱仪测定样本的三维荧光光谱数据。 设置仪器的激发与发射狭缝宽度均为1.11 mm, 对应光谱分辨率为2 nm。 设置激发波长范围为260~500 nm, 步长为10 nm; 发射波长范围为280~520 nm, 步长为5 nm。 所有实验均在室温下进行。
将航空煤油(H)和润滑油(R)作为污染物质, 十二烷基硫酸钠(SDS)作为溶剂来配制实验样本。 混合油样本各组分相对体积分数比信息如表1所示。
| 表1 混合油实验样品中航空煤油和润滑油的各组分相对体积分数比 Table 1 Relative volume fraction ratio of Jet fuel and Lube in mixed oil samples |
具体配制步骤如下: 首先配置海水的SDS胶束溶液; 其次配制样本前分别配置了航空煤油标准溶液(浓度10.0 mg·mL-1)、 润滑油标准溶液(浓度10.0 mg·mL-1); 最后用高精度移液器分别移取不同体积的标准溶液于容量瓶中充分混合并加入海水SDS胶束溶液定容配制成11个不同体积分数比的实验样本。 表1中C1—C8为校正样本, T1—T3为测试样本。
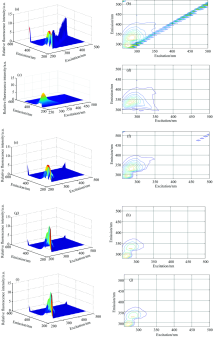
对表1中各样本进行三维荧光光谱数据采集。 以C4样本为例, 由图1(a)和(b)可知, 瑞利散射的存在掩盖和干扰了实验样本的三维荧光光谱特征信息。 因此, 原始三维荧光光谱需要进行光谱校正(即消除瑞利散射)才能进行后续光谱处理。 由图1(c)和(d)可知, 采用仪器校正法, C4样本三维荧光光谱中瑞利散射虽然得以消除, 但在消除散射的同时损失了散射区域的荧光信息, 这会对后续三维荧光光谱分析的准确性产生影响。 由图1(e)和(f)可知, 采用空白扣除法无法完全消除瑞利散射, C4样本三维荧光光谱及等高线图中仍可直接观察到残存的瑞利散射峰。 瑞利散射的不完全消除会导致校正后光谱在局部边缘区域失真, 校正后光谱图轮廓偏离真实光谱。 由图1(g)和(h)可知, 经过校正后, C4样本三维荧光光谱及等高线图中瑞利散射被基本消除, 散射区域荧光数据拟合性好, 光谱还原度较高。 由图1(i)和(j)可知, 经过校正后, C4样本三维荧光光谱及等高线图中瑞利散射在保留原有三维荧光光谱特征信息的前提下基本被完全消除, 重构区域荧光数据修复拟合效果良好, 光谱还原度高。
 | 图1 C4样品校正前及不同方法校正后的对比 (a): 原始三维光谱图; (b): 原始等高线图; (c): 仪器校正后三维光谱图; (d): 仪器校正后等高线图; (e): 空白扣除后三维光谱图; (f): 空白扣除后等高线图; (g): Delaunay三角形内插值处理后三维光谱图; (h): Delaunay三角形内插值处理后等高线图; (i): 缺损数据重构后三维光谱图; (j): 缺损数据重构后等高线图Fig.1 Comparison of original and corrected C4 samples by different methods (a): Original three-dimensional spectral map; (b): Original contour map; (c): Corrected three-dimensional spectral map by instrument; (d): Corrected contour map by instrument; (e): Three-dimensional spectral map after background subtraction; (f): Contour map after background subtraction; (g): Three-dimensional spectral map after the Delaunay triangle interpolation; (h): Contour map after the Delaunay triangle interpolation; (i): Three-dimensional spectral map after missing data recovesy; (j): Contour map after missing data recovery |
利用PARAFAC对经过不同方法消除散射的T2实验样本进行2组分三线性分解, 结果如图2所示。 图2中Factor1和Factor2分别为T2实验样本的两种未知组分的光谱曲线, Lube和Jet fuel分别为真实的润滑油和航空煤油的光谱曲线。 由图2(a)和(b)可知, 解析得出的各组分激发、 发射光谱明显偏离真实光谱。 由图2(c)和(d)可知, 解析得出的各组分激发、 发射光谱与真实光谱也有所偏离。 由图2(e)和(f)可知, 解析得出的各组分激发、 发射光谱与真实光谱曲线线形一致度较高且各组分荧光主峰与真实组分荧光主峰对应波长位置基本一致。 由图2(g)和(h)可知, 解析得出的各组分激发、 发射光谱与真实光谱曲线基本重合。 定性分析结果表明, 对比其他消除散射的方法, 采用MDR消除瑞利散射, 解析得出的激发、 发射光谱与真实激发、 发射光谱吻合度最高。
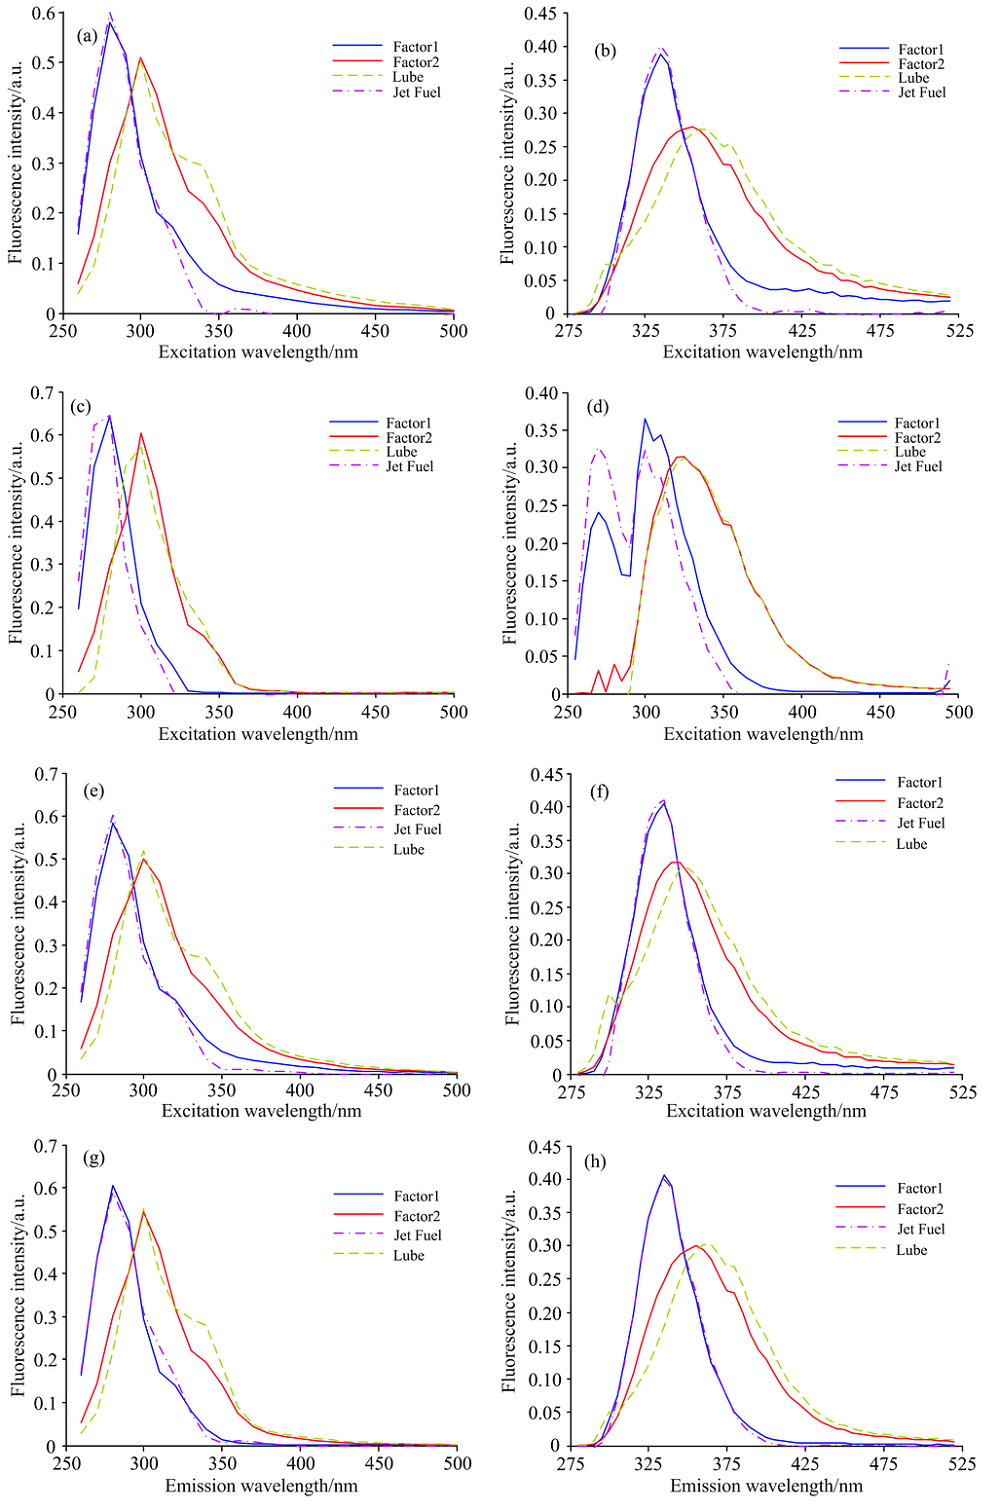 | 图2 T2的PARAFAC解析结果 (a): 仪器校正后激发光谱; (b): 仪器校正后发射光谱; (c): 背景扣除后激发光谱; (d): 背景扣除后罚射光谱; (e): Delaunay三角形内插值后激发光谱; (f): Delaunay三角形内插值后发射光谱; (g): 缺损数据重构后激发光谱; (h): 缺损数据重构后发射光谱Fig.2 Analytical results of PARAFAC algorithm for T2 (a): Relative excitation spectra; (b): Relative emission spectra; (c): Fourth dimensional decomposition graph; (d): Emission spectra after background subtraction; (e): Excitation spectra after delaunay triangle interpolation; (f): Emission spectra after delaunay triangle interpolation; (g): Excitation spectra after missing data recovery; (h): Emission spectra after missing data recovery |
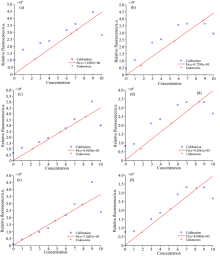
利用PARAFAC对经不同方法消除散射后的混合油样本解析后得到的相对荧光强度与各组分相对浓度进行回归分析, 结果如徒3所示。 图3中, 蓝色圆圈分别表示校正样本C1—C8中的润滑油和航空煤油组分, 红色十字分别表示预测样本T1—T3中的润滑油和航空煤油组分。 观察并对比图3(a)—(f)可知, 图3(a)—(d)中预测样本点集出现远离拟合直线的情况, 而图3(e)和(f)中预测样本点集更加紧密的分布在拟合直线上或分布在直线周围, 拟合程度更高。 经分析可知, 利用PARAFAC对MDR消除散射后混合油样本的定量分析可以达到较高精度。
 | 图3 PARAFAC分解的浓度回归曲线 (a): 背景扣除后润滑油组分浓度回归曲线; (b): 背景扣除后航空煤油组分浓度回归曲线; (c): Delaunay三角形内插值后润滑油组分浓度回归曲线; (d): Delaunay三角形内插值后航空煤油组分浓度回归曲线; (e): 缺损数据重构后润滑油组分浓度回归曲线; (f): 缺损数据重构后航空煤油组分浓度回归曲线Fig.3 Decomposition of concentration regression curve by PARAFAC algorithm (a): Regression curve of component concentration of lube after background subtraction; (b): Regression curve of component concentration of jet fuel after background subtraction; (c): Regression curve of component concentration of lube after delaunay triangle interpolation; (d): Regression curve of component concentration of jet fuelafter delaunay triangle interpolation; (e): Regression curve of component concentration of lubeafter missing data recovery; (f): Regression curve of component concentration of jet fuel after missing data recovery |
利用PARAFAC分别对经背景扣除法、 Delaunay三角形内插值法和MDR消除散射后的混合油样本进行定量分析, 将混合油各组分的相对浓度预测和回收率列入表2中。 表2中, RMSEP为预测均方根误差(root mean square error of prediction), AR为平均回收率(the average recovery rate), RE为相对误差(relative error)。 对比表2定量分析结果可知, 利用PARAFAC对经MDR消除散射后的混合油样本的浓度预测效果最好; 利用其对经Delaunay三角形内插值法消除散射后的混合油样本的浓度预测效果次之; 利用其对经背景扣除法消除散射后的混合油样本的浓度预测效果最差。 实验结果表明, 对比其他消除散射的方法, 利用二阶校正算法对经MDR消除散射后的混合油样本中各组分相对浓度进行预测可获得更为满意的回收率。
| 表2 测试样本的浓度预测和回收率 Table 2 Concentration prediction and recovery of test samples |
使用仪器校正法、 背景扣除法、 Delaunay三角形内插值法以及MDR在实验室环境下对模拟海面溢油污染物三维荧光光谱中的瑞利散射进行校正, 并利用PARAFAC进行三线性分解以对其校正效果进行评估、 对比。 研究结果表明, MDR能够更加彻底的消除瑞利散射, 与PARAFAC结合解析出的光谱曲线与真实光谱曲线一致度更高, 得到的样本回收率为98.9%和100%, 预测均方根误差均小于等于0.130, 优于其他消除散射的方法。 本研究为海面溢油三维荧光光谱中瑞利散射的有效消除提供了重要参考。
| [1] |
|
| [2] |
|
| [3] |
|
| [4] |
|
| [5] |
|
| [6] |
|
| [7] |
|
| [8] |
|
| [9] |
|