

基于背景水分扣除的水泥生料成分的近红外光谱建模
[胡荣1, 2  , 刘文清
, 刘文清2 , 徐亮2, * , 金岭2 , 杨伟锋2 , 沈先春2 , 成潇潇2 , 王钰豪2 , 胡凯2 , 刘建国2 ]
, 刘文清, 金岭|
|


作者简介: 胡 荣, 女, 1991年生, 中国科学技术大学环境科学与光电技术学院博士研究生 e-mail: 736649627@qq.com
傅里叶变换红外光谱技术(FTIR)在水泥生料成分的在线分析上具有巨大的潜力。 但因现场环境复杂, 空气湿度不稳定, 会对生料样品中Fe2O3, SiO2, CaO和Al2O3四种关键成分的在线FTIR定量分析形成一定干扰。 使用生料在线FTIR分析仪对不同湿度条件下的水泥生料样品进行了近红外光谱采集, 分析了不同湿度对近红外光谱定量分析的影响, 并提出一种消除背景水分吸收的方法。 具体研究内容为: (1) 通过对两种不同湿度条件下的各50个样品的光谱分析得到: 高湿度的样品光谱与低湿度的样品光谱比较, 形状类似, 但吸光度整体降低, 基线倾斜。 表明背景水分影响了样品的近红外光谱。 (2) 分别建立高湿度、 低湿度条件下的样品的定量分析模型, 预测另一湿度条件下的预测集中8个样品的四种成分含量。 得到: ①高湿度模型预测样品中4种成分含量与标准值之间的相关系数( r)为83.74%~92.74%, 均方根误差(RMSE)为0.12~0.83; ②低湿度模型预测的 r为67.32%~82.41%, RMSE为0.12~0.84。 表明背景水分影响了水泥生料成分的FTIR定量分析。 (3) 为了消除背景水分造成的影响, 从实测光谱中消除背景水分的特征吸收后, 分别建立了高湿度、 低湿度条件下的样品的FTIR定量分析模型, 并对预测集样品的四种成分含量进行预测。 得到: ①高湿度条件下, 消除背景水分后的模型较未消除前的模型预测的准确度提高, 预测的 r为90.73%~97.76%, RMSE为0.12~0.82; ②低湿度条件下, 消除背景水分后的模型较未消除前的模型预测的准确度提高, 预测的 r为94.07%~98.69%, RMSE为0.12~0.82; ③高湿度、 低湿度条件下, 消除背景水分后的2个模型预测的 r均达到90%以上。 表明了该方法可有效消除背景水分对水泥生料成分定量分析模型预测的影响, 为实现基于FTIR的水泥生料成分的在线分析提供了理论基础和技术支持。
, LIU Wen-qing, JIN LingFourier transform infrared (FTIR) spectroscopy has great potential for on-line analysis of cement raw meal components. As the air humidity on site is not stable due to the complex environment, it will cause interference to the on-line FTIR quantitative analysis of the four key components of Fe2O3, SiO2, CaO, Al2O3 in the raw material samples. In this paper, the on-line FTIR analyzer for raw meals was used to collect near-infrared spectra of raw meal cement samples under different humidity conditions. The influences of different humidity conditions on near-infrared quantitative analysis were analyzed, and a method of eliminating the background moisture interference was proposed. The specific researches were as follows: (1) Spectra of each 50 samples at two different humidity levels were analyzed. The results were that sample spectra at high humidity level compared to that at low humidity level were similar in shape, while the absorbance intensities were deceased overall and baselines were inclined. These demonstrated that background moisture affected the near-infrared spectra of the samples. (2) Two FTIR quantitative analysis models for samples under high humidity and low humidity conditions were established respectively, and the four component contents of 8 samples in prediction set under another humidity condition were predicted. The results were that the values of the correlation coefficient ( r) between the content values of the four components predicted by model under high humidity condition and the standard values in the prediction set were 83.74%~92.74%, and the values of the root mean square error (RMSE) were 0.12~0.83. The values of R obtained by model under low humidity condition were 67.32%~82.41%, and the values of RMSE were 0.12~0.84. These indicated that background moisture had affected the FTIR quantitative analysis of raw meal cement components. (3) In order to eliminate the influence of water absorption, the characteristic absorption of background moisture from the measured spectrum were removed refer to the mid-infrared spectroscopy technique. The FTIR quantitative analysis models under high humidity and low humidity conditions were established respectively, and the four components contents of samples in prediction set were predicted by these models. The results were as follows: ① Under high humidity condition, the prediction accuracy of the model with eliminating moisture absorption was improved compared with model without eliminating moisture absorption, the predicted values of r were 90.73%~97.76%, and the values of RMSE were 0.12~0.82, ② Under low humidity condition, the prediction accuracy of model with eliminating moisture absorption was higher than that of model without eliminating moisture absorption, and the predicted values of r were 94.07%~98.69%, the values of RMSE were 0.12~0.82, ③ The values of r obtained by models under high and low humidity conditions were above 90%. The experimental results showed that the method could effectively eliminate the influence of moisture absorption on the quantitative analysis model of raw material cement compositions. It provided the theoretical basis and technical support for the online analysis of raw material cement compositions based on FTIR technology.
水泥生料质量控制是生产优质水泥的关键一环。 由于物料成分波动, 水泥生料中的4种关键成分Fe2O3, SiO2, CaO和Al2O3配比会发生变化。 及时检测这四种成分的含量并调整其配比, 对水泥生料的质量控制具有重要意义。 现有的生料成分检测方法有荧光分析法[1, 2, 3]和中子活化法[4, 5]。 荧光分析法是一种离线的分析方法, 需要从生产线上采集生料, 在实验室进行成分分析, 过程繁琐且耗时。 中子活化法需要中子源, 若发生泄漏会对人体产生严重危害。 而傅里叶变换红外(Fourier transform infrared, FTIR)光谱是一种安全快捷、 可在线的分析方法, 在水泥生料成分的在线检测的应用上具有巨大潜力[6, 7, 8]。
在实际的水泥生产现场, 由于环境不可控, 需要考虑环境湿度变化对样品的FTIR定量分析模型造成的影响。 水分在近红外波段存在强烈的吸收, 并与水泥生料矿物成分的特征吸收的近红外波段产生重叠。 研究表明水分会影响物质的近红外光谱[9]。 Janik等研究了水分对土壤的红外分析的影响, 得到光谱强度与水分含量呈非线性关系[10]。 王世芳等通过实验得到水分会掩盖表征土壤有机质信息的波段, 对土壤有机质检测造成干扰[11]。 背景水分的变动会对光谱的基线和吸收特征有显著影响, 影响后续的化学计量建模, 这是近红外分析的一个难点所在。 传统校正背景水分变动的方法是针对不同湿度背景下的样品构建模型, 但建模所需时间长, 且缺少物理解释。 为此本文在已有对水泥生料成分的FTIR分析基础上[12], 开展了背景水分含量对水泥生料成分的FTIR定量分析的影响研究, 并对扣除背景水分吸收的定量分析模型进行了探讨。
从实测光谱中扣除背景水分吸收特征, 再使用计量模型进行建模, 能降低或消除背景水分对水泥漫反射光谱的方差贡献。
通过HITRAN中采用逐线积分的方法计算压强、 温度修正后的任一波数ν 下的单位浓度的纯净水分的高分辨率吸收光谱为A0(ν )。 经过仪器线型修正[13], 获得匹配仪器信息的单位浓度的纯净水分吸收光谱Ac(ν )为
其中, A0(ν )为仪器线型修正前的光谱, {}中第一项、 第二项、 第三项、 第四项分别为干涉图截断、 干涉图采样、 扩展光源的立体角Ω 、 切趾函数fapod(x)对光谱的影响, L为光程, Lmax为最大光程差, Δ x为采样间隔, ν 0为中心频率, FT为傅里叶变换。
对于实测光谱, 不仅包括真实的样品吸收光谱, 还有背景水分的红外吸收。 考虑到水泥矿物成分吸收、 光谱基线相对水分在近红外波段的吸收特征比较缓慢[14], 设对实测光谱的贡献为Ae(ν )=a1+a2ν +a3ν 2+a4ν 3, 这里a1, a2, a3和a4均为系数。 根据朗伯比尔定律, 设背景水分的红外吸收为At(ν )=a5Ac(ν ), 这里a5为浓度。 则实测光谱Am可表示为:
令
其中, Ai为每一个对应波长下的光谱观察值。 通过非线性最小二乘迭代求解χ 2的最小值, 得到最佳拟合参数, 确定相应的背景水分吸收特征。
从实测光谱中扣除背景水分吸收特征后, 得到m个样品、 p个波长下的光谱矩阵A。 使用偏最小二乘方法(partial least squares, PLS)建立样品光谱矩阵A和n种成分含量的矩阵B的回归模型, 来预测待测样品成分含量, 回归关系为[12]
其中, C为系数矩阵, C=A(VT)-1RUT, 这里V是矩阵A的载荷阵, R是PLS的回归系数构成的对角矩阵, U是矩阵B的载荷阵。
样品为巢湖某水泥厂提供的符合生产要求的50组水泥生料。 这些样品用于建立定量分析模型, 其4种关键成分Fe2O3, SiO2, CaO和Al2O3含量和标准偏差如表1所示。 成分含量由荧光分析法测定, 作为标准参考值。 用两种方式处理样品, 得到: (1)第一组高湿度(相对第2组样品而言)样品集50个, 处理方式为: 将样品放置室内2 h, 记录室温为18.8 ℃, 空气相对湿度为17%; (2)第二组低湿度(相对第1组样品而言)样品集50个, 处理方式为: 将样品放入干燥箱中干燥9 h, 干燥温度为55 ℃, 冷却后使用。
| 表1 样品的Fe2O3, SiO2, CaO和Al2O3含量和标准偏差 Table 1 The contents and standard deviations of Fe2O3, SiO2, CaO, Al2O3 in samples |
采用相同厂家提供的8个水泥生料样品作为单独预测样品集, 样品中的Fe2O3, SiO2, CaO和Al2O3含量和标准偏差如表1所示。 这批样品的处理方式为: 样品放置室内2 h, 记录室温为20.5 ℃, 空气相对湿度为27%。
光谱采集用基于FTIR漫反射的水泥生料成分在线检测系统[12], 波段范围4 000~10 000 cm-1, 分辨率8 cm-1, 平均扫描32次, 每个样品重复3次采集所用时间为22 s。 采用PLS方法对样品FTIR光谱进行定量分析。 在分析之前, 先使用光谱预处理减小基线和噪声对光谱的干扰。 所有数据处理均采用Matlab软件。
将高湿度和低湿度两组样品的吸光度光谱进行比较, 如图1所示。
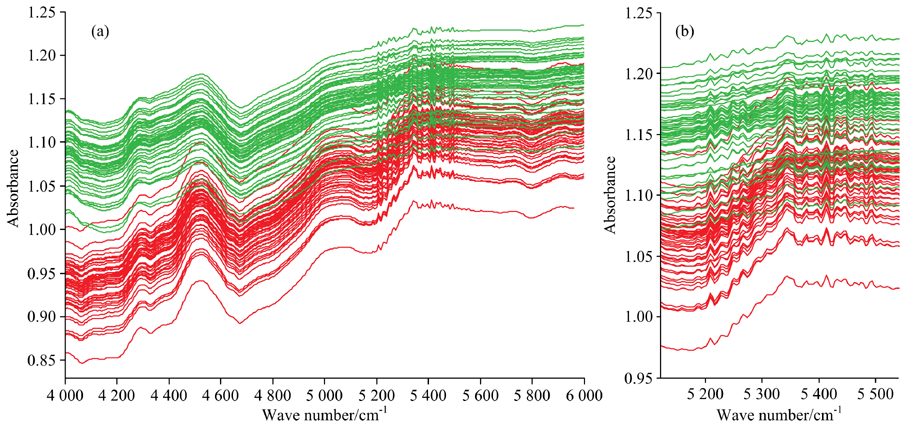 | 图1 高湿度(红色)与低湿度(绿色)样品吸光度光谱 (a): 4 000~6 000 cm-1; (b): 5 120~5 540 cm-1Fig.1 Absorbance spectra of samples with high humidity (red) and low humidity (green) (a): 4 000~6 000 cm-1; (b): 5 120~5 540 cm-1 |
从图1(a)中看到, 高湿度样品的光谱形状类似, 吸收峰位置重合; 低湿度光谱形状类似, 吸收峰位置重合。 同一湿度的样品吸光度的光谱强度高低随主要成分的含量高低综合影响。 从图1(b)中可以看到, 水泥生料样品在5 120~5 540 cm-1存有明显的水分吸收特征。 结合图1(a)和(b), 高湿度样品的光谱与低湿度样品的光谱比较, 形状类似, 但吸光度强度整体明显减低, 光谱各吸收峰也更为明显, 基线发生变化。 由于背景水分含量不同, 样品吸收一定的含量后散射特性发生改变, 导致光谱基线发生变化。
对光谱进行一阶求导预处理后, 分别使用高湿度样品和低湿度样品建立Fe2O3, SiO2, CaO和Al2O3的4种成分含量的FTIR光谱定量分析模型。 高湿度、 低湿度样品的定量分析模型对Fe2O3, SiO2, CaO和Al2O3含量的预测的结果如表2所示。 每个模型使用了50个样品, 包括校正集43个、 验证集7个。 近红外定量分析的评价指标要求: 较高的相关系数(correlation coefficient, r)和较低的均方根误差(root mean square error, RMSE)。
| 表2 高湿度、 低湿度样品建立的定量分析模型的预测结果 Table 2 The prediction results of quantitative analysis models established by samples with high humidity and low humidity, respectively |
分别使用高湿度、 低湿度样品的定量分析模型对预测集样品的Fe2O3, SiO2, CaO, Al2O3的含量进行预测, 结果如表3所示。 从表3中可以看出, 高湿度样品的定量分析模型预测样品的4种成分的含量的r为83.74%~92.74%, RMSE为0.12~0.83; 低湿度样品的定量分析模型预测的4种成分的含量的r为67.32%~82.41%, RMSE为0.12~0.84。 高湿度样品定量模型预测的准确度整体优于低湿度样品定量模型, 且两模型预测效果差异较大, 说明了背景水分影响了水泥生料成分的定量分析模型的预测精度。
| 表3 高湿度、 低湿度样品的定量分析模型对预测集样品进行预测的结果 Table 3 The prediction results of samples in prediction set by quantitative analysis models established by samples with high humidity and low humidity, respectively |
图2(a)是合成的单位浓度的纯净水分吸收光谱, 图2(b)是在5 120~5 540 cm-1波段上的样品(以一个低湿度样品为例)的实测光谱和拟合光谱。 从样品的实测光谱扣除背景水分吸收特征之后, 再进行样品的光谱定量分析。
 | 图2 (a)合成的单位浓度的纯净水分吸收谱; (b)实测光谱(红色)与拟合光谱(蓝色)Fig.2 (a) The obtained absorbance spectrum of pure water; (b) The measured (red) and the fitted (blue) spectra |
分别建立消除背景水分吸收的高湿度、 低湿度样品的定量分析模型, 对预测集样品中Fe2O3, SiO2, CaO和Al2O3的含量的进行预测, 结果如表4所示。 从表4中可以看出, 消除背景水分吸收后的高湿度样品的定量分析模型预测样品的4种成分的含量的r为90.73%~97.76%, RMSE为0.12~0.82, 准确度明显优于未消除背景水分吸收的模型。 消除背景水分吸收的低湿度样品的定量分析模型预测样品的4种成分的含量的r为94.07%~98.69%, RMSE为0.12~0.82, 准确度明显优于未消除水分吸收的模型。 消除水分吸收后的高湿度、 低湿度样品的定量分析模型预测样品的4种成分含量的r均达到90%以上, 消除背景水分吸收后明显提高了模型的准确度, 该方法能有效的扣除背景水分对定量分析带来的影响。
| 表4 消除背景水分吸收的高湿度、 低湿度样品的定量分析模型的预测结果 Table 4 The prediction results of quantitative analysis models with eliminating moisture absorption established by samples with high humidity and low humidity |
实验结果表明背景水分影响水泥生料样品的光谱, 湿度越大, 吸光度光谱强度越低, 且光谱基线发生改变。 对预测集样品的4种成分的含量进行预测, 高湿度样品的定量分析模型预测的r为83.74%~92.74%, RMSE为0.12~0.83; 低湿度样的定量分析模型预测的r为67.32%~82.41%, RMSE为0.12~0.83。 两模型预测效果存在差异, 说明水分影响了水泥生料成分的FTIR定量分析模型的准确度。
消除背景水分吸收后, 对预测集样品的4种成分的含量进行预测, 得到: 高湿度样的定量分析模型准确度明显优于未消除背景水分吸收的模型, 预测的R整体提高至90.73%~97.76%; 消除背景水分吸收的低湿度样的定量分析模型准确度明显优于未消除背景水分吸收的模型, 预测r提高至94.07%~98.69%。 消除背景水分吸收后的高湿度、 低湿度样品的2个定量分析模型, 预测的r均达到90%以上。 上述结果表明了该方法在水泥生料成分的FTIR定量分析中可有效扣除背景水分吸收造成的干扰。
| [1] |
|
| [2] |
|
| [3] |
|
| [4] |
|
| [5] |
|
| [6] |
|
| [7] |
|
| [8] |
|
| [9] |
|
| [10] |
|
| [11] |
|
| [12] |
|
| [13] |
|
| [14] |
|