

基于近红外光谱和变分自编码建模鉴别多类药物
[郑安兵1  , 杨辉华
, 杨辉华1, 2, * , 潘细朋1, 2 , 尹利辉3 , 冯艳春3 ]
, 杨辉华, 潘细朋|
|


不同厂商(品牌)的药品仍存在一定的差异, 价格不同, 有销售商家用低廉药物产品换上假的大品牌包装在市场上高价销售。 无专利药品或无生产、 销售(如走私进口药)许可资质的药品也有可能贴上伪造的正规品牌包装在市场上出售。 这些药品逃避药物监管和审批程序, 损害消费者利益并给整个药物市场带来重大危害。 因此, 准确鉴别不同来源的药品在药品质量监管中具有重要意义。 近红外光谱分析(NIR)具有仪器成本低、 可直接测量、 可无损检测、 可现场检测等优点, 特别适合药品的快速建模分析。 采用近红外光谱直接鉴别出多个厂商、 品种的药品, 有重要应用价值同时又存在重大技术挑战, 主要体现在需要有效的提取特征器和合适的分类器。 自编码是深度学习方法中一个重要分支, 它主要用于数据的非线性降维特征提取。 变分自编码(VAE)是近年来最为流行的自编码算法, 它通过变分法学习输入数据的一族欠完备的单变量正态分布特征, 用以表示盲源因素对数据施加的影响, 具有较强的特征提取能力, 广泛应用于计算机视觉、 语音识别等领域, 在NIR分析方面未见报道。 基于VAE, 充分利用VAE既是特征提取器, 又是数据生成器的优点, 通过特殊设计的人工神经网络结构和损失函数, 构建面向多品种、 多厂商药品NIR分类模型。 以29个厂商生产的4种药品(盐酸二甲双胍片, 盐酸氯丙嗪片, 马来酸氯苯那敏片, 头孢呋辛酯片)的1 721个样本为实验对象, 建立药品的多品种、 多厂商分类鉴别实验。 对比SVM, BP-ANN, PLS-DA等传统化学计量学算法及稀疏自编码(SAE)、 深度信念网络(DBN)、 深度卷积网络(CNN)等深度学习算法, 其分类性能优良, 同时具有良好的鲁棒性和可扩展性。
Biography: ZHENG An-bing, (1974—), Ph. D. candidate, School of Automation, Beijing University of Posts and telecommunications e-mail: spztf@bupt.edu.cn
With the expansion of online pharmacies, more and more counterfeit drugs without drug patents or licenses will appear in the markets with forged brand packaging. It is inevitable that the low-cost drug products will be sold at a high price if there are no methods to identify the source. These drugs evade drug supervision and approval procedures, harm the interests of consumers and bring great risks to the whole drug market. Near infrared spectroscopy (NIR) has the advantages of low cost, direct measurement, non-destructive testing and on-site testing. It is especially suitable for the rapid modeling and analysis of drugs in the condition that there are effective feature extraction and appropriate classifiers. Meanwhile, Auto-encoding is an important branch of deep learning method, which is mainly used for extracting non-linear dimensional reduction feature of data, and Variational Auto-encoding (VAE) is the most popular Auto-encoding algorithm in recent years, it has strong feature extraction ability and is widely used in computer vision, speech recognition and other fields, yet there is no report on the NIR analysis. Based on VAE, through a specially designed artificial neural network structure and loss function, this paper constructs NIR classification model for multi-category and multi-manufacturer drugs. Four kinds of drugs (metformin hydrochloride tablets, chlorpromazine hydrochloride tablets, chlorphenamine maleate tablets, cefuroxime ester tablets) produced by 29 manufacturers were used as the experimental objects to establish the multi-class classification and identification experiments. Compared with SVM, BP-ANN, PLS-DA and sparse Auto-coding (SAE), deep belief network (DBN), deep convolution network (CNN), etc., the algorithm has excellent classification performance, good robustness and scalability.
Even if the drugs are produced according to the same standard, the product qualities are different when they are manufactured by different manufacturers (brands), and prices also varied greatly. It is inevitable that there are sellers who sell low-cost drug products with fake well-known brand packaging at high prices in the market since the main and most of the components is equal or similar. This is particularly serious in generic drug sale cases.
In addition, with the expansion of online pharmacies, there is also a kind of false “ genuine drugs” appearing in the market, that is, some manufacturers without drug patents or licenses, or qualifications for drug production and sales (such as smuggled imported drugs), produce or sell “ genuine” drugs, and affix forged regular brand packaging to sell in the market for profit.
In the long run, these drugs which evade the drug regulatory and approval procedures are harmful to the interests of consumers and bring significant risks to the entire drug market. Therefore, classifying multiple varieties and manufacturers of drugs to identify the true source of drugs after collecting samples, is of great significance in drug supervision.
Near-infrared spectroscopy (NIR) has the advantages of low instrument cost, direct measurement, non-destructive testing and on-site detection, and is particularly suitable for rapid qualitative and quantitative analysis of drugs[1]. However, because the detection limit of NIR is usually 0.1%, it is not suitable for trace analysis. Since the NIR analysis results are extremely dependent on the quality of the analysis model[2], and NIR traditional modeling often not capable to discriminating the minimal difference of material’ s composition, it is difficult to model NIR in the case of a large number of drug categories, especially when the differences between categories are very small.
NIR analysis combined with chemo-metrics has a long history in identifying and classifying drugs, but only linear classifiers such as PLS-DA, SVM[3, 4, 5, 6, 7, 8] and BP-ANN classifiers[9, 10] are usually used, and the classification objects are usually limited to the identification of true and false drugs or the classification of drugs with large differences in components. In recent years, deep learning methods have been introduced in modeling of NIR analysis for drug classification and identification. Stack sparse Auto-encoding (SSAE)[11], deep belief network (DBN)[12], deep convolution network (CNN)[13] and other methods have been reported for drug identification and classification modeling scenario. The application scenarios of most of deep learning method classifiers, except for CNN, are similar to scenarios of the traditional linear classifier, and the improvement of its reporting performance is not very prominent compared with the actual application effects of traditional linear classifier and BP-ANN. The performance of CNN method is improved obviously in reports, and it is suitable for more than 18 classifications with more than 1 000 spectra samples. However, this method needs to undergo a more complex exploration stage in the modeling process. Besides relying on experience for hyper parameter adjustment, its network structure also needs to be tried to different degrees according to the target scenario. For this reason, although only two categories of eighteen classifications of drugs are tested in their paper[13], there are seven different types of CNN networks had to be tried, and finally, the best one is selected for modeling.
Variational Auto-encoding (VAE)[14] is a popular deep learning Auto-encoding algorithm in recent years. It learns a family of incomplete univariate normal distribution features of input data by variational method, which represents the effect of blind source factors on data; therefore, it has a strong ability for feature extraction. VAE has been widely used in computer vision, speech recognition and other fields[14, 15, 16], but it has not been used in NIR analysis.
Based on VAE and taking full advantage of it as both feature extractor and data generator, this paper constructs a NIR classification model for multi-product and multi-manufacturer drugs through a uniquely designed artificial neural network structure and loss function.
The experimental materials were 4 kinds of drugs (metformin hydrochloride tablets, chlorpromazine hydrochloride tablets, chlorphenamine maleate tablets, cefuroxime axetil tablets) produced by 29 manufacturers collected by China Institute for Food and Drug Control. NIR data were measured by Bruker Matrix F spectrometer. The wavelength range of the data was 4 000~11 995 cm-1, and the resolution was 4 cm-1.
Experimental samples information is shown in Table 1.
| Table 1 Experimental data of NIR |
As we can be seen from Table 1, the total number of samples is large, reaching 1 721, but the number of samples between classes is not balanced. Some classes have a large number of samples, reaching 135, and some classes have smaller sizes, only 21. This is quite consistent with the real scenario of drug supervision. In the real case of identifying generic drugs or counterfeit drugs, there are often more negative samples representing real drugs, while fewer samples of generic drugs or counterfeit drugs as positive samples. Inner the same drug, in order to provide more details about the true source in the modeling stage, the number of categories and samples were also taken as large as possible.
According to 4 drug names, the total spectra of 29 kinds of products produced by each manufacturer are shown in Fig.1.
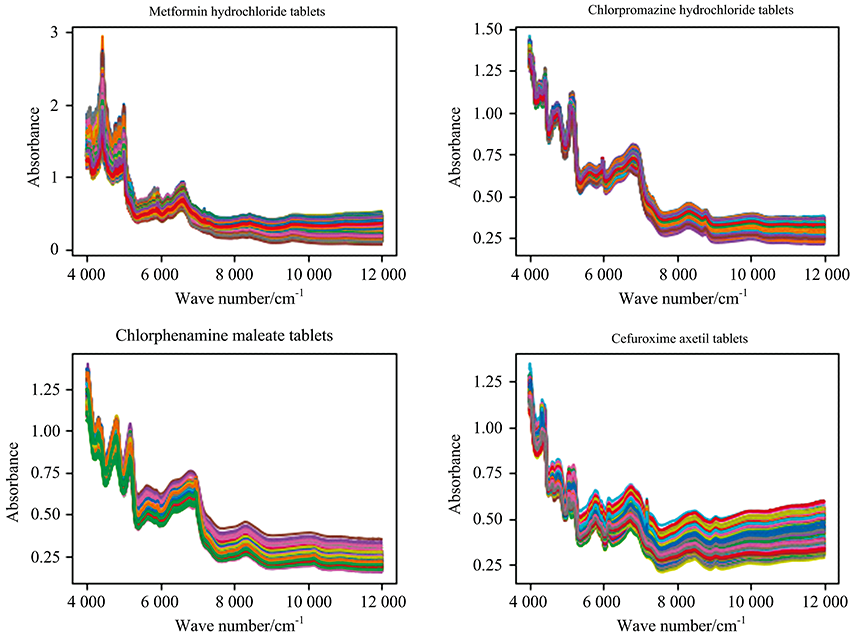 | Fig.1 Spectra of four kinds of drugs with a large number of samples, peak and valley positions overlap mostly |
As we can see from Fig.1, the spectra of the same drug produced by different manufacturers according to the Pharmacopoeia of the People’ s Republic of China (2020 version Ⅱ ) are very similar, and the important bands (peak and valley positions) overlap mostly.
Taken metformin hydrochloride tablets manufactured by two manufacturers (No.6 and 7) and chlorphenamine maleate tablets manufactured by two manufacturers (No.18 and 19) from Fig.1. As shown in Fig.2, the difference between manufacturers of the spectra could hardly be seen by manual inspection.
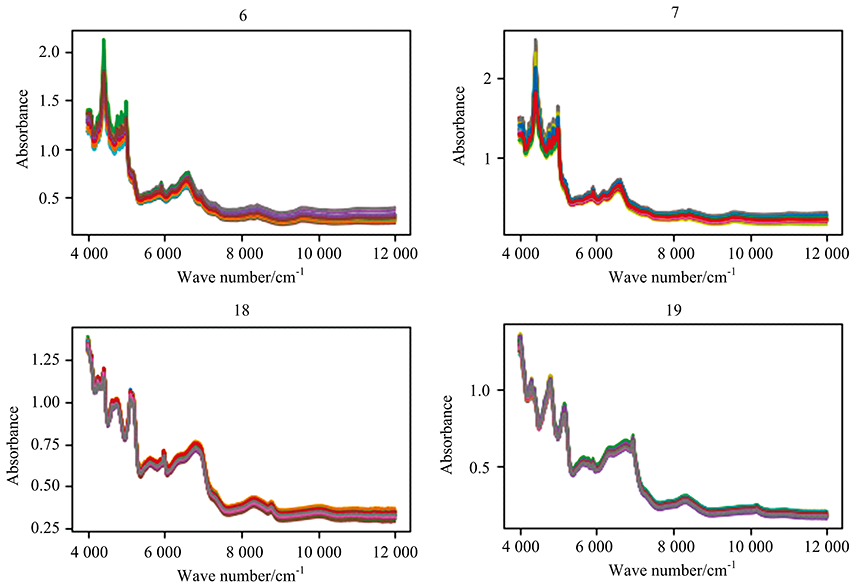 | Fig.2 Similar Spectra of the same drug produced by different manufactures. Metformin hydrochloride tablets came from No.6 and 7. Chlorphenamine maleate tablets came from No.18 and 19 |
Generally, the time from R& D to finalize the registration of the original drug took about 15 years, and it needs to undergo four phase clinical trials with a cost of hundreds of millions of dollars. Such drugs are not allowed to be imitated until the patent expires, and enjoy the protection of policies such as separate pricing. While generic drugs only replicate the components of the original drug, even if a huge investment is invested in the generic process, the price is only about 1/3 even 1/6 of the original drug. Therefore, it is understandable that generic drugs and the original drug can be as consistent as possible without being distinguished.
This poses a great challenge to classification algorithms and this paper will use the VAE algorithm to establish a multi-class classification model to achieve accurate classification of the above data.
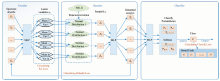
The specific design block diagram of the model is shown in Fig.3. which includes three parts: encoder, decoder and classifier. Structurally, the design of the encoder and decoder is roughly the same as that of the general VAE, and the classifier is designed with MLP+softmax which also uses a common structure.
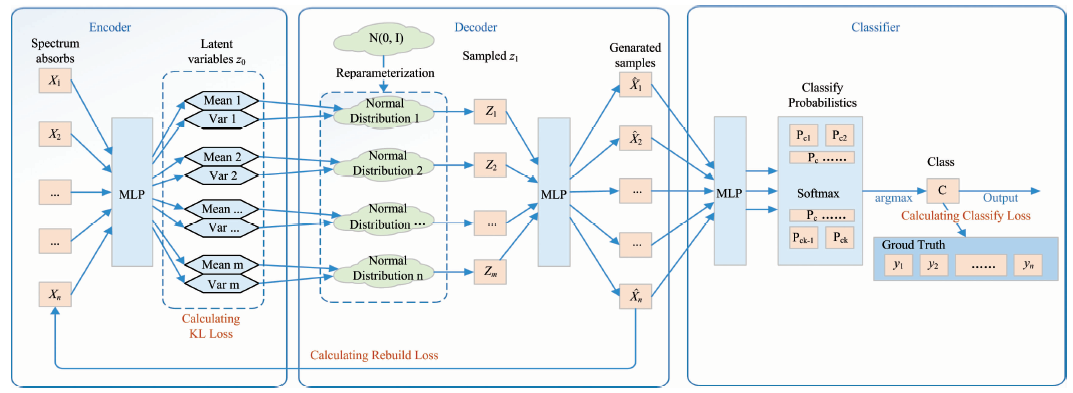 | Fig.3 Overall structure block diagram |
In Fig.3, the encoder is composed of MLP, and the input vector x is encoded into a family of implicit variable vectors z0 which grouped in pairs. Unlike traditional Auto-encoding, z0 here is not a dimension-reducing feature coding of x, although it is feed-forward from MLP. In a practical sense, z0 refers to the mean and variance pairs, which is required to randomly generate new vectors in the next step (re-parameter step).
In the re-parameter step, N (0, 1) is used to sample the normal distribution random value for each dimension, and then, using the means and variances in the previous step, the sample value can be adjusted to a set of normal distribution sampling values z1 (Z1, Z2, …, Zm).
Thereafter, z1 (Z1, Z2, …, Zm) is reconstructed into a spectral absorbance vector by MLP. VAE, on the one hand, wants the least loss of reconstruction, on the other hand, hopes the least difference between the two probabilities(x transforms to z1 and z1 reconstructs
Since the data involved in the calculation in this paper are spectral absorbance, which usually uses MSE to calculate reconstruction loss, we changed the original VAE reconstruction loss function form cross-entropy loss to MSE loss in this paper
A parameter k is also introduced as the dimension coefficient to be determined in this case. This is because MSE loss and KL loss are two different scales, one measures the 2-norm loss of absolute value and the other measures distribution difference. There is a great difference between them in numerical value (in fact, in the follow-up experiment of this paper, R is about 330 times of KL, setting k to 0.003 is appropriate), if not introduced k to adjust the sum of the loss, the whole network will be considered more in reconstruction loss and the distribution difference will be ignored, the whole network will be degraded into a sparse Auto-encoding network.
Since the Auto-encoder and the classification MLP are trained simultaneously in this paper and share the same Loss function, classification loss must be added to the total loss, which is a cross-entropy loss
Among them, another ratio parameter lambda is introduced in this paper, which redistributes the total loss between classifier and VAE, remains to be determined in the experiment.
The experimental data were divided into a training set and test set according to 9:1, 8:2, 7:3, 6:4, 5:5, 4:6, 3:7, 2:8. Each experiment was conducted 10 times. Because we should choose the best model finally to apply in practice, we recorded only the best results. The classification results are shown in Table 2.
| Table 2 Experimental results under different training and test set partitions |
From Table 2, it can be seen that our model has a classification accuracy of more than 99% when the proportion of training set is more than 50%, and the accuracy of each division is not very different, as if it has little relationship with the division of training set and test set. However, when the training set is only 40%, there is a big drop in accuracy, from 99% to around 90%. Since most of the categories in the dataset have the number of samples between 30 and 50, when the training set accounts for less than 40%, most of the categories begin to appear the shortage of insufficient data obviously. When the training set is only 30%, only 6 samples from the minimum category are trained, whereas to 20%, only 4 samples from the minimum category participate in the training course, and fewer than 10 samples from majority categories (15 of 29 categories) can be used for training.
The experimental results in this paper are compared with three kinds of algorithms: one against the traditional linear classification algorithms, mainly PLS-DA, linear SVM; the other against the traditional non-linear classification algorithms, mainly RBF SVM, k-NN, BP-ANN; the third against the deep learning algorithms in recent years, mainly DBN, SAE and CNN.
The comparison accuracy result is shown in table 3.
| Table 3 Accuracy of various multi-class classification algorithms |
In Table 3, from the most precise value we can see that VAE classification accuracy performed the best. CNN, SAE, DBN and other deep learning algorithms followed, PLS-DA and linear SVM algorithms still have strong vitality, and the traditional non-linear classification algorithm also has some effect.
Except for PLS-DA, when the partitioning of the training set and test set is extremely bad, each algorithm will encounter an avalanche classification accuracy decline inflection point because of scarce of data. Among them, the non-linear algorithm is more sensitive in this situation than the linear algorithm.
VAE algorithm has average sensitivity in terms of data missing, but when the condition is serious, its precision declines more obviously. This is because VAE does its classification just according to its generated data rather than the original data. It acts just like a radical expert who judges only according to his own imagination. When his “ experience” direction is correct, he has better judgment than others, even the situation is bad. Once the direction is wrong, he will be more likely to make mistakes than ordinary ones.
The training time and inferencing time of the algorithm are shown in Table 4.
| Table 4 Training and inferencing time of each algorithm (in second, training time/inferencing time) |
As can be seen from the table, with the decrease in the proportion of training set, the training time shows a downward trend, while the inferencing time shows an upward trend. The k-NN algorithm has the least training time, but its accuracy is the worst. PLS-DA and CNN followed by. While VAE, BP-ANN and other deep learning algorithms have large training time overhead. In terms of inferencing, VAE is faster than traditional nonlinear classification algorithms (SVM and k-NN), but slower than other kinds of deep learning algorithms and BP-ANN.
The experimental results show that in the scenarios where the number of classes is large, the number of spectra to be analyzed is large, and the difference between sample classes is small, the classification effect of our model is significantly better than that of linear classifiers such as PLS-DA, SVM and deep learning classifiers such as SSAE and DBN. Compared with CNN classifier, although the performance is flat or slightly improved, the modeling design has less complexity, fewer hyper-parameters and easier to be utilized.
| [1] |
|
| [2] |
|
| [3] |
|
| [4] |
|
| [5] |
|
| [6] |
|
| [7] |
|
| [8] |
|
| [9] |
|
| [10] |
|
| [11] |
|
| [12] |
|
| [13] |
|
| [14] |
|
| [15] |
|
| [16] |
|