
18CrNiMo7-6中低合金钢连铸圆坯的原位统计分布分析
[王辉1, 2  , 金呈
, 金呈3 , 赵雷1, 2 , 于雷3 , 蔺菲3 , 孙晓飞3 , 贾云海1, 2, * ]
, 金呈]
|
|


作者简介: 王 辉, 1980年生, 钢铁研究总院高级工程师 e-mail: wanghui@ncschina.com
连铸过程中会不可避免地出现中心偏析, 中心偏析影响钢材均匀性, 严重的中心偏析会对钢材的组织、 质量和性能产生很大的影响。 准确、 快速、 方便地对钢中元素含量分布进行分析, 将有助于指导冶金工作者进行质量控制和工艺改进。 原位统计分布分析是在较大尺度范围内(cm2)各化学组成及其形态的定量统计分布规律的分析技术, 在钢铁、 高温合金等的元素偏析、 疏松、 夹杂物分析上已有成功的应用。 采用原位统计分布分析方法对18CrNiMo7-6中低合金钢连铸圆坯从中心到边缘的各元素分布进行了分析, 得到不同位置各试样的统计符合度、 统计偏析度, 同时采用火花光谱法分析各试样得到相对标准偏差, 研究元素分布与统计符合度、 统计偏析度、 相对标准偏差的相关规律。 结果表明, 各试样P, Nb和S存在明显的偏析, 整体的统计符合度较低, 统计偏析度、 相对标准偏差较大; 各试样Cr, Ni, Mn, Mo和Si分布较均匀, 整体的统计符合度较高, 统计偏析度、 相对标准偏差较小。 圆坯中心部位的6#样品在10块样品中各元素偏析最明显, 统计符合度最低, 统计偏析度、 相对标准偏差最大; 靠近中心部位的3#, 7#, 4#样品各元素偏析较明显, 各元素统计符合度较低, 统计偏析度、 相对标准偏差较大; 圆坯边缘部位的9#和10#样品偏析程度最轻, 各元素统计符合度最高, 统计偏析度、 相对标准偏差最小。 各元素整体上按照从中心到边缘统计符合度逐渐增大, 统计偏析度、 相对标准偏差逐渐减小的规律分布。 原位统计分布分析的统计符合度、 统计偏析度结果与火花光谱分析的相对标准偏差结果在各试样的元素偏析上呈现出相同的规律。 由原位统计分布分析得到各试样的元素含量等高图趋势与统计符合度、 统计偏析度、 相对标准偏差结果也呈现出相同的规律。 因此, 原位统计分布分析技术可对材料元素分布提供准确、 快速的表征, 为材料及工艺研究提供反映材料内在质量的判据方法。
Central segregation will inevitably occur in the continuous casting process, which will affect the homogeneity of steel. Serious central segregation will have a great impact on the structure, quality and performance of the steel. Therefore, accurate, rapid and convenient analysis of the element content distribution in steel will help guide metallurgists to quality control and process improvement. Original position statistic distribution analysis (OPA) is a quantitative statistic distribution technique of chemical composition and morphology in a large scale (cm2). It has been successfully used in the analysis of element segregation, porosity and inclusions in steel and super-alloy. In this paper, the element distribution of continuous casting round billet of 18CrNiMo7-6 low and middle alloy steel from the center to the edge was analyzed by original position statistic distribution analysis (OPA). The statistic conformity and statistic segregation of each sample at different positions were obtained. Meanwhile, each sample was analyzed 11 times by spark optical emission spectroscopy (OES)to obtain the relative standard deviation. The correlation of element distribution with statistic conformity, statistic segregation and the relative standard deviation was studied. The research showed that there was obvious segregation of P, Nb and S in each sample, and the statistic conformity was low. Their statistic segregation and relative standard deviation were high. The distribution of Cr, Ni, Mn, Mo and Si was relatively uniform, and the overall statistic conformity was high. Their statistic segregation and relative standard deviation were low. The sample of 6# in the center of the round billet had the most obvious segregation, the lowest statistic conformity and the hightest statistic segregation and the relative standard deviation. The samples of 3#, 7# and 4# near the center had obvious segregation, low statistic conformity, high statistic segregation and relative standard deviation. The samples of 9# and 10# at the edge of the round billet had minimal segregation, the highest statistic conformity, and the lowest statistic segregation and relative standard deviation. On the whole, each element distribution from the center to the edge was that the statistic conformity gradually increased, and the statistic segregation and the relative standard deviation gradually decreased. The results of statistic conformity, statistic segregation of OPA and that of the relative standard deviation of spark OES showed the same regularity in the element segregation of each sample. The trend of elemental content contours of each sample obtained from OPA also showed the same regularity with statistic conformity, statistic segregation and relative standard deviation. Therefore, the OPA technique can provide an accurate and rapid characterization of element distribution in materials, and provide a criterion method for material and process research to reflect the internal quality of materials.
铸坯中心部位的碳、 磷、 硫等元素含量高于铸坯其他位置的现象称为中心偏析, 中心偏析是由于钢液在凝固过程中溶质元素再分配的结果, 偏析与枝晶流动和凝固组织有关[1, 2]。 连铸过程中会不可避免地出现中心偏析, 中心偏析影响钢材均匀性, 严重的中心偏析会对钢材的组织、 质量和性能产生很大的影响, 且连铸坯中心偏析一旦形成则无法在后续工序(如轧制、 热处理等)中完全消除[3, 4]。 准确、 快速、 方便地对钢中元素含量分布进行分析, 将有助于指导冶金工作者进行质量控制和工艺改进。
扫描电镜结合能谱仪、 电子探针可以对试样表面微区进行元素分布分析, 三维原子探针可以从原子尺度分析元素分布和成分变化[5, 6], 但这些方法属于微区分析, 观察范围较小, 无法获取宏观试样整体元素分布信息。 传统的低倍、 硫印属于人为评级, 无法对元素含量和分布进行准确定量。 钻孔取样后做化学分析、 火花光谱分析可以对元素含量准确定量, 但位置不连续, 无法得到元素在整个面上每个位置的分布信息。 X射线荧光光谱法可对材料表面的元素分布进行无损分析[7], 但对钢铁中易产生偏析的碳、 磷、 硫等元素定量性较差。 原位统计分布分析是在较大尺度范围内(cm2)各化学组成及其形态的定量统计分布规律的分析技术[8, 9], 通过对无预燃、 连续扫描激发的火花放电所产生的光谱信号进行高速的数据采集和解析, 测定样品表面不同位置的原始状态下的化学成分、 含量以及表面的结构信息, 实现被测样品的成分分布、 缺陷判别和夹杂状态分析, 为材料及工艺研究提供了反映材料内在质量的新判据方法, 在钢铁、 高温合金等的元素偏析、 疏松、 夹杂物分析上已有成功的应用[10, 11]。 本文采用原位统计分布分析方法对18CrNiMo7-6中低合金钢连铸圆坯从中心到边缘的各元素分布进行了分析, 得到不同位置各试样的统计符合度、 统计偏析度, 同时采用火花光谱法分析各试样得到相对标准偏差, 研究元素分布与统计符合度、 统计偏析度、 相对标准偏差的相关规律。
金属原位分析仪(OPA-200, 钢研纳克检测技术股份有限公司)采用金属放电电极对相对运动的样品实施连续的火花激发放电, 将所激发的火花光谱色散成设定波长的线状光谱, 高速、 实时记录单次火花放电的位置和光谱信号, 将光谱信号转化为电信号, 输入信号存储器, 用计算机对上述单次火花放电的线状光谱进行统计分析, 得到被测样品的化学成分、 偏析度、 疏松度和夹杂物分布[9, 10]。 仪器参数: 激发频率500 Hz, 火花间隙3.0 mm, 45° 顶角纯钨电极, 样品扫描方式为线性扫描, 扫描速度为1 mm· s-1, 氩气流量9 L· min-1。 主要测试元素及波长(nm), C: 396.1, Si: 288.1, Mn: 293.3, P: 178.3, S: 180.7, Cr: 267.7, Ni: 231.6, Mo: 203.8, Nb: 319.5。
火花光谱仪(ARL 4460, ThermoFisher)。
分析样品为某钢铁厂生产的18CrNiMo7-6连铸圆坯, 半径为285 mm, 取圆坯横截面的1/4、 内弧0° 到侧弧90° 的区域进行分析, 试样按图1裁样方法截成10块, 每块厚度10 mm, 试样1— 8长宽均为78 mm。
 | 图1 样品位置示意图Fig.1 Schematic diagram of the sample position |
用砂轮磨样机磨出新鲜表面, 以每块样品的左下角为激发原点, 样品1— 8激发50 mm(X)× 50 mm(Y)区域, 9— 10激发22 mm(X)× 50 mm(Y)区域。 对每块样品进行元素分布分析, 得到各元素二维分布图, 计算统计符合度和统计偏析度。 按照样品的相对位置把10块样品的元素二维分布图拼接在一起, 获得样品整体元素分布。 采用ARL 4460火花光谱仪在每一块样品上激发11点, 每块样品上四个边每边激发2~3点, 统计相对标准偏差(RSD)。
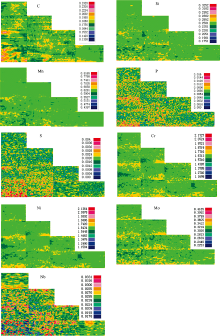
表1是原位统计分布分析得到的各试样各元素平均含量。 图2是10块样品按图1的位置拼接在一起的各元素整体含量分布图, 图中绿色代表平均含量, 红色代表正偏析, 蓝色代表负偏析, 红色和蓝色颜色越深代表偏析程度越严重。 P, Nb和S存在明显的偏析, C也存在一定的偏析, 其他元素偏析程度较轻。 靠近圆坯圆心部位的6#样品偏析最明显, 3#, 7#和4#样品次之, 边缘的9#和10#样品偏析程度最轻, 各元素整体上按照从中心到边缘偏析程度逐渐减轻的规律分布。
| 表1 各试样原位分析平均含量(%) Table 1 Average content of each sample by OPA (%) |
 | 图2 各元素整体分布图Fig.2 Overall distribution of each element |
根据统计符合度、 统计偏析度的定义[8, 9], 统计符合度是在分析区域内, 某元素的所有位置含量与材料规定的合格含量范围(或允许差范围)一致性的百分比, 统计符合度越接近100%表示均匀度越高。 统计偏析度是在扫描分析的范围内, 以数理统计方式对某元素的含量分布进行解析, 求得该元素95%置信度下, 以中位值为中心的含量置信区间为[c1, c2], 则
式(1)中, c0为含量中位值。 统计偏析度S数值越大, 偏析越严重; 无偏析时, 统计偏析度为0。
从OPA-200软件分别计算10个试样的统计符合度、 统计偏析度, 结果见表2和表3; 10个试样的11次火花光谱分析的相对标准偏差(RSD)结果见表4。 对于P, Nb和S, 多数试样的统计符合度低于90%; 各试样P和S统计偏析度大于0.35, Nb统计偏析度大于0.1; 各试样P和S相对标准偏差大于4%, Nb相对标准偏差大于2.5%; 各试样P, Nb和S元素整体的统计符合度较低, 统计偏析度、 相对标准偏差较大。 对于Cr, Ni, Mn, Mo和Si, 大多数试样的统计符合度大于90%; 各试样统计偏析度小于0.08, 大多数试样相对标准偏差小于1%; Cr, Ni, Mn, Mo和Si整体的统计符合度较高, 统计偏析度、 相对标准偏差较小。 圆坯中心部位的6#样品在10块样品中各元素统计符合度最低, 统计偏析度、 相对标准偏差最大; 靠近中心部位的3#, 7#和4#样品在10块样品中各元素统计符合度较低, 统计偏析度、 相对标准偏差较大; 圆坯边缘部位的9#和10#样品各元素统计符合度最高, 统计偏析度、 相对标准偏差最小。
| 表2 各试样统计符合度(%)结果 Table 2 Statistic conformity (%) results of each sample |
| 表3 各试样统计偏析度结果 Table 3 Statistic segregation results of each sample |
| 表4 各试样相对标准偏差(%)结果 Table 4 Results of relative standard deviation (%) of each sample |
各元素整体上按照从中心到边缘统计符合度逐渐增大, 统计偏析度、 相对标准偏差逐渐减小的规律分布。 原位统计分布分析的统计符合度、 统计偏析度结果与火花光谱分析的相对标准偏差结果在各试样的元素偏析程度上呈现出一致的规律。 由原位统计分布分析得到各试样的元素含量等高图, 即元素分布均匀程度与统计符合度、 统计偏析度、 相对标准偏差结果也呈现出一致的规律。
通过对18CrNiMo7-6中低合金钢连铸圆坯从中心到边缘各元素的分布分析, 表明原位统计分布分析技术可对金属材料元素分布、 偏析程度提供准确、 快速的表征, 因此原位统计分布分析技术可更广泛地应用于新材料开发、 冶金工艺研究、 质量控制等领域, 提供反映材料内在质量的判据方法。
采用原位统计分布分析方法对18CrNiMo7-6中低合金钢连铸圆坯从中心到边缘的各元素分布进行了分析, 得到不同位置各试样的统计符合度、 统计偏析度, 同时采用火花光谱法分析各试样得到相对标准偏差。 各试样P, Nb和S存在明显的偏析, 整体的统计符合度较低, 统计偏析度、 相对标准偏差较大; 各试样Cr, Ni, Mn, Mo和Si分布较均匀, 整体的统计符合度较高, 统计偏析度、 相对标准偏差较小。 圆坯中心部位的6#样品在10块样品中各元素偏析最明显, 统计符合度最低, 统计偏析度、 相对标准偏差最大; 靠近中心部位的3#, 7#和4#样品各元素偏析较明显, 各元素统计符合度较低, 统计偏析度、 相对标准偏差较大; 圆坯边缘部位的9#和10#样品偏析程度最轻, 各元素统计符合度最高, 统计偏析度、 相对标准偏差最小。 各元素整体上按照从中心到边缘统计符合度逐渐增大, 统计偏析度、 相对标准偏差逐渐减小的规律分布。 原位统计分布分析的统计符合度、 统计偏析度结果与火花光谱分析的相对标准偏差结果在各试样的元素偏析上呈现出相同的规律。 由原位统计分布分析得到各试样的元素含量等高图趋势与统计符合度、 统计偏析度、 相对标准偏差结果也呈现出相同的规律。 因此, 原位统计分布分析技术可对材料元素分布提供准确、 快速的表征, 为材料、 冶金工艺研究提供反映材料内在质量的判据方法。
| [1] |
|
| [2] |
|
| [3] |
|
| [4] |
|
| [5] |
|
| [6] |
|
| [7] |
|
| [8] |
|
| [9] |
|
| [10] |
|
| [11] |
|