


二倍体马铃薯绿原酸的提取与光谱测定分析
[杨慧芹1, 2  , 张博
, 张博1, 2 , 马玲1, 2 , 尚轶1, 2 , 高冬丽1, 2, * ]
, 张博]
|
|


作者简介: 杨慧芹, 女, 1988年生, 云南师范大学马铃薯科学研究院博士研究生 e-mail: yanghuiqin1012@163.com
马铃薯营养成分全面、 营养结构合理、 易于消化吸收, 是我国第四大粮食作物。 马铃薯中富含绿原酸等酚类物质, 具有抗氧化、 抗病、 抗癌、 降脂等多种保健作用。 鉴于绿原酸与马铃薯风味、 营养及抗性品质密不可分, 系统测定分析马铃薯不同组织中的绿原酸含量及分布规律将为改良作物品质提供理论依据和借鉴。 马铃薯普通栽培种是同源四倍体, 应用杂交育种的方法改良品种比较困难, 而二倍体马铃薯比四倍体马铃薯遗传背景简单, 在育种和基因组研究方面更具优势。 采用二倍体马铃薯自然变异群体(C系列)和自交分离F2群体(151系列和RH系列)为实验材料, 利用紫外-可见光分光光度计(UV-VIS)对不同组织中绿原酸含量进行测定计算, 并采用SPSS16.0对绿原酸测定结果进行统计分析。 结果表明, 在所选取的131个样本中, C系列马铃薯叶片绿原酸含量明显高于151系列和RH系列, C系列马铃薯叶片绿原酸含量最高为12 022.25 mg·kg-1 FW, 151系列马铃薯叶片绿原酸含量最高为7 685.41 mg·kg-1 FW, RH系列马铃薯叶片绿原酸含量最高为5 486.46 mg·kg-1 FW, 但C系列均匀性和稳定性低于151系列和RH系列。 进一步对C系列(181个样本)薯皮和薯肉绿原酸含量进行测定分析, 薯皮中绿原酸含量明显高于薯肉, 薯皮中绿原酸含量最高为19 679.59 mg·kg-1 DW, 薯肉中绿原酸含量最高为2 927.52 mg·kg-1 DW, 整体上薯肉中绿原酸含量随薯皮绿原酸含量的增加而增加, 但不呈线性关系。 通过对二倍体马铃薯绿原酸含量的测定分析, 为光谱测定分析法在研究、 培育绿原酸含量高、 风味好的马铃薯新品种中的应用提供理论基础。 同时, 光谱测定分析结果对指导育种、 天然活性物质的测定分析及农业基因组研究具有重要的意义, 也为紫外-可见光谱在国家优薯计划、 国际农业基因组计划和智慧农业领域的应用提供研究和技术应用基础。
Potato is the fourth largest food crop in China, which has a comprehensive and reasonable nutrient composition and is easy to digest and absorb. Potato tuber is rich in phenolic substances such as chlorogenic acid, which has many health functions such as anti-oxidation, disease resistance, anti-cancer and lipid-lowering. Since chlorogenic acid is closely related to potato flavor, nutrition and resistance quality, systematic determination and analysis of chlorogenic acid content and distribution in different tissues of potato will provide a theoretical basis and reference for improving crop quality. The common cultivars of potato are autotetraploid, so it is difficult to improve potato varieties by cross breeding. While the diploid potato has more advantages in breeding and genome research due to its simple genetic background compared with the tetraploid potato. In this paper, natural variation population (C series) and self-cross separation of F2 population (151 series and RH series) of diploid potatoes were used. The content of chlorogenic acid in different tissues was determined by UV-Vis and the results were statistically analyzed by SPSS16.0. The results showed that, among the 131 samples selected, the chlorogenic acid content in potato leaves of series C is significantly higher than 151 series and RH series. The highest chlorogenic acid content in potato leaves of series C is 12 022.25 mg·kg-1 FW, the highest chlorogenic acid content in potato leaves of series 151 is 7 685.41 mg·kg-1 FW and the highest chlorogenic acid content in potato leaves of series RH is 5 486.46 mg·kg-1 FW. However, the uniformity and stability of C series are lower than 151 series and RH series. The content of chlorogenic acid in potato skin and flesh of C series (181 samples) was further determined and analyzed. The content of chlorogenic acid in potato skin is significantly higher than flesh. The highest content of chlorogenic acid in potato skin is 19 679.59 mg·kg-1 DW, while the highest content of chlorogenic acid in potato flesh is 2 927.52 mg·kg-1 DW. On the whole, the content of chlorogenic acid in potato flesh increased with the skin, but there is no linear relation ship. The content of chlorogenic acid in diploid potato was determined and analyzed, which provided a theoretical basis for the application of spectroscopic analysis in the study and breeding new potato varieties with a high content of chlorogenic acid and good flavor. At the same time, the results of the spectrometric analysis are of great significance in guiding breeding, determination and analysis of natural active substances and agricultural genome research, and also provide research and technical application basis for UV-Vis spectroscopy application in national potato program “Upotato Plan”, international agricultural genome program and intelligent agriculture.
马铃薯(Solanum tuberosum)是一年生茄科植物, 其块茎营养价值高, 富含淀粉、 蛋白质、 糖类及多种维生素和无机盐, 是继水稻和小麦之后的世界第三大粮食作物。 我国是马铃薯最大的生产和消费国, 2015年农业部启动了马铃薯主粮化、 主食化战略后, 马铃薯成为我国第四大粮食作物。 马铃薯不仅营养成分全面、 营养结构合理、 易于消化吸收, 且所含多酚类物质具有多种保健作用。 马铃薯块茎中总酚含量以干重计在0.11%~0.13%之间, 芽中含量高达0.18%, 其中约90%是绿原酸(chlorogenic acid, CGA)[1]。 绿原酸为马铃薯次生代谢过程产生的一种重要的有机酸, 对自由基的清除和抗脂质过氧化作用显著, 具有抗菌、 抗病毒、 抗诱变及抗癌、 降脂降糖、 降血压、 保护心血管等多种药用功能[2, 3]。
绿原酸又称咖啡单宁酸, 化学名为3-O-咖啡酰奎尼酸(3-O-caffeoylquinic acid), 分子式为C6H18O9, 最早于1897年由Osbome和Campbell首次在向日葵种子中发现。 植物中绿原酸的生物合成途径有三条[4], 如图1所示。 其中, 通过HQT(奎尼酸羟基肉桂酰基转移酶)合成绿原酸的途径是其主要的合成途径[5, 6, 7]。
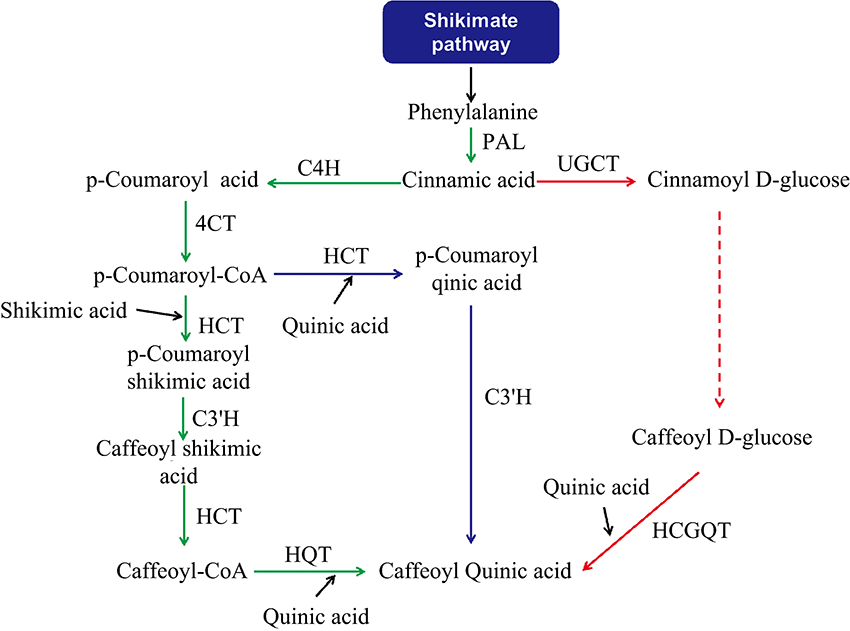 | 图1 植物中绿原酸的三条生物合成途径 途径1用绿色箭头标示, 途径2用蓝色箭头标示, 途径3用红色箭头标示; 重要的合成酶标记为红色Fig.1 Three biosynthetic pathways of chlorogenic acid in plants pathway 1 is marked by a green arrow; pathway 2 by a blue arrow; pathway 3 by a red arrow; Important synthases are labeled red |
马铃薯作为一种高营养价值的的保健食品, 已成为世界各国饮食和烹饪文化中不可或缺的一部分, 且高绿原酸含量的马铃薯品种有较大的市场需求, 但目前马铃薯的栽培品种中绿原酸含量普遍较低, 且不同栽培品种之间的含量差异性较大[8, 9], 因而开展如何提高马铃薯中的绿原酸含量的研究具有长远的现实意义。 本文利用丰富的二倍体马铃薯资源, 并对其叶片、 薯皮、 薯肉的绿原酸含量进行了测定分析, 为研究、 培育出绿原酸含量高、 风味好的马铃薯新品种提供研究基础。
实验材料采集于云南师范大学马铃薯实验基地, 均为二倍体材料。 其中, C系列为全世界范围内收集的自然变异群体, 151系列和RH系列为从国际马铃薯中心引进的高度杂合、 且自交亲和的C151和RH的自交分离F2群体。
马铃薯叶片选取植株顶端完全展开、 状态良好、 无病变的适量新鲜叶片(FW), 用液氮研磨成粉末; 马铃薯薯块选择大小均一、 无机械损伤、 无绿变、 新鲜的马铃薯, 用水清洗除去表面污物, 去皮切片(尽量缩短其在空气中的暴露时间, 避免发生氧化), 液氮速冻后用真空冷冻干燥机冻干(DW), 研磨至粉末状; 马铃薯薯皮收集后经液氮速冻后用真空冷冻干燥机冻干, 研磨至粉末状。 称取适量粉末放入离心管中, 加入75%乙醇(提取液), 4 ℃超声波震荡萃取、 离心, 经0.22 μ mol· L-1微孔有机滤膜过滤的上清液转移至棕色瓶中, -80 ℃保存。
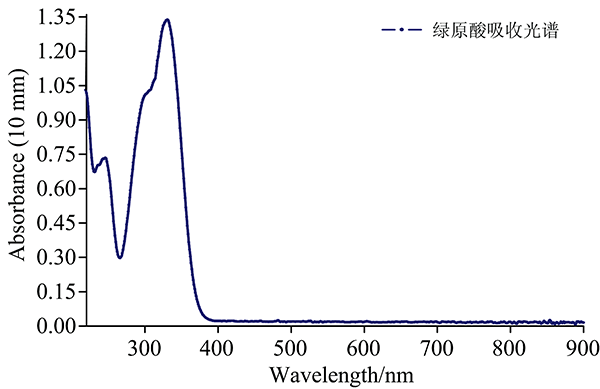
通过对C系列, 151系列和RH系列新鲜功能叶片中间部位的绿原酸提取液进行吸收光谱分析, 结果如图3所示。
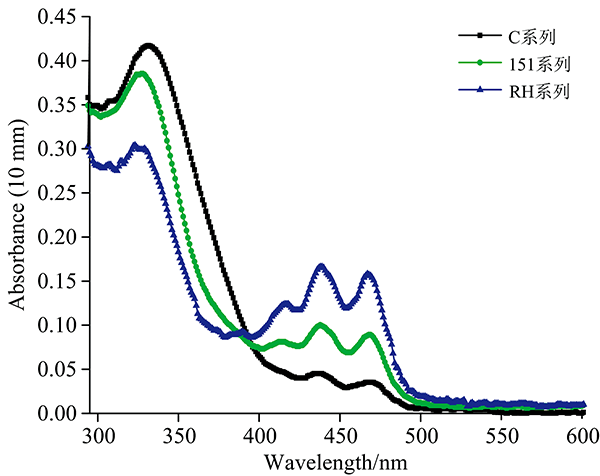 | 图3 马铃薯叶片绿原酸吸收光谱图(提取液稀释35倍)Fig.3 Chlorogenic acid absorption spectrum of potato leaves (Extration solution was diluted 35 times) |
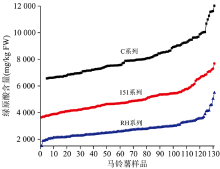
由图3可知, 在波长为327 nm时, C系列的吸收值最高, 其次为151系列, RH系列的吸收值最低。 对C系列, 151系列和RH系列各131个样本中叶片的绿原酸含量进行光谱测定, 结果如图4所示。
 | 图4 马铃薯叶片绿原酸的含量Fig.4 Content of chlorogenic acid in potato leaves |
结合图3和图4可知, 二倍体马铃薯叶片中, C系列绿原酸含量最高, 其次为151系列, RH系列绿原酸含量最低。
进一步采用SPSS16.0对C系列、 151系列和RH系列叶片的绿原酸测定值进行统计分析, 结果如表1所示。 在选取的样本中, 绿原酸含量的平均值、 全距、 方差数值、 标准差数值、 最大数值为C系列最大, 其次为151系列, RH系列最低。
| 表1 二倍体马铃薯叶片绿原酸含量SPSS统计分析结果 Table 1 SPSS statistical analysis results of chlorogenic acid content in diploid potato leaves |
由表1和图4可知, RH系列二倍体马铃薯叶片绿原酸含量最低, 样本中最高为5 486.46 mg· kg-1(FW), 其次为151系列, 样本中最高为7 685.41 mg· kg-1(FW), C系列二倍体马铃薯叶片绿原酸含量最高, 样本中最高达到12 022.25 mg· kg-1(FW), 平均为151系列的1.62倍, RH系列的2.92倍, 但其绿原酸含量的均匀性和稳定性相对较低。
选取C系列二倍体马铃薯, 对其薯肉和薯皮的绿原酸提取液进行吸收光谱分析, 结果如图5(a, b)所示。
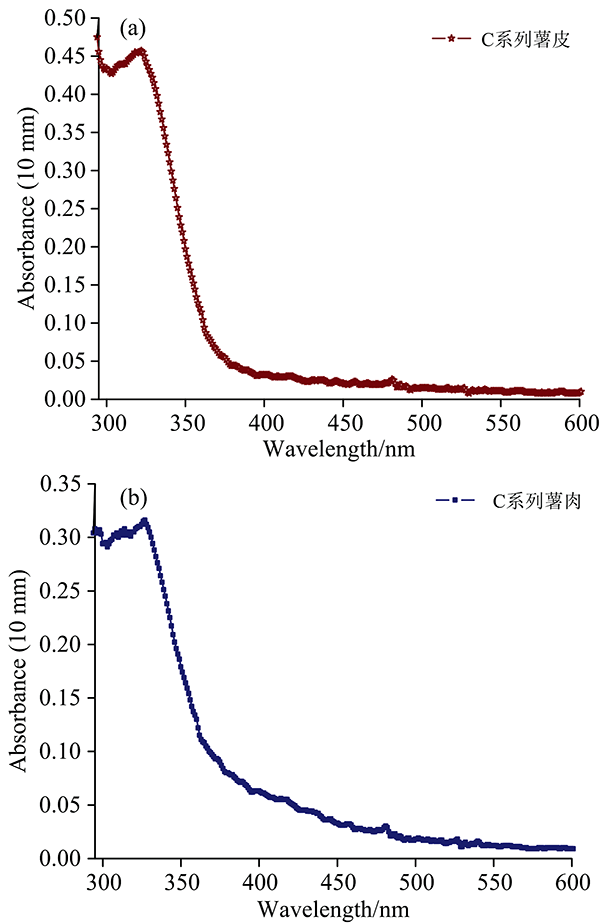 | 图5 马铃薯薯皮(a)和薯肉(b)绿原酸吸收光谱图 注: 薯皮中绿原酸提取液稀释50倍, 薯肉中绿原酸提取液稀释5倍Fig.5 Chlorogenic acid absorption spectrum of (a) potato skin and (b) flesh |
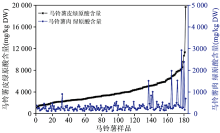
由图5(a, b)可知, 在波长为327 nm时, C系列薯皮的吸收值远远高于薯肉。 通过对C系列二倍体马铃薯181个样本中薯皮和薯肉的绿原酸含量进行光谱测定, 结果如图6所示。
 | 图6 马铃薯薯皮和薯肉绿原酸含量的测定Fig.6 Determination of chlorogenic acid in potato skin and flesh |
比较图5和图6, C系列二倍体马铃薯薯皮中绿原酸含量明显高于薯肉, 薯肉绿原酸含量整体随薯皮绿原酸含量的增加而增加, 但不呈线性关系。 薯皮绿原酸含量主要集中于1 000~6 000 mg· kg-1(DW)之间, 薯肉中绿原酸含量主要集中于100~400 mg· kg-1(DW)之间(如图7所示)。
 | 图7 马铃薯绿原酸含量离散图Fig.7 Discrete figure of chlorogenic acid content in potato |
采用SPSS16.0对C系列薯肉和薯皮绿原酸测定值进行统计分析, 结果如表2所示。 在选取的样本中, C系列马铃薯薯皮绿原酸含量的平均值、 全距、 方差数值、 标准差数值、 最大数值均大于薯肉。
| 表2 马铃薯薯皮和薯肉绿原酸含量SPSS统计分析结构 Table 2 SPSS statistical analysis structure of chlorogenic acid content in potato skin and potato meat |
结果表明, C系列马铃薯薯皮中绿原酸含量高于薯肉, 平均为6.7倍。 薯皮中绿原酸含量最高达到19 679.59 mg· kg-1(DW), 薯肉中最高为2 927.52 mg· kg-1(DW), 薯肉中绿原酸含量的稳定性和均匀性相对于薯皮较好。
通过对二倍体马铃薯叶片、 薯皮和薯肉绿原酸含量的测定分析, 所选取的样本中C系列马铃薯叶片中绿原酸明显高于151系列和RH系列, 平均为151系列的1.62倍, 为RH系列的2.92倍, 最高达到12 022.25 mg· kg-1(FW), 但C系列叶片中绿原酸含量的均匀性和稳定性低于151系列和RH系列。 C系列马铃薯薯皮中绿原酸含量明显高于薯肉, 所选取的样本中, 薯皮绿原酸含量平均为薯肉的6.71倍, 薯皮中最高含量达到19 679.59 mg· kg-1(DW), 薯肉中最高含量为2 927.52 mg· kg-1(DW), 薯皮绿原酸含量主要集中于1 000~6 000 mg· kg-1(DW)之间, 薯肉中绿原酸含量主要集中于100~400 mg· kg-1(DW)之间, 薯肉中绿原酸含量整体随着其在薯皮中增高而增高, 但不呈线性关系, 薯肉中绿原酸含量更加均匀、 稳定。
| [1] |
|
| [2] |
|
| [3] |
|
| [4] |
|
| [5] |
|
| [6] |
|
| [7] |
|
| [8] |
|
| [9] |
|
| [10] |
|
| [11] |
|