
空间偏移拉曼光谱技术及数据处理方法研究
[李扬裕1  , 马建光
, 马建光2, * , 李大成1 , 崔方晓1 , 王安静1 , 吴军1 ]
, 马建光, 李大成|
|


作者简介: 李扬裕, 1986年生, 中国科学院安徽光学精密机械研究所通用光学定标与表征技术重点实验室助理研究员e-mail: yyli@aiofm.ac.cn
传统拉曼光谱分析技术在对容器内未知样品进行检测时极易受到容器壁的荧光和拉曼散射干扰, 其商业应用往往仅限于透明塑料或玻璃包装的情况。 由于光子在介质内部的迁移方向具有随机性, 与表层相比内部深层处产生的拉曼散射光子在扩散过程中更易于横向迁移, 因此偏离激光入射点不同距离的拉曼光谱包含了不同深度层的拉曼光谱信息。 空间偏移拉曼光谱技术通过将拉曼光收集点偏离激光入射点, 能够抑制容器壁的荧光和拉曼散射干扰, 从而实现对有色、 不透明包装内样品的有效检测。 通过设计搭建了空间偏移拉曼光谱实验装置, 实现-1.0~10.0 mm偏移距离的可调节。 使用青色、 不透明的1 mm厚PMMA平板来模拟容器壁, 使用碳酸钙(CaCO3)粉末作为内部待测样品。 分别采用传统方式(零偏移)和空间偏移方式对容器内样品进行测量。 对采集的原始光谱首先进行平均和7阶多项式拟合去除基线(荧光), 然后以3个最大特征峰的平均值作为光谱强度的评价指标, 对空间偏移拉曼光谱信号随偏移距离的变化规律进行分析, 发现: 随着空间偏移距离的增大, 容器壁的拉曼散射强度快速下降, 而内部样品的拉曼散射强度先上升后缓慢下降; 对于均匀厚度、 各向同性的样品, 变化趋势关于零偏移两侧对称, 此外光束的斜入射会引起轻微的不对称; 在某个偏移距离处样品与容器壁的光谱强度比值达到最大值, 存在最优探测偏移距离, 对于此次样品其最优偏移距离为1.2 mm。 在容器和样品材质未知的情况下, 采用比例相减的方法仍可以得到各层干净的拉曼光谱, 通过对零偏移和最优偏移处的光谱进行计算, 分别得到容器壁和内部样品干净的拉曼光谱, 实现对内部样品的有效检测。 研究结果在一定程度上证明了空间偏移拉曼光谱技术在不透明、 有色容器内样品的检测方面的潜力, 为进一步研究空间偏移拉曼光谱技术及数据处理方法提供基础。
Traditional Raman spectroscopy is highly susceptible to fluorescence and Raman scattering of the container wall when detecting unknown samples in containers, which often limits its commercial applications to transparent plastic or glass packaging. Since the photon migration direction inside the medium is random, the Raman scattered photons generated at the inner deep layer are more likely to migrate laterally during the diffusion process. Therefore, the Raman spectrum at different distances from the laser incident point contains different Raman spectral information of depth layers. The spatially offset Raman spectroscopy (SORS) can suppress the fluorescence and Raman scattering interference of the container wall by deviating the Raman light collection point from the laser incident point, there by realizing effective detection of the sample in the colored and opaque package. By designing a SORS experimental device, the offset distance of -1.0~10.0 mm can be adjusted. A cyan, opaque 1 mm thick PMMA plate was used to simulate the container wall, and calcium carbonate (CaCO3) powder was used as the internal sample to be tested. The samples were measured by the conventional method (zero offset) and the spatially offset method. The acquired raw spectra were first averaged and fitted by a 7th order polynomial to remove the baseline. Then the average of the three largest spectral peaks was used as the spectral intensity, and the variation law of the SORS signal with the offset distance was analyzed. It was found that: as the spatial offset distance increases, the Raman scattering intensity of the container wall decreases rapidly, while the Raman scattering intensity of the internal sample first rises and then decreases slowly; for samples of uniform thickness and isotropic, the trend of change is symmetrical about the zero offset, and the oblique incidence of the laser beam causes a slight asymmetry; at a certain offset distance, the ratio of the spectral intensity of the sample to the container wall reaches a maximum value, and there is an optimal detection offset distance (for this sample, the optimal offset distance is 1.2 mm). In the case where the material of the container and the sample is unknown, the clean Raman spectrum of each layer can still be obtained by the method of proportional subtraction. By calculating the spectrum at the zero offset and the optimal offset, the clean Raman spectra of the container wall and the internal sample are obtained respectively, which can be used in later spectral analysis and identification processes. This work demonstrates the potential of SORS for the detection of samples in opaque, colored containers, and provides a basis for further research on SORS and data processing methods.
拉曼光谱技术是一种基于拉曼散射现象的光谱分析技术, 可以根据分子的振动、 转动信息识别未知化合物。 与常规化学分析技术相比, 拉曼光谱技术具有非接触、 无损、 快速准确等优点, 是当前分析领域研究的热点。 然而, 拉曼散射光强弱是其本身固有的缺点, 一般拉曼散射光强约为入射光强的10-10, 在对容器内未知样品进行检测时极易受到容器壁的荧光和拉曼散射干扰[1]。 因此, 其商业应用往往仅限于透明塑料或玻璃包装的情况。
2005年Pavel Matousek等在研究拉曼散射光子迁移理论的基础上提出了空间偏移拉曼光谱技术(spatially offset Raman spectroscopy, SORS), 通过将拉曼光收集点偏离激光入射点, 能够抑制容器壁的荧光和拉曼散射干扰, 取得更好的检测效果[2]。 该技术已被应用于药品认证、 疾病诊断、 危险品检测特别是液体爆炸物的安检等领域中, 得到了广泛的关注和认可[3, 4]。 通过对不同偏移距离的光谱进行多变量数据分析, 能够得到各层的干净的拉曼光谱。 但是, 多变量数据分析需要大量的不同偏移距离的光谱数据, 采集时间长、 处理时间长, 不利于现场快速检测[5]。
本文首先介绍空间偏移拉曼光谱技术的原理, 然后通过设计搭建空间偏移拉曼光谱实验装置, 分别采用传统方式和空间偏移方式对容器内样品进行拉曼光谱的测量和对比分析, 以期证明空间偏移拉曼光谱技术在不透明、 有色容器内样品检测方面的可行性, 并对空间偏移拉曼光谱的数据处理方法进行研究。
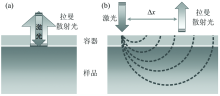
传统拉曼光谱采集方式如图1(a)所示, 激光入射点与拉曼光谱采集点重合, 都位于样品表面上。 传统方式非常容易受容器壁的荧光和拉曼散射光干扰, 很难用于不透明、 有色容器内样品的检测。
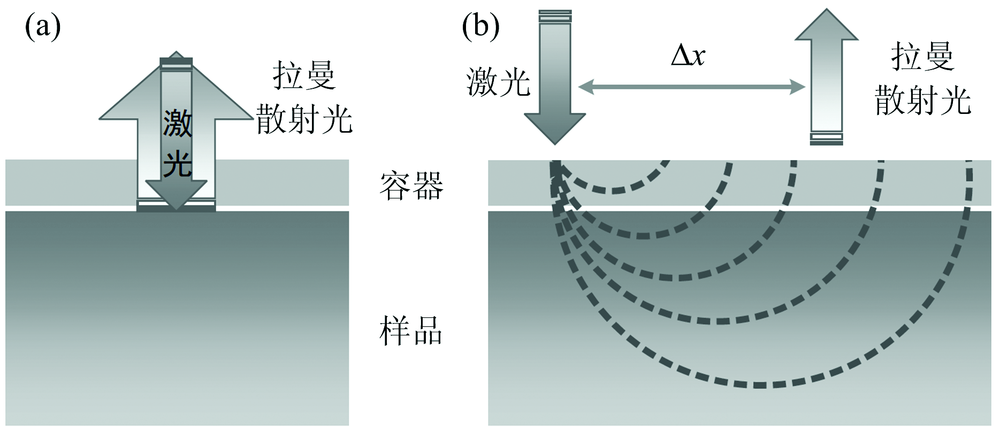 | 图1 空间偏移拉曼光谱的原理示意Fig.1 Schematic diagram of spatially offset Raman spectroscopy |
空间偏移拉曼光谱采集方式如图1(b)所示, 拉曼光谱采集点与激光入射点有横向偏移, 但都位于容器表面上。 其理论依据是: 光子在介质内部的迁移方向具有随机性, 与表层相比内部深层处产生的拉曼散射光子在扩散过程中更易于横向迁移, 因此偏离激光入射点不同距离的拉曼光谱包含了不同深度层的拉曼光谱信息[6]。 当空间偏移Δ x=0时(即传统方式), 此处激光光子密度最大, 采集到的拉曼光谱主要来自容器壁(表层)的荧光和拉曼散射贡献; 当空间偏移Δ x≠ 0时(即空间偏移方式), 采集到的拉曼光谱中来自样品(深层)的荧光和拉曼散射贡献更大, 也就是说来自容器壁的荧光和拉曼散射被抑制了。
需要指出, 虽然容器壁的荧光和拉曼散射贡献逐渐降低, 但是不可能完全消除, 因此不能直接在原始光谱中得到样品的干净的拉曼光谱, 需要采用合适的数据处理方法提取干净的拉曼光谱[7]。
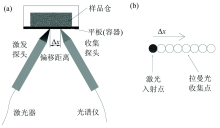
为了能够同时测量传统拉曼光谱和空间偏移拉曼光谱, 搭建的空间偏移拉曼光谱实验装置如图2(a)所示。 激光器通过光纤连接到激发探头上, 探头的工作距离为7.5 mm, 在容器壁表面会聚的激光光斑大小为200 μ m。 产生的拉曼光通过收集探头接入到光谱仪的入射狭缝处, 探头工作距离为10 mm, OD> 8。 所用激光器为谱镭光电的SPL-LASER-785, 波长785 nm, 连续输出功率0~500 mW可调, 线宽小于0.2 nm。 所用光谱仪为Ocean Optics公司的QE65PRO光谱仪, 狭缝宽度50 μ m, 工作光谱范围651~1 019 nm, 对于785 nm的入射激光其对应的拉曼频移范围-2 622.1~2 925.4 cm-1。 对于785 nm的入射激光来说, 上述光谱仪并非最优的, 但是该光谱仪是实验室内已有的, 而且测得的拉曼频移能满足使用需求(0~2 000 cm-1)。
 | 图2 空间偏移拉曼光谱实验装置Fig.2 Experimental device of spatially offset Raman spectroscopy |
激发探头和收集探头的焦点均在容器壁表面上, 两者偏移距离为Δ x, 如图2(b)所示。 激发探头和收集探头固定在六维光学调整架上, 通过调节左右实现不同的空间偏移距离。 实验装置中探头能调节的偏移距离是-1.0~10.0 mm, 偏移为零时是传统拉曼光谱仪的工作方式。
使用青色、 不透明的1 mm厚PMMA平板来模拟容器壁。 待测样品为碳酸钙(CaCO3)粉末, 置于样品仓内。 激光功率设为155 mW, 光谱仪的积分时间设为10 s, 每次测量采集10条光谱进行平均。
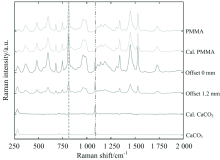
通过7阶多项式拟合去除原始光谱中的基线(荧光)[8, 9], 得到不同空间偏移的拉曼光谱如图3所示。 作为对比, 将PMMA和CaCO3的拉曼光谱也画在图中。 可以明显观察到随着偏移距离的增加(图中右侧数字), 容器壁(PMMA)和样品(CaCO3)的光谱贡献变化趋势不一致。
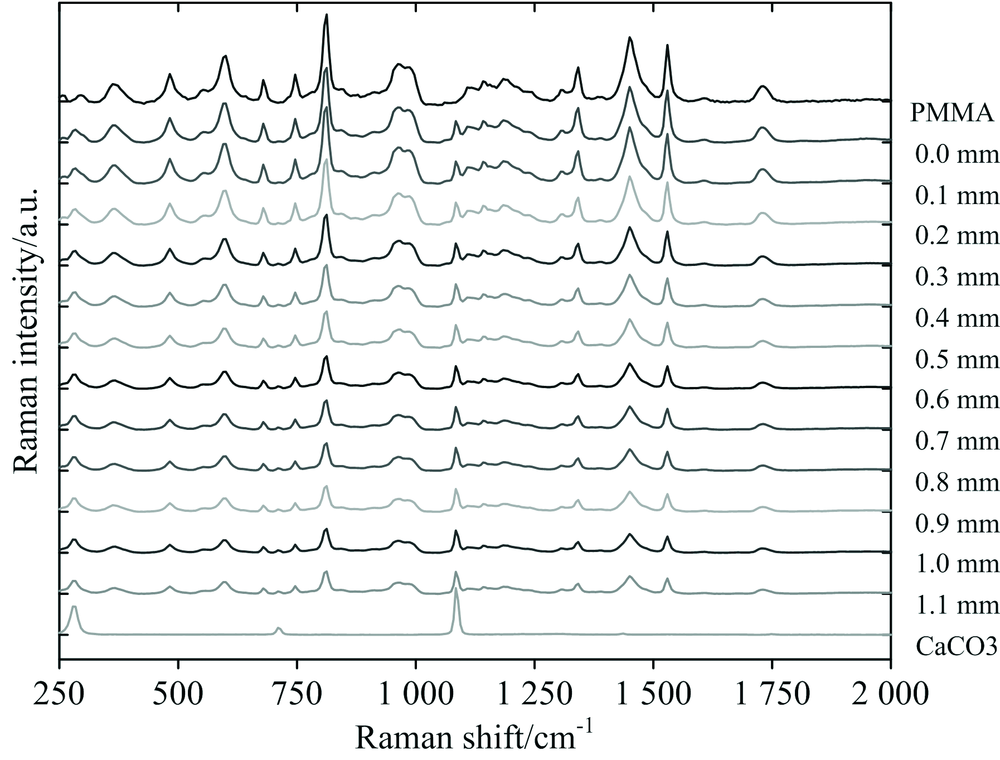 | 图3 不同空间偏移的拉曼光谱信号Fig.3 A set of spatially offset Raman spectra |
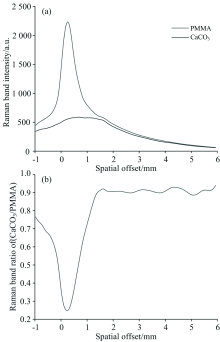
PMMA和CaCO3拉曼光谱强度随偏移距离的变化趋势如图4(a)所示。 光谱强度的计算方式为3个最高峰的平均值。 PMMA选取的3个峰为: 812.6, 1 450和1 529 cm-1, CaCO3选取的3个峰为: 1 084, 278.4和710 cm-1。 图中可以看出, 随着Δ x增大, PMMA信号强度快速下降, 而CaCO3信号强度先上升后缓慢下降。 这导致了如图4(b)所示的光谱强度比值(CaCO3/PMMA)随偏移距离的变化趋势, 在Δ x等于1.2 mm时达到最大值, 随后基本不变。 由于光谱仪噪声基本不变, 随着Δ x增大, 光谱信号不断降低, 信噪比也随之降低, 因此对于此次样品, 探测效果最优的偏移距离为1.2 mm。 实验中PMMA平板和CaCO3粉末是均匀厚度、 各向同性的, 因此这个比值并不依赖于空间偏移的方向, 只与偏移大小有关, 即零偏移两侧是对称的。 图4(b)中曲线存在轻微的不对称是由于光束斜入射导致的, 斜入射时的光斑不再是对称的圆形, 而是不对称的彗星状光斑。
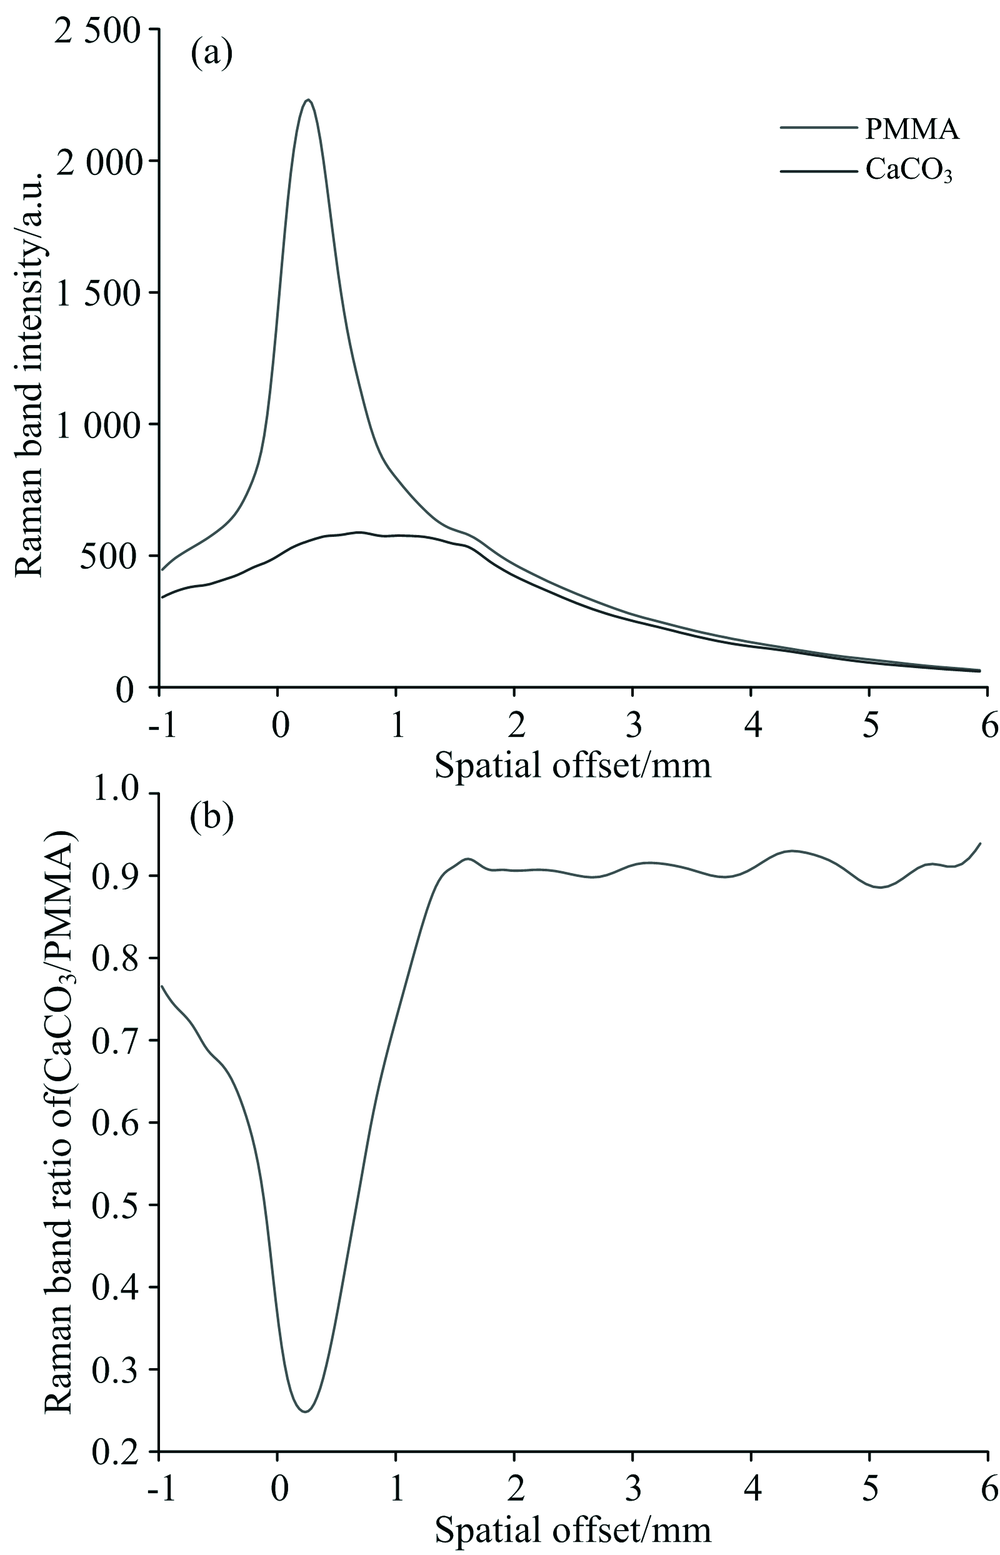 | 图4 拉曼散射信号与空间偏移的关系Fig.4 The dependence of Raman band intensities on the spatial offset(a), the Raman band intensity ratio (CaCO3/PMMA) (b) |
在容器和样品材质未知的情况下, 采用比例相减的方法仍可以得到各层干净的拉曼光谱。 首先选择零偏移和最优偏移距离处的拉曼光谱, 如图5中的“ Offset 0 mm” 和“ Offset 1.2 mm” 。 零偏移处的光谱为SP0, 最高峰代表的是容器壁的拉曼特征, 其值为v01, 拉曼频移为x01(图中虚线所在位置)。 最优空间偏移处的光谱为SP1, 对应拉曼频移x01处的值为v11, 则样品的拉曼光谱RS1为
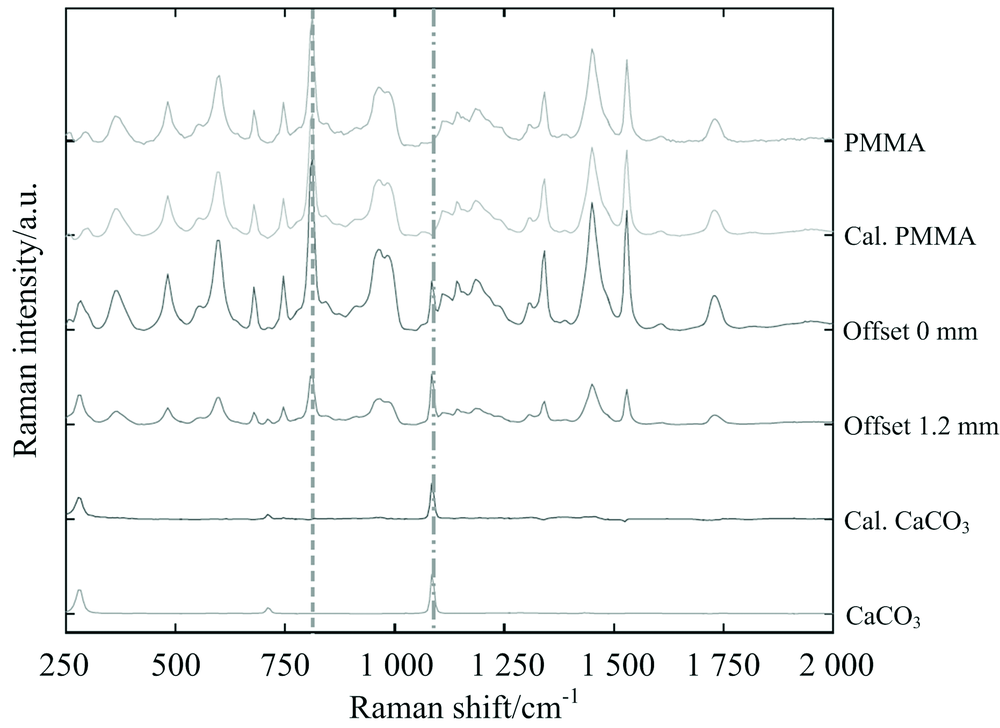 | 图5 比例相减法求得双层结构样品的各层的拉曼光谱Fig.5 Raman spectra obtained from a proportional subtraction with the zero and 1.2 mm offset |
样品的拉曼光谱RS1的最高峰代表的是样品的拉曼特征, 其拉曼频移为x12(图中点划线所在位置), 光谱SP1中对应位置的值为v12, 光谱SP0中对应位置的值为v02, 则容器壁的拉曼光谱RS0为
计算得到的PMMA光谱和CaCO3光谱如图5中的“ Cal. PMMA” 和“ Cal. CaCO3” 所示, 已经非常接近纯净物“ PMMA” 和“ CaCO3” 的拉曼光谱了。
通过设计搭建的实验装置, 对容器内样品的拉曼光谱进行测试, 分析发现随着空间偏移的增大, 容器壁(PMMA)的拉曼散射强度快速下降, 而样品(CaCO3)的拉曼散射强度先上升后缓慢下降。 对于此次样品, 在空间偏移1.2 mm处两者的比值(CaCO3/PMMA)达到最大值, 此处探测的效果最佳。 采用比例相减法, 对零偏移和最优空间偏移两处光谱进行计算, 得到干净的PMMA和CaCO3的拉曼光谱。 结果表明, 空间偏移拉曼光谱技术能有效的抑制容器产生的荧光和拉曼散射, 从而准确识别不透明、 有色容器内的样品, 弥补了传统拉曼光谱技术这方面的缺陷。 研究结果证明了空间偏移拉曼光谱技术在不透明、 有色容器内样品的检测方面的潜力, 也为空间偏移拉曼光谱仪的进一步研究和应用提供依据。
| [1] |
|
| [2] |
|
| [3] |
|
| [4] |
|
| [5] |
|
| [6] |
|
| [7] |
|
| [8] |
|
| [9] |
|